Abstract
Background
Parameters of body composition have prognostic potential in patients with oncologic diseases. The aim of the present study was to analyse the prognostic potential of radiomics‐based parameters of the skeletal musculature and adipose tissues in patients with advanced hepatocellular carcinoma (HCC).
Methods
Radiomics features were extracted from a cohort of 297 HCC patients as post hoc sub‐study of the SORAMIC randomized controlled trial. Patients were treated with selective internal radiation therapy (SIRT) in combination with sorafenib or with sorafenib alone yielding two groups: (1) sorafenib monotherapy (n = 147) and (2) sorafenib and SIRT (n = 150). The main outcome was 1‐year survival. Segmentation of muscle tissue and adipose tissue was used to retrieve 881 features. Correlation analysis and feature cleansing yielded 292 features for each patient group and each tissue type. We combined 9 feature selection methods with 10 feature set compositions to build 90 feature sets. We used 11 classifiers to build 990 models. We subdivided the patient groups into a train and validation cohort and a test cohort, that is, one third of the patient groups.
Results
We used the train and validation set to identify the best feature selection and classification model and applied it to the test set for each patient group. Classification yields for patients who underwent sorafenib monotherapy an accuracy of 75.51% and area under the curve (AUC) of 0.7576 (95% confidence interval [CI]: 0.6376–0.8776). For patients who underwent treatment with SIRT and sorafenib, results are accuracy = 78.00% and AUC = 0.8032 (95% CI: 0.6930–0.9134).
Conclusions
Parameters of radiomics‐based analysis of the skeletal musculature and adipose tissue predict 1‐year survival in patients with advanced HCC. The prognostic value of radiomics‐based parameters was higher in patients who were treated with SIRT and sorafenib.
Keywords: body composition, HCC, radiomics, sarcopenia
Introduction
Hepatocellular carcinoma (HCC) is the fifth most common malignant tumour disease in the world. 1 Cross‐sectional imaging, especially computed tomography (CT) and magnetic resonance imaging (MRI), plays an essential role in the diagnosis and local staging of HCC. Moreover, imaging can also provide data regarding tumour behaviour and prognosis.
For example, skeletal muscle condition has been identified as an important factor in patients with HCC in the study by Chang et al. (2018). 2 Their study also showed that low skeletal muscle mass (LSMM) could predict relevant outcomes in patients with HCC. 2 For instance, LSMM was associated with all‐cause mortality in patients with HCC (crude hazard ratio [HR] = 2.04, 95% confidence interval [CI]: 1.74–2.38; adjusted HR = 1.95, 95% CI: 1.60–2.37). 2 LSMM can also predict lower objective response rate (odds ratio [OR] = 0.37, 95% CI: 0.17–0.81, P = 0.012) and more drug‐related adverse events (OR = 2.23, 95% CI: 1.17–4.28, P = 0.015). 3 In addition, adipose tissue (AT), especially visceral adipose tissue (VAT), plays an important role in HCC. For instance, it was reported that preoperative visceral adiposity predicted poor outcomes after hepatectomy in patients with HCC. 4 High VAT area reportedly affects survival in patients with advanced HCC treated with tyrosine kinase inhibitors. 5
Some recent reports indicate that modern analysis of radiological images can provide more information about tissue composition. So far, radiomics is a modern analysis technique that quantitatively extracts features, including shape, size, intensity and texture of analysed tissue. 6 , 7 , 8 According to the literature, radiomics parameters quantitatively visualize the heterogeneity of analysed tissues and reflect underlying pathophysiological changes. 9 , 10 , 11 Radiomics parameters can predict tumour behaviour and prognosis, particularly in HCC. 10 Presumably, radiomics features of body compartments like skeletal muscles and AT may be more sensitive for prediction of unfavourable prognosis in HCC in comparison with conventional analysis of body composition.
The purpose of the presented work was to investigate a possible predictive role of radiomics‐based body composition parameters in patients with HCC undergoing palliative treatment.
Material and methods
Patient data
This is a sub‐study of the SORAMIC trial, a prospective, randomized‐controlled, phase II trial performed at 38 sites in 12 countries in Europe and Turkey. 12 The present study was performed within the palliative part of SORAMIC, where patients were randomized to receive sorafenib monotherapy or selective internal radiation therapy (SIRT) and sorafenib. 12 In short, patients were eligible if they had preserved liver function (Child‐Pugh ≤ B7), an Eastern Cooperative Oncology Group performance status (ECOG PS) ≤ 2 and unresectable tumours not eligible for curative treatment or transarterial chemoembolization (TACE). For this sub‐study, a post hoc analysis of the prospective trial was conducted and the endpoint was the 1‐year survival.
Overall, there were 422 patients involved in the palliative part of SORAMIC. In 53 patients, no CT images were available in our institution and they were excluded from the present analysis. Furthermore, 72 patients were excluded because image artefacts or low image quality hindered the subsequent image segmentation. Therefore, the final cohort comprised 297 patients. There were 38 women (12.8%) and 259 men (87.2%) with a mean age of 67.0 ± 8.1 years, median age of 67 years, ranging from 46 to 85 years. After 1 year, 139 patients were alive and 158 deceased. We created two subgroups: Subgroup 1 comprises 147 patients with sorafenib monotherapy, and Subgroup 2 comprises only patients receiving sorafenib and SIRT (n = 150). Baseline patient characteristics are summarized in Table 1 .
Table 1.
Clinical baseline characteristics of the two subgroups
| Characteristics |
Subgroup 1 Sorafenib (n = 147) |
Subgroup 2 Sorafenib + SIRT (n = 150) |
|---|---|---|
| Age, years, median (range) | 68 (46–85) | 67 (50–84) |
| Male/female (%) | 86.4/13.6 | 88.0/12.0 |
| BCLC stage (%) | ||
| A | 1.3 | 3.3 |
| B | 32.0 | 31.3 |
| C | 66.7 | 65.4 |
| Aetiology, n (%) | ||
| AIH | 1 (0.7) | 0 (0) |
| Alcohol | 54 (36.7) | 59 (39.3) |
| Alcohol + viral | 4 (2.7) | 10 (6.7) |
| HBV | 13 (8.8) | 11 (7.3) |
| HCV | 29 (19.7) | 29 (19.3) |
| HC | 1 (0.7) | 6 (4.0) |
| NAFLD | 10 (6.8) | 6 (4.0) |
| NASH | 8 (5.4) | 13 (8.7) |
| NS | 4 (2.7) | 3 (2.0) |
| Cryptogenic | 23 (15.6) | 13 (8.7) |
| NAT | 0 | 1 (0.7) |
| ECOG (%) | 0: 73.4 | 0: 69.3 |
| 1: 25.9 | 1: 28.7 | |
| 2: 0.7 | C: 2.0 |
Abbreviations: AIH, autoimmune hepatitis; BCLC, Barcelona Clinic Liver Cancer; ECOG, Eastern Cooperative Oncology Group; HBV, hepatitis B virus; HC, haemochromatosis; HCV, hepatitis C virus; NAFLD, non‐alcoholic fatty liver disease; NASH, non‐alcoholic steatohepatitis; NAT, non‐alcoholic toxic; NS, not specified; SIRT, selective internal radiation therapy.
Methods
In the following, we describe the preprocessing of the medical image data, the radiomics‐based feature extraction, the selection process to build various feature sets and the training of classifiers. The proposed workflow is illustrated in Figure 1 .
Figure 1.
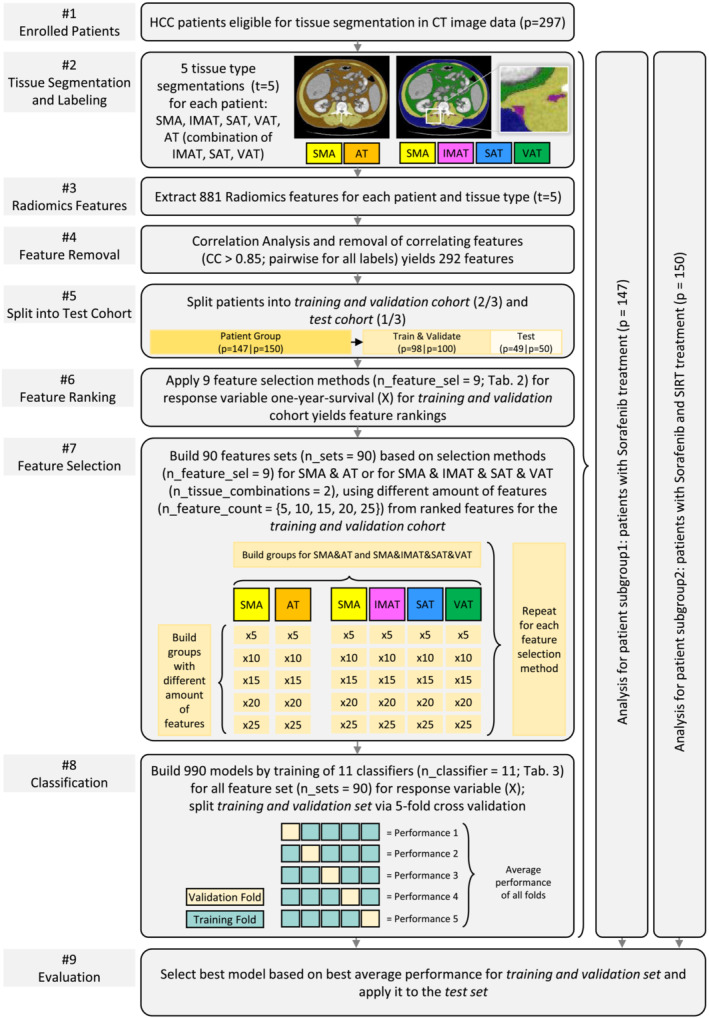
Pipeline illustrating our workflow. AT, adipose tissue subdivided into intramuscular adipose tissue (IMAT), subcutaneous adipose tissue (SAT) and visceral adipose tissue (VAT); CC, correlation coefficient; CT, computed tomography; HCC, hepatocellular carcinoma; SIRT, selective internal radiation therapy; SMA, skeletal muscle area.
Tissue segmentation
Based on the CT image data, skeletal muscle area (SMA) and AT were segmented at the height of the L3 vertebrae (see Figure 2 ). The segmentations were obtained semi‐automatically with the freely available ImageJ software 1.48v (National Institutes of Health Image programme). For further analysis, axial CT images at the L3 level in the soft tissue window (window, 45–250 HU) during portal venous phase were used. The segmentation comprised four tissue types: the SMA, which covers the musculus rectus abdominis, abdominal wall muscles, musculus psoas major, musculus quadratus lumborum and musculus erector spinae, as well as the AT subdivided into intramuscular adipose tissue (IMAT), subcutaneous adipose tissue (SAT) and VAT. For prognostic evaluation of radiomics analysis, we analysed two combinations: SMA and AT, as well as SMA and SAT, IMAT and VAT.
Figure 2.
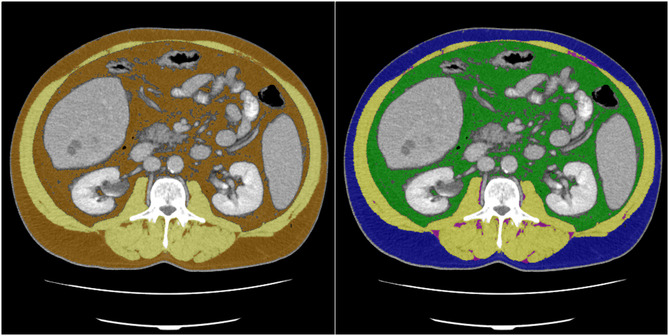
Labelled ground truth data with skeletal muscle mass (SMA) and adipose tissue (left) and SMA, intramuscular adipose tissue, subcutaneous adipose tissue and visceral adipose tissue (right).
Radiomic feature extraction
For extraction of radiomic features, we used the pyradiomics library (https://pyradiomics.readthedocs.io/en/latest/), which is a Python‐based implementation, 13 and applied it to the CT data. All datasets were normalized to −1024 and 1000 HU following the pyradiomics normalization steps. Tissue labels were created from the medical expert's segmentation. We used the settings that were recommended for CT data and automatically extracted 881 features for each of the four segmented tissue types (SMA, IMAT, SAT and VAT), as well as all fatty tissue labels combined for the fifth tissue type (AT). The results were stored in a large Excel file for subsequent analysis with MATLAB 2021a (The MathWorks, Natick, MA, USA; www.mathworks.com).
Feature cleansing
A correlation analysis was performed via MATLAB. In order to account for non‐normal features, we opted for Spearman's correlation instead of Pearson's correlation. We removed correlating features with correlation larger than 0.85 if the correlated feature pair was present in all tissue types. The first feature of the feature pair is removed, and the second one is kept until no correlating features exist. Feature cleansing reduced the feature number to 292 features for each patient and each tissue type.
Feature selection
For feature ranking, we applied nine feature selection methods, which are listed in Table 2 . The classifiers comprise infinite latent feature selection (ILFS), 14 , 15 feature selection via eigenvector centrality (ECFS), ReliefF algorithm, mutual information (MI), laplacian, fisher score, dependence‐guided unsupervised feature selection (DGUFS), unsupervised feature selection with ordinal locality (UFSOL) and least absolute shrinkage and selection operator (LASSO). 16 We utilized the MATLAB framework Feature Selection Code Library (FSLib) for this step. 14 , 15 , 16
Table 2.
Feature selection methods for extraction of feature ranking
| Number | Abbreviation | Algorithm |
|---|---|---|
| 1 | ILFS | Infinite latent feature selection |
| 2 | ECFS | Feature selection via eigenvector centrality |
| 3 | ReliefF | ReliefF |
| 4 | MI | Mutual information |
| 5 | laplacian | Laplacian |
| 6 | fisher | Fisher's score |
| 7 | DGUFS | Dependence‐guided unsupervised feature selection |
| 8 | UFSOL | Unsupervised feature selection with ordinal locality |
| 9 | LASSO | Least absolute shrinkage and selection operator |
Afterwards, we built feature sets using different feature set sizes (n_feature_count = {5,10,15,20,25}). A feature count of 5 means that the 5 highest ranked features (based on one of the feature ranking algorithms) are selected to build a feature set. We opted for the two tissue subdivisions:
extracting features for SMA and AT; and
extracting features for SMA, IMAT, SAT and VAT.
For example, applying a feature count of 5, this results in 10 features (5 from SMA and 5 from AT) for the first option and 20 features (5 from SMA, 5 from IMAT, 5 from SAT and 5 from VAT) for the second option. Using the different feature counts, we obtain 5 combinations for the 2 options and the 9 feature selection methods yielding a total of 90 feature sets. The feature sets are also illustrated in Figure 1 , Step #7 Feature Selection.
Training of classifiers
For the classification based on the ranked feature sets, we trained 11 classifiers, similar to a previous study, 17 but added linear logistic regression (LogReg). The classifiers are listed in Table 3 . The classifiers Adaptive boosting classifier (ADAC), bagging classifier (BAGC), decision tree classifier (DTC), K nearest neighbourhood classifier (KNNC), random forest classifier (RFC), support vector machine classifier (SVMC) and LogReg were implemented via MATLAB's Statistics and Machine Learning Toolbox. For Bernoulli Naïve Bayesian (BNB), stochastic gradient descent classifier (SGDC) and extreme gradient boosting classifier (XGBC), the publicly available MATLAB third‐party toolboxes were adapted to our requirements and integrated in our workflow. 18 , 19 , 20
Table 3.
Machine learning algorithms for 1‐year survival classification
| Number | Abbreviation | Algorithm |
|---|---|---|
| 1 | ADAC | Adaptive boosting classifier |
| 2 | BAGC | Bagging classifier |
| 3 | BNB | Bernoulli Naïve Bayesian |
| 4 | DTC | Decision tree classifier |
| 5 | GNBC | Gaussian Naïve Bayesian classifier |
| 6 | KNNC | K nearest neighbourhood classifier |
| 7 | RFC | Random forest classifier |
| 8 | SGDC | Stochastic gradient descent classifier |
| 9 | SVMC | Support vector machine classifier |
| 10 | XGBC | Extreme gradient boosting classifier |
| 11 | LogReg | Linear logistic regression |
As illustrated in Figure 1 , each classifier was trained for the 90 feature sets yielding 990 trained models. We split each patient group into a training and validation set, comprising two thirds of the patients, and a test set, comprising one third of the patients. Performance for training and validation was measured based on five‐fold cross‐validation and averaging over the individual folds' accuracies.
Next, we evaluated the classifiers' performance for the test sets for Subgroup 1, that is, patients who underwent sorafenib monotherapy, and Subgroup 2, that is, patients who underwent SIRT and sorafenib treatment.
Results
We applied the presented pipeline to 297 patients, where 139 patients were alive and 158 deceased after 1 year. Subgroup 1 comprises 147 patients with sorafenib monotherapy, and Subgroup 2 comprises only patients (n = 150) receiving sorafenib and SIRT. For the trained models, linear logistic regression performed best for the subgroup treated with sorafenib with an accuracy of 75.51%. The accuracy was 78.00% for the subgroup treated with SIRT and sorafenib based on the ADAC classifier. True positive (TP), true negative (TN), false positive (FP) and false negative (FN) values are illustrated in Figure 3 .
Figure 3.
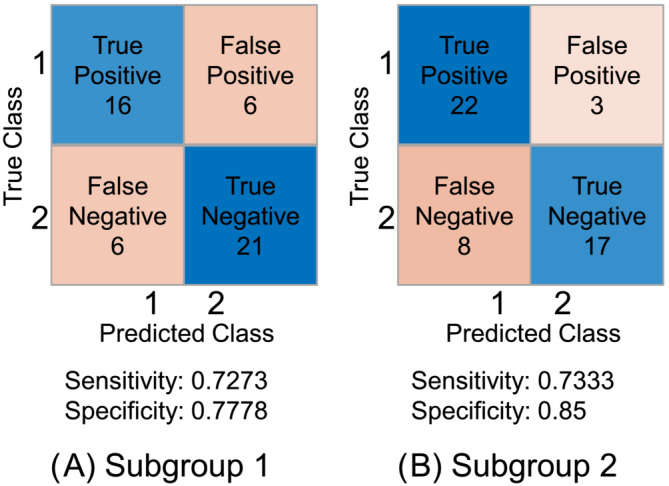
(A, B) Depiction of class versus prediction including true positive, false positive, false negative, true negative, sensitivity and specificity. Positive class (1) indicates that 1‐year survival is positive, that is, the patients live, and negative class (2) indicates that 1‐year survival is negative, that is, the patients are deceased.
The resulting receiver operating characteristic (ROC) curves for the two patient groups are presented in Figures 4 and 5 . The ROC yields an area‐under‐the‐curve (AUC) value of 0.7576 with a 95% CI of 0.6376–0.8776 for Subgroup 1. For Subgroup 2, AUC was 0.8032 (95% CI: 0.6930–0.9134).
Figure 4.
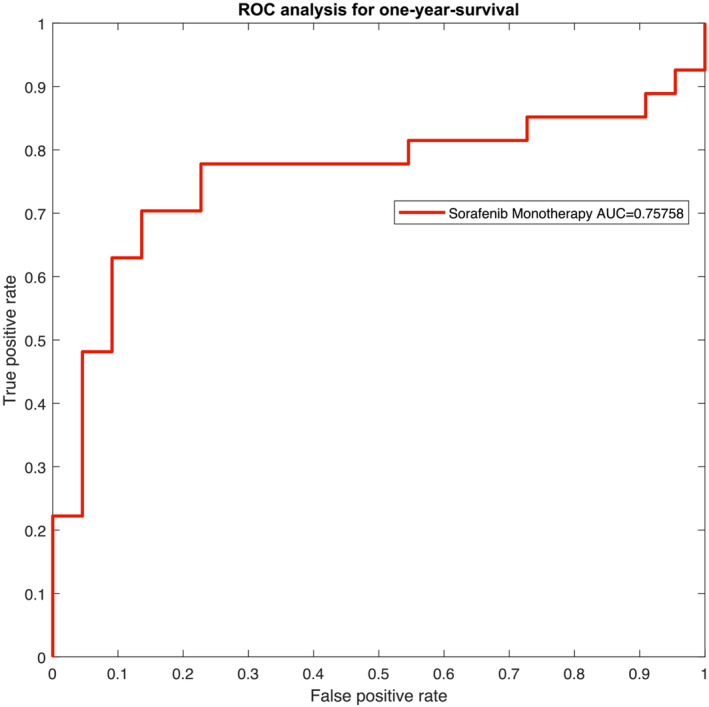
Depiction of the receiver operating characteristic (ROC) curve for Subgroup 1, that is, patients who underwent sorafenib monotherapy. AUC, area under the curve.
Figure 5.
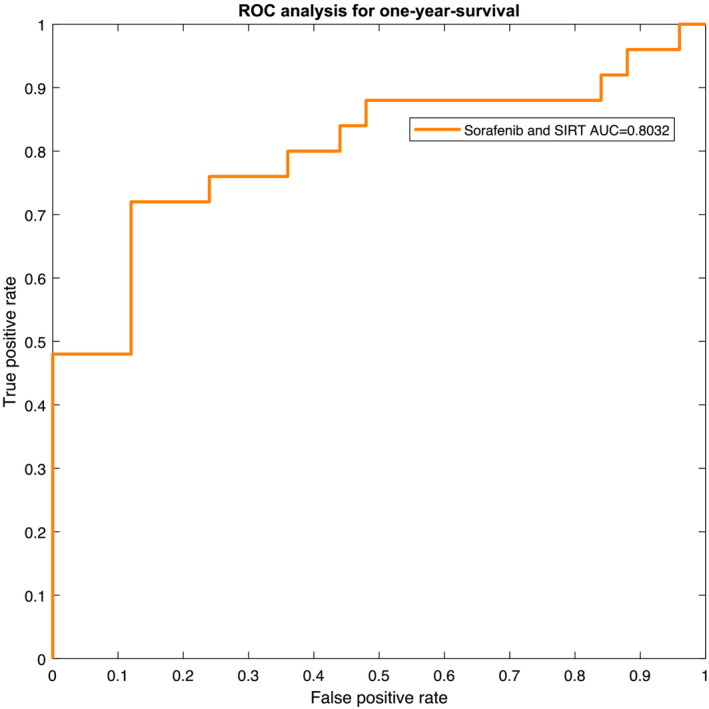
Depiction of the receiver operating characteristic (ROC) curve for Subgroup 2, that is, patients who underwent selective internal radiation therapy (SIRT) and sorafenib treatment. AUC, area under the curve.
For all the 990 trained models, the best classification result was achieved by a feature set comprising SMA and AT and applying the ReliefF feature selection method.
Discussion
As already mentioned, parameters of body composition are of prognostic significance in HCC. So far, in curative setting (hepatectomy), LSMM predicted lower overall survival (OS) (HR = 2.17, 95% CI: 1.48–3.19, P < 0.00001). 21 Interestingly, LSMM was also associated with lower recurrence‐free survival after tumour resection (HR = 1.79, 95% CI: 1.28–2.50, P < 0.00001). 21 Furthermore, in palliative setting, sarcopenic patients with HCC treated with kinase inhibitors like sorafenib or lenvatinib showed lower OS (HR = 2.24, 95% CI: 1.60–3.14, P < 0.00001) than patients without sarcopenia. 21
Also, AT plays an important role in HCC. Patients with high subcutaneous adipose tissue index (SATI) had significantly better progression‐free survival (P = 0.0093) and OS (P = 0.032) than those with low SATI. 22 In contrast, patients with high VAT had shorter OS (HR = 1.35, 95% CI: 1.09–1.66, P < 0.005). 23 Finally, high VAT to SAT ratio also predicted negative OS (HR = 1.57, 95% CI: 1.22–2.01, P < 0.001). 4
Importantly, the quality of the skeletal musculature and AT also plays a significant role. In fact, tumour patients with low density of the skeletal musculature had a 75% higher mortality risk than patients with high or normal muscle density (HR = 1.75, 95% CI: 1.60–1.92, P < 0.00001). 24 Moreover, in HCC, low skeletal muscle density was stronger associated with mortality risk (HR = 1.88, 95% CI: 1.40–2.52, P < 0.00001). 24 Furthermore, high density of SAT and VAT correlated negatively with survival in patients with HCC. 25 , 26
Therefore, a deep analysis of the quality of the skeletal musculature and AT may provide novel relevant parameters that can have predictive values in HCC. Our results confirm this hypothesis. The present work is the first report about the prognostic role of radiomics parameters of body composition compartments in HCC. As shown in the presented study, radiomics features of the skeletal musculature and AT can predict 1‐year survival, with an accuracy value of 75.51% (AUC = 0.7576, 95% CI: 0.6376–0.8776) for patients who underwent sorafenib monotherapy and an accuracy value of 78.00% (AUC = 0.8032, 95% CI: 0.6930–0.9134) for patients who underwent treatment with SIRT and sorafenib.
Our values for the radiomics‐based analysis of the two subgroups are superior to those reported for the conventional analysis of body composition. For example, Hou et al. 27 showed that sarcopenia can predict 1‐year survival in HCC with an AUC value of 0.7. In addition, there was no relevant association of body composition parameters with OS either in the sorafenib monotherapy subgroup or in the sorafenib and SIRT treatment subgroup. 28
The identified significant influence of the quality of the skeletal muscles and fat investigated by radiomics‐based parameters on survival in patients with HCC is multifactorial. 29 The skeletal musculature significantly influences the immune system. 30 For instance, skeletal muscles produce several cytokines (myokines) with immune effects. 31 So far, interleukin (IL)‐15 is a myokine that stimulates proliferation and activation of natural killer (NK) cells and CD8+ T lymphocytes, which have an important antitumoural effect. 32 Interestingly, intravenous administration of IL‐15 induced a significant increase of circulating CD8+ T and NK cells in patients with different tumours. 33 Presumably, reduced and/or altered musculature may synthesize a smaller number of myokines. AT also plays an important role in immune anticancer activity. VAT secrets proinflammatory cytokines tumour necrosis factor‐α and IL‐6. 34 Furthermore, VAT correlated with circulating leptin level. 35 Leptin promotes the growth and proliferation of tumour cells by activating various signalling pathways. 36 In HCC, leptin promotes invasion and migration of HCC cells. 37
We hypothesize that texture analysis parameters of the skeletal musculature and AT may reflect deep changes and metabolic activity of the tissues.
Our study has several limitations. The manual segmentation of SMA, IMAT, SAT and VAT is error‐prone and could be improved by additional readers. However, as the radiomics features are due to structural or textural peculiarities, the influence of smaller components or small variations within the segmentation is considered to be very small. Future work can replace the manual segmentations with automatic ones. 38 , 39
In addition, although the present data are based on a multicentre cohort, the postprocessing was performed unicentric, that is, a single university hospital. Therefore, we subdivided the data into a test cohort and a training and validation cohort. In future work, we plan to extend our approach to a multicentre study, as conducted by Feng et al. 40
In conclusion, parameters of radiomics‐based analysis of the skeletal musculature and AT predict 1‐year survival in patients with advanced HCC. The prognostic value of radiomics‐based parameters was higher in patients who were treated with SIRT and sorafenib.
Conflict of interest statement
The authors declare that there are no conflicts of interest.
Acknowledgements
This work is partly funded by the Federal Ministry of Education and Research within the Research Campus STIMULATE (grant no. 13GW0473A). SORAMIC is an investigator‐initiated trial sponsored by the University of Magdeburg. Financial support was granted by Sirtex Medical and Bayer Healthcare. The authors of this manuscript certify that they comply with the ethical guidelines for authorship and publishing in the Journal of Cachexia, Sarcopenia and Muscle. 41
We acknowledge support by the Open Access Publication Fund of Magdeburg University (Project DEAL).
Saalfeld S., Kreher R., Hille G., Niemann U., Hinnerichs M., Öcal O., et al (2023) Prognostic role of radiomics‐based body composition analysis for the 1‐year survival for hepatocellular carcinoma patients, Journal of Cachexia, Sarcopenia and Muscle, 14, 2301–2309, 10.1002/jcsm.13315
References
- 1. EASL Clinical Practice Guidelines: management of hepatocellular carcinoma. J Hepatol 2018;69:182–236. [DOI] [PubMed] [Google Scholar]
- 2. Chang KV, Chen JD, Wu WT, Huang KC, Hsu CT, Han DS. Association between loss of skeletal muscle mass and mortality and tumor recurrence in hepatocellular carcinoma: a systematic review and meta‐analysis. Liver Cancer 2018;7:90–103. [DOI] [PMC free article] [PubMed] [Google Scholar]
- 3. Guo Y, Ren Y, Zhu L, Yang L, Zheng C. Association between sarcopenia and clinical outcomes in patients with hepatocellular carcinoma: an updated meta‐analysis. Sci Rep 2023;13:934. [DOI] [PMC free article] [PubMed] [Google Scholar]
- 4. Hamaguchi Y, Kaido T, Okumura S, Kobayashi A, Shirai H, Yao S, et al. Preoperative visceral adiposity and muscularity predict poor outcomes after hepatectomy for hepatocellular carcinoma. Liver Cancer 2019;8:92–109. [DOI] [PMC free article] [PubMed] [Google Scholar]
- 5. Nault JC, Pigneur F, Nelson AC, Costentin C, Tselikas L, Katsahian S, et al. Visceral fat area predicts survival in patients with advanced hepatocellular carcinoma treated with tyrosine kinase inhibitors. Dig Liver Dis 2015;47:869–876. [DOI] [PubMed] [Google Scholar]
- 6. Aerts HJWL, Velazquez ER, Leijenaar RTH, Parmar C, Grossmann P, Carvalho S, et al. Decoding tumour phenotype by noninvasive imaging using a quantitative radiomics approach. Nat Commun 2014;5:4006. [DOI] [PMC free article] [PubMed] [Google Scholar]
- 7. Lambin P, Leijenaar RTH, Deist TM, Peerlings J, Jong EEC, van Timmeren J, et al. Radiomics: the bridge between medical imaging and personalized medicine. Nat Rev Clin Oncol 2017;14:749–762. [DOI] [PubMed] [Google Scholar]
- 8. Kumar V, Gu Y, Basu S, Berglund A, Eschrich SA, Schabath MB, et al. Radiomics: the process and the challenges. Magn Reson Imaging 2012;30:1234–1248. [DOI] [PMC free article] [PubMed] [Google Scholar]
- 9. Lubner MG, Smith AD, Sandrasegaran K, Sahani DV, Pickhardt PJ. CT texture analysis: definitions, applications, biologic correlates, and challenges. Radiographics 2017;37:1483–1503. [DOI] [PubMed] [Google Scholar]
- 10. Masokano IB, Liu W, Xie S, Marcellin DFH, Pei Y, Li W. The application of texture quantification in hepatocellular carcinoma using CT and MRI: a review of perspectives and challenges. Cancer Imaging 2020;20:67. [DOI] [PMC free article] [PubMed] [Google Scholar]
- 11. Miranda Magalhaes Santos JM, Clemente Oliveira B, Araujo‐Filho JAB, Assuncao AN Jr, Machado FA, Carlos Tavares Rocha C, et al. State‐of‐the‐art in radiomics of hepatocellular carcinoma: a review of basic principles, applications, and limitations. Abdom Radiol 2022;45:342–353. [DOI] [PubMed] [Google Scholar]
- 12. Ricke J, Schinner R, Seidensticker M, Gasbarrini A, van Delden OM, Amthauer H, et al. Liver function after combined selective internal radiation therapy or sorafenib monotherapy in advanced hepatocellular carcinoma. J Hepatol 2021;75:1387–1396. [DOI] [PubMed] [Google Scholar]
- 13. van Griethuysen JJM, Fedorov A, Parmar C, Hosny A, Aucoin N, Narayan V, et al. Computational radiomics system to decode the radiographic phenotype. Cancer Res 2017;77:e104–e107. [DOI] [PMC free article] [PubMed] [Google Scholar]
- 14. Roffo G, Melzi S, Cristani M. Infinite feature selection. In 2015 IEEE International Conference on Computer Vision (ICCV); 2015. p 4202–4210. [Google Scholar]
- 15. Roffo G, Melzi S, Castellani U, Vinciarelli A. Infinite latent feature selection: a probabilistic latent graph‐based ranking approach. In IEEE International Conference on Computer Vision (ICCV); 2017. [Google Scholar]
- 16. Roffo G, Melzi S. Features selection via eigenvector centrality. In Proceedings of New Frontiers in Mining Complex Patterns; 2016. p 2016. [Google Scholar]
- 17. Tang Y, Yang CM, Su S, Wang WJ, Fan LP, Shu J. Machine learning‐based Radiomics analysis for differentiation degree and lymphatic node metastasis of extrahepatic cholangiocarcinoma. BMC Cancer 2021;21:1268. [DOI] [PMC free article] [PubMed] [Google Scholar]
- 18. Kasai H. SGDLibrary: a MATLAB library for stochastic optimization algorithms. J Mach Learn Res 2018;18:1–5. [Google Scholar]
- 19. Prehn J. Functions to run xgboost in Matlab. MATLAB Central File Exchange. 2022. https://www.mathworks.com/matlabcentral/fileexchange/75898‐functions‐to‐run‐xgboost‐in‐matlab. Accessed 18 May 2022. [Google Scholar]
- 20. Chen M. Pattern recognition and machine learning toolbox. 2022. https://github.com/PRML/PRMLT. Accessed 18 May 2022. [Google Scholar]
- 21. March C, Omari J, Thormann M, Pech M, Wienke A, Surov A. Prevalence and role of low skeletal muscle mass (LSMM) in hepatocellular carcinoma. A systematic review and meta‐analysis. Clin Nutr ESPEN 2022;49:103–113. [DOI] [PubMed] [Google Scholar]
- 22. Li LQ, Zhao WD, Su TS, Wang YD, Meng WW, Liang SX. Effect of body composition on outcomes in patients with hepatocellular carcinoma undergoing radiotherapy: a retrospective study. Nutr Cancer 2022;1–10. [DOI] [PubMed] [Google Scholar]
- 23. Fujiwara N, Nakagawa H, Kudo Y, Tateishi R, Taguri M, Watadani T, et al. Sarcopenia, intramuscular fat deposition, and visceral adiposity independently predict the outcomes of hepatocellular carcinoma. J Hepatol 2015;63:131–140. [DOI] [PubMed] [Google Scholar]
- 24. Aleixo GFP, Shachar SS, Nyrop KA, Muss HB, Malpica L, Williams GR. Myosteatosis and prognosis in cancer: systematic review and meta‐analysis. Crit Rev Oncol Hematol 2020;145:102839. [DOI] [PubMed] [Google Scholar]
- 25. Hessen L, Roumet M, Maurer MH, Lange N, Reeves H, Dufour JF, et al. High subcutaneous adipose tissue density correlates negatively with survival in patients with hepatocellular carcinoma. Liver Int 2021;41:828–836. [DOI] [PubMed] [Google Scholar]
- 26. Ebadi M, Dunichand‐Hoedl AR, Rider E, Kneteman NM, Shapiro J, Bigam D, et al. Higher subcutaneous adipose tissue radiodensity is associated with increased mortality in patients with cirrhosis. JHEP Rep Innov Hepatol 2022;4:100495. [DOI] [PMC free article] [PubMed] [Google Scholar]
- 27. Hou GM, Jiang C, Du JP, Yuan KF. Sarcopenia predicts an adverse prognosis in patients with combined hepatocellular carcinoma and cholangiocarcinoma after surgery. Cancer Med 2022;11:317–331. [DOI] [PMC free article] [PubMed] [Google Scholar]
- 28. Surov A, Thormann M, Hinnerichs M, Seidensticker M, Seidensticker R, Öcal O, et al. Impact of body composition in advanced liver hepatocellular carcinoma: a subanalysis of the SORAMIC trial. Hepatol Commun, HEP4–22‐0663R2 – accepted for publication 7. 10.1097/HC9.0000000000000165 [DOI] [PMC free article] [PubMed] [Google Scholar]
- 29. Labeur TA, van Vugt JLA, Cate DWG, Takkenberg RB, IJzermans JNM, Groot Koerkamp B, et al. Body composition is an independent predictor of outcome in patients with hepatocellular carcinoma treated with sorafenib. Liver Cancer 2019;8:255–270. [DOI] [PMC free article] [PubMed] [Google Scholar]
- 30. Kitano Y, Yamashita YI, Saito Y, Nakagawa S, Okabe H, Imai K, et al. Sarcopenia affects systemic and local immune system and impacts postoperative outcome in patients with extrahepatic cholangiocarcinoma. World J Surg 2019;43:2271–2280. [DOI] [PubMed] [Google Scholar]
- 31. Nelke C, Dziewas R, Minnerup J, Meuth SG, Ruck T. Skeletal muscle as potential central link between sarcopenia and immune senescence. EBioMedicine 2019;49:381–388. [DOI] [PMC free article] [PubMed] [Google Scholar]
- 32. Conlon C, Lugli E, Welles HC, Rosenberg SA, Fojo AT, Morris JC, et al. Redistribution, hyperproliferation, activation of natural killer cells and CD8 T cells, and cytokine production during first‐in‐human clinical trial of recombinant human interleukin‐15 in patients with cancer. J Clin Oncol 2015;33:74–82. [DOI] [PMC free article] [PubMed] [Google Scholar]
- 33. Conlon KC, Potter EL, Pittaluga S, Lee CCR, Miljkovic MD, Fleisher TA, et al. IL15 by continuous intravenous infusion to adult patients with solid tumors in a phase I trial induced dramatic NK‐cell subset expansion. Clin Cancer Res 2019;25:4945–4954. [DOI] [PMC free article] [PubMed] [Google Scholar]
- 34. Marra F, Bertolani C. Adipokines in liver diseases. Hepatology 2009;50:957–969. [DOI] [PubMed] [Google Scholar]
- 35. Indulekha K, Anjana RM, Surendar J, Mohan V. Association of visceral and subcutaneous fat with glucose intolerance, insulin resistance, adipocytokines and inflammatory markers in Asian Indians (CURES‐113). Clin Biochem 2011;44:281–287. [DOI] [PubMed] [Google Scholar]
- 36. Sharma D, Wang J, Fu PP, Sharma S, Nagalingam A, Mells J, et al. Adiponectin antagonizes the oncogenic actions of leptin in hepatocellular carcinogenesis. Hepatology 2010;52:1713–1722. [DOI] [PMC free article] [PubMed] [Google Scholar]
- 37. Saxena NK, Sharma D, Ding X, Lin S, Marra F, Merlin D, et al. Concomitant activation of the JAK/STAT, PI3K/AKT, and ERK signaling is involved in leptin‐mediated promotion of invasion and migration of hepatocellular carcinoma cells. Cancer Res 2007;67:2497–2507. [DOI] [PMC free article] [PubMed] [Google Scholar]
- 38. Kreher R, Hinnerichs M, Preim B, Saalfeld S, Surov A. Deep‐learning‐based segmentation of skeletal muscle mass in routine abdominal CT scans. In Vivo 2022;36:1807–1811. [DOI] [PMC free article] [PubMed] [Google Scholar]
- 39. Paris MT, Tandon P, Heyland DK, Furberg H, Premji T, Low G, et al. Automated body composition analysis of clinically acquired computed tomography scans using neural networks. Clin Nutr 2020;39:3049–3055. [DOI] [PMC free article] [PubMed] [Google Scholar]
- 40. Feng L, Liu Z, Li C, Li Z, Lou X, Shao L, et al. Development and validation of a radiopathomics model to predict pathological complete response to neoadjuvant chemoradiotherapy in locally advanced rectal cancer: a multicentre observational study. Lancet Digital Health 2022;4:e8–e17. [DOI] [PubMed] [Google Scholar]
- 41. von Haehling S, Morley JE, Coats AJS, Anker SD. Ethical guidelines for publishing in the Journal of Cachexia, Sarcopenia and Muscle: update 2021. J Cachexia Sarcopenia Muscle 2021;12:2259–2261. [DOI] [PMC free article] [PubMed] [Google Scholar]


