

Abstract
Background
Malignant ascites is prevalent in advanced‐stage ovarian cancer and may facilitate identification of the drivers of muscle loss. This study aimed to evaluate the association of ascites with changes in systemic inflammation and muscle after treatment of advanced‐stage ovarian cancer.
Methods
We evaluated 307 patients with advanced‐stage (III/IVA) ovarian cancer who underwent primary debulking surgery and adjuvant platinum‐based chemotherapy between 2010 and 2019. The changes in skeletal muscle index (SMI) and radiodensity (SMD) were measured using pre‐surgery and post‐chemotherapy portal‐venous phase contrast‐enhanced computed tomography scans at L3. Systemic inflammation was measured using albumin levels, prognostic nutritional index (PNI), neutrophil‐lymphocyte ratio (NLR), and platelet‐lymphocyte ratio (PLR). Primary endpoint was the changes in SMI and SMD after treatment. Linear regression analysis was used to test associations between muscle change and other covariates. Mediation analysis was used to determine the mediator.
Results
The median (range) age was 53 (23–83) years. The median duration (range) of follow‐up was 5.2 (1.1–11.3) years. Overall, 187 (60.9%) patients had ascites. The changes in muscle and systemic inflammatory markers after treatment were significantly different between patients with and without ascites (SMI: −3.9% vs. 2.2%, P < 0.001; SMD: −4.0% vs. −0.4%, P < 0.001; albumin: −4.4% vs. 2.1%, P < 0.001; PNI: −8.4% vs. −0.1%, P < 0.001; NLR: 20.6% vs. −29.4%, P < 0.001; and PLR: 1.7% vs. −19.4%, P < 0.001). The changes in SMI and SMD were correlated with the changes in albumin, PNI, NLR, and PLR (all P < 0.001). In multiple linear regression, ascites and NLR changes were negatively while albumin change was positively correlated with SMI change (ascites: β = −3.19, P < 0.001; NLR change: β = −0.02, P = 0.003; albumin change: β = 0.37, P < 0.001). Ascites and NLR changes were negatively while PNI change was positively correlated with SMD change (ascites: β = −1.28, P = 0.02; NLR change: β = −0.02, P < 0.001; PNI change: β = 0.11, P = 0.04). In mediation analysis, ascites had a direct effect on SMI change (P < 0.001) and an indirect effect mediated by NLR change (indirect effects = −1.61, 95% confidence interval [CI]: −2.22 to −1.08) and albumin change (indirect effects = −2.92, 95% CI: −4.01 to −1.94). Ascites had a direct effect on SMD change (P < 0.001) and an indirect effect mediated by NLR change (indirect effects = −1.76, 95% CI: −2.34 to −1.22) and PNI change (indirect effects = −2.00, 95% CI: −2.79 to −1.36).
Conclusions
Malignant ascites was associated with enhanced systemic inflammation and muscle loss after primary debulking surgery and adjuvant chemotherapy in advanced‐stage ovarian cancer. The association between ascites and muscle loss may be mediated by systemic inflammation.
Keywords: Malignant ascites, Ovarian cancer, Skeletal muscle, Survival, Systemic inflammation
Introduction
Ovarian cancer is the most lethal gynaecological malignancy worldwide. 1 Approximately 70–80% of patients have stage III––IV disease at diagnosis, 2 , 3 , 4 and the treatment for advanced disease is cytoreductive surgery in conjunction with adjuvant or neo‐adjuvant platinum‐based chemotherapy. 5 During the course of treatment, patients may experience treatment‐related side effects, malnutrition, physical inactivity, and increased systemic inflammation that can impair the skeletal muscle, which can affect survival outcomes. 6 , 7 , 8 , 9 , 10 , 11 To improve muscle function in these patients, it is important to investigate the underlying mechanisms and potential modifiers that can guide interventions.
Malignant ascites is present in about 40–70% of patients with advanced‐stage ovarian cancer and may affect muscle metabolism. 12 , 13 Malignant ascites is a complex reservoir of cellular and acellular components that collectively provide a pro‐inflammatory and tumour‐promoting microenvironment, serving as a novel condition to study the impact of both tumour‐derived and systemic factors in the cachexia system. 14 In pre‐clinical study studies, Pin et al. implanted ES‐2 human ovarian cancer cells intraperitoneally in a mouse model to simulate disseminated abdominal disease and ascites formation. Their results showed that intraperitoneal development of ES‐2 ovarian cancer cells can cause muscle atrophy, in conjunction with enhanced muscle protein catabolism, abnormal mitochondrial homoeostasis, and increased levels of pro‐inflammatory cytokines. 15 , 16 Ubachs et al. also recently revealed that ascites of sarcopenic ovarian cancer patients induces pronounced skeletal muscle protein metabolism changes in C2C12 skeletal muscle cells that correlated with clinical muscle measures of the patient. 14 However, there is a lack of clinical studies evaluating the effect of malignant ascites on systemic inflammation and muscle in patients with advanced‐stage ovarian cancer.
The quality and quantity of the skeletal muscle can be objectively evaluated using computed tomography (CT) scans acquired during cancer care, 17 and the prognostic value of CT‐based muscle measurement has been validated in previous studies. 6 , 7 , 8 , 9 , 10 The cross‐sectional areas of the skeletal muscle on a single CT slice at the level of the third lumbar vertebra (L3) are highly correlated with the total body skeletal muscle mass. The skeletal muscle index (SMI) is a measure of muscle quantity, while the skeletal muscle radiodensity (SMD) is a surrogate marker of the degree of fatty infiltration in muscles. 18 Low SMD has been linked to aberrant fat infiltration in the muscle (myosteatosis), which is associated with decreased muscle strength and functional performance. 19 In addition, the systemic inflammation status can be evaluated using routine laboratory tests. The albumin level, prognostic nutritional index (PNI), neutrophil‐lymphocyte ratio (NLR), and platelet‐lymphocyte ratio (PLR) are commonly used to predict treatment outcomes. 20 , 21 , 22 , 23 , 24
We hypothesized a mediation model (Figure 1) based on the following assumptions: (i) Malignant ascites is associated with enhanced systemic inflammation and muscle loss; (ii) changes in systemic inflammation are correlated with changes in skeletal muscle parameters (i.e., SMI and SMD); and (iii) the association between malignant ascites and muscle loss may be mediated by systemic inflammation. This study aimed to investigate the association of malignant ascites with the changes in systemic inflammation and skeletal muscle after treatment in patients with advanced‐stage ovarian cancer who received primary debulking surgery (PDS) and adjuvant chemotherapy.
Figure 1.
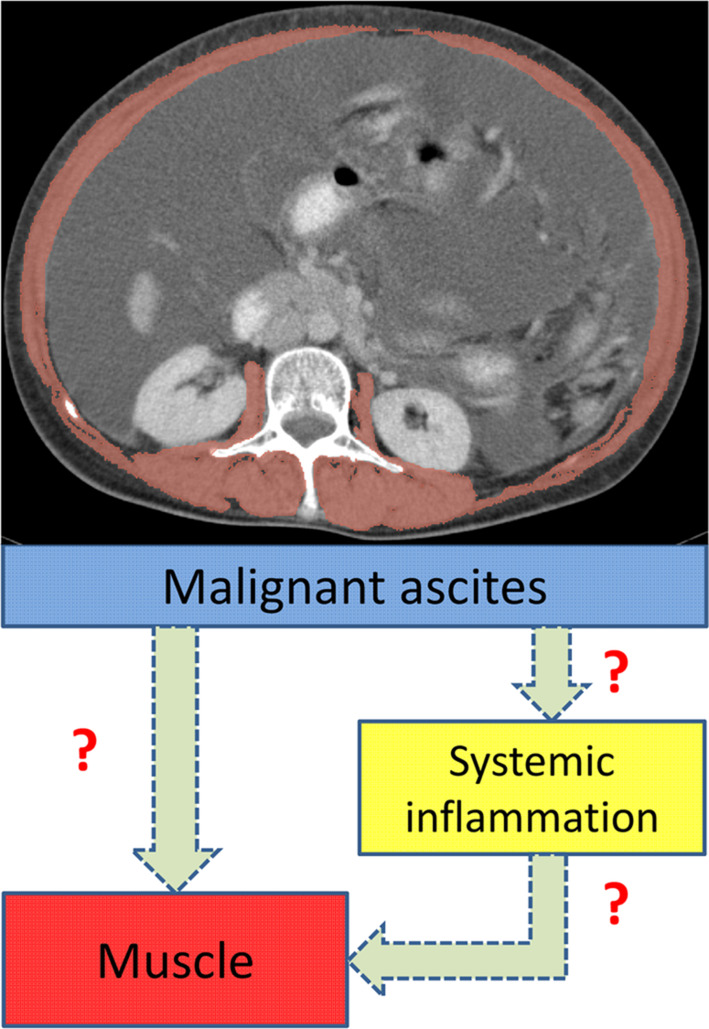
In the hypothetic model, malignant ascites is a key trigger for skeletal muscle loss and enhanced systemic inflammation. The changes in systemic inflammation and skeletal muscle are correlated. The association between malignant ascites and muscle loss may be mediated by systemic inflammation.
Methods
Patients
This study was approved by the Institutional Review Board of MacKay Memorial Hospital and was conducted in accordance with the Strengthening the Reporting of Observational Studies in Epidemiology reporting guidelines. The requirement for informed consent from patients was waived owing to the retrospective and observational nature of the study.
Patients with International Federation of Gynaecology and Obstetrics (FIGO) stage III–IVA ovarian cancer who had received PDS and adjuvant chemotherapy with six cycles of intravenous paclitaxel 175 mg/m2 and carboplatin AUC5 every 3 weeks at our institution between January 2010 and December 2019 were reviewed. The patients were eligible if they had available (i) pre‐treatment CT scans within 2 weeks before PDS, (ii) post‐treatment CT scans within 3 months after adjuvant chemotherapy, (iii) contrast‐enhanced CT scans in the portal‐venous phase, and (iv) blood test data within 1 week before pre‐ and post‐treatment CT scans. Patients in whom the required clinical data could not be obtained from the medical records were excluded. The data were derived from our prospectively maintained institutional gynaecological cancer database.
Malignant ascites was diagnosed by a radiologist specializing in gynaecological oncology, based on the presence of ascites on the pre‐treatment CT scans before PDS. Malignant ascites was removed during PDS. No patients had received neoadjuvant chemotherapy or intraperitoneal chemotherapy in this study. The following data were obtained for analysis: demographic characteristics (age, height, and weight), Eastern Cooperative Oncology Group performance status, disease characteristics (surgery, chemotherapy, FIGO stage, histological type and grade, and results of PDS), and blood test data (albumin, and neutrophil, lymphocyte, and platelet counts).
Skeletal muscle parameters
The CT images were contrast‐enhanced and obtained with the following parameters: slice thickness, 5 mm; 120 kVp; and approximately 290 mA. The median interval between the pre‐ and post‐treatment CT scans was 175 days (range: 143–213 days, interquartile range: 168–186 days). To accurately evaluate the longitudinal changes in skeletal muscle, studies have recommended the consistent use of the portal‐venous phase of CT scans because the use of different phases of contrast enhancement can lead to significant differences in the measurement of skeletal muscle parameters. 18 , 25 , 26 Thus, the portal‐venous phase of the contrast‐enhanced CT scans was retrieved for analysis.
Skeletal muscle parameters were analysed on a cross‐sectional CT image at the L3 level using the 3D Slicer software platform (version 4.11) in a semi‐automatic fashion. One researcher, who was blinded to the patients' information, measured the skeletal muscle parameters. The skeletal muscle area, including the psoas, paraspinal, transversus abdominis, rectus abdominis, and internal and external oblique muscles, was defined using radiation attenuation values of −29 and +150 Hounsfield units. 17 The cross‐sectional areas of the skeletal muscles were measured (cm2) and normalized based on the height of the patients to determine the SMI (cm2/m2). SMD was evaluated as the mean radiation attenuation of the skeletal muscle. The absolute and relative changes in SMI and SMD were calculated for analysis.
The cut‐off values for sarcopenia and myosteatosis were defined at the lowest tertile for pre‐treatment SMI and SMD, respectively. 18 , 27 To evaluate the impact of significant loss of SMI or SMD after treatment, we classified a decrease in SMI or SMD of at least 5% as ‘SMI loss’ or ‘SMD loss’. Meanwhile, a decrease below 5% or increase in SMI or SMD was classified as ‘SMI maintain’ or ‘SMD maintain’ according to the current definition of cachexia and previous studies. 28 , 29 , 30
Systemic inflammatory markers
The measures of systemic inflammation included albumin level, PNI, NLR, and PLR. The median interval between pre‐treatment blood test and CT scan was 1 day (range: 0–6 days, interquartile range: 1–2 days), and the median interval between post‐treatment blood test and CT scan was 2 days (range: 0–6 days, interquartile range: 1–3 days). PNI was calculated as serum albumin (g/L) + 0.005 × lymphocyte count (per mm3). NLR was defined as the absolute neutrophil count divided by the absolute lymphocyte count. PLR was defined as the absolute platelet count divided by the absolute lymphocyte count. The absolute and relative changes in albumin level, PNI, NLR, and PLR were calculated.
Study endpoint
The primary endpoint was the changes in SMI and SMD after PDS and adjuvant chemotherapy. The secondary endpoint included the changes in albumin level, PNI, NLR, and PLR, overall survival (OS), and progression‐free survival (PFS). OS was defined as the time from the date of surgery to the date of any‐cause death or the last follow‐up. PFS was defined as the time from the date of surgery to the date of disease recurrence, progression, death from any cause, or the last follow‐up.
Statistical analysis
Continuous data were expressed as the mean ± standard deviation for normally distributed data or as the median and interquartile range for non‐normally distributed data. Categorical data were expressed as counts and percentages. The normality of data distribution was determined using the Shapiro–Wilk test. Continuous variables were compared using the independent t‐test or Mann–Whitney U test, and categorical variables were compared using the χ 2 test. Paired t‐tests or Wilcoxon signed‐rank tests were used to assess the changes in skeletal muscle parameters and systemic inflammatory markers. Spearman's rank correlation coefficients were used to assess the correlation between skeletal muscle parameters and systemic inflammatory markers.
The linear regression and logistic regression models were used to test associations between SMI and SMD change (continuous or categorical) and other covariates. Cox proportional hazards models were used to estimate hazard ratios (HR) and 95% confidence intervals (CIs). All variables with P < 0.10 in the univariable analysis were included in the multivariable analysis. Multicollinearity was checked using the variance inflation factor at a cut‐off point of 10. Finally, to examine whether the associations between malignant ascites and changes in skeletal muscle parameters were mediated by systemic inflammation, simple mediation models were generated. For these estimations, we used macro‐PROCESS for SPSS version 4.2, selecting Model 4 and 1000 bias‐corrected bootstrap samples. 31 This mediation analysis was aimed to explore the total and direct effects, which indicated the unstandardized regression coefficient and statistical significance between the independent and dependent variables in each model, and indirect effects, which indicated that the changes in SMI or SMD were mediated by the possible mediator variable (i.e., the changes in systemic inflammatory markers). The changes in systemic inflammatory markers with P < 0.05 in the multivariable linear analysis were selected as potential mediators. All statistical analyses were performed using the IBM SPSS software (version 26.0; IBM Corp., Armonk, NY, USA). Statistical significance was set at P < 0.05 (two‐sided).
Results
Patient characteristics
In total, 369 patients were reviewed. The following patients were excluded from the analysis: those with missing follow‐up data (n = 8), missing post‐treatment CT scans (n = 12), CT scans without contrast enhancement (n = 24), and missing laboratory data (n = 18). The final analysis included 307 patients, of which 187 (60.9%) patients had malignant ascites. The patient and disease characteristics are shown in Table 1. The median age was 53 years (range, 23–83 years). Patients with malignant ascites were more likely to have Eastern Cooperative Oncology Group 1, FIGO stage IVA, serous carcinoma, higher histological grade, and residual disease after PDS.
Table 1.
Patient and disease characteristics
| Characteristics | Overall (n = 307) | Malignant ascites (n = 187) | No malignant ascites (n = 120) | P value |
|---|---|---|---|---|
| Age (years), median (range) | 53 (23–83) | 54 (27–81) | 53 (23–83) | 0.25 |
| BMI (kg/m2), mean (SD) | 22.3 ± 3.3 | 22.3 ± 3.3 | 22.3 ± 3.4 | 0.90 |
| ECOG performance status | 0.045 | |||
| 0 | 218 (71.0) | 125 (66.8) | 93 (77.5) | |
| 1 | 89 (29.0) | 62 (33.2) | 27 (22.5) | |
| FIGO stage | 0.001 | |||
| III | 273 (88.9) | 157 (84.0) | 116 (96.7) | |
| IVA | 34 (11.1) | 30 (16.0) | 4 (3.3) | |
| Histology | 0.002 | |||
| Serous carcinoma | 234 (76.2) | 154 (82.4) | 80 (66.7) | |
| Non‐serous carcinoma | 73 (23.8) | 33 (17.6) | 40 (33.3) | |
| Tumour grade | 0.04 | |||
| Grade 1 | 20 (6.5) | 7 (3.7) | 13 (10.8) | |
| Grade 2 | 91 (29.6) | 54 (28.9) | 37 (30.8) | |
| Grade 3 | 196 (63.8) | 126 (67.4) | 70 (58.4) | |
| Results of PDS | <0.001 | |||
| No residual disease | 137 (44.6) | 52 (27.8) | 85 (70.8) | |
| Residual disease ≤1 cm | 126 (41.0) | 96 (51.3) | 30 (25.0) | |
| Residual disease >1 cm | 44 (14.3) | 39 (20.9) | 5 (4.2) |
Data are median (IQR), mean (SD), or number (%).
BMI, body mass index; ECOG, Eastern Cooperative Oncology Group; FIGO, International Federation of Gynaecology and Obstetrics; IQR, interquartile range; SD, standard deviation; PDS, primary debulking surgery.
Changes in muscle and inflammatory markers based on ascites status
Table 2 summarizes the skeletal muscle parameters and systemic inflammatory markers at baseline and the changes after treatment. Sarcopenia and myosteatosis cut‐off values corresponding to the lowest tertile were set at SMI <37.3 cm2/m2 and SMD <37.1 Hounsfield units, respectively. In the overall cohort, patients experienced a decrease of 1.5% in SMI (95% CI: −2.4 to −0.6, P = 0.001) and of 2.6% in SMD (95% CI: −3.2 to −1.9, P < 0.001) after treatment. The albumin level, PNI, NLR, and PLR decreased by 2.4%, 5.2%, 2.5%, and 8.0%, respectively.
Table 2.
Skeletal muscle parameters and systemic inflammatory markers
| Characteristics | Total (n = 307) | Malignant ascites (n = 187) | No malignant ascites (n = 120) | P value |
|---|---|---|---|---|
| SMI (cm2/m2) | ||||
| Pre‐treatment SMI | 41.0 (7.0) | 41.3 (6.5) | 40.6 (7.6) | 0.39 |
| Post‐treatment SMI | 40.2 (6.4) | 39.5 (5.8) | 41.3 (7.1) | 0.03 |
| Absolute SMI change | −0.8 (3.2) | −1.8 (2.8) | 0.7 (3.3) | <0.001 |
| Relative SMI change (%) | −1.5 (7.9) | −3.9 (6.7) | 2.2 (8.2) | <0.001 |
| Pre‐treatment sarcopenia a | 101 (32.9) | 55 (29.4) | 46 (38.3) | 0.11 |
| SMI loss ≥5% | 106 (34.5) | 85 (45.5) | 21 (17.5) | <0.001 |
| SMD (HU) | ||||
| Pre‐treatment SMD | 39.6 (6.9) | 39.1 (6.6) | 40.3 (7.3) | 0.16 |
| Post‐treatment SMD | 38.6 (7.1) | 37.6 (6.7) | 40.1 (7.3) | 0.002 |
| Absolute SMD change | −1.0 (2.1) | −1.5 (2.1) | −0.3 (1.9) | <0.001 |
| Relative SMD change (%) | −2.6 (5.4) | −4.0 (5.5) | −0.4 (4.7) | <0.001 |
| Pre‐treatment myosteatosis a | 101 (32.9) | 64 (34.2) | 37 (30.8) | 0.54 |
| SMD loss ≥5% | 115 (37.5) | 93 (49.7) | 22 (18.3) | <0.001 |
| Albumin (g/L) | ||||
| Pre‐treatment albumin | 39.3 (4.8) | 38.7 (4.6) | 40.2 (4.9) | 0.007 |
| Post‐treatment albumin | 38.3 (5.9) | 36.8 (5.7) | 40.5 (5.5) | <0.001 |
| Absolute albumin change | −1.0 (3.9) | −1.9 (3.9) | 0.3 (3.4) | <0.001 |
| Relative albumin change (%) b | −2.4 (−8.8, 4.8) | −4.4 (−10.5, 2.5) | 2.1 (−4.6, 7.1) | <0.001 |
| PNI | ||||
| Pre‐treatment PNI | 47.3 (6.3) | 46.5 (6.4) | 48.5 (5.9) | 0.005 |
| Post‐treatment PNI | 44.4 (7.1) | 42.2 (6.6) | 47.8 (6.5) | <0.001 |
| Absolute PNI change | −2.9 (5.7) | −4.3 (5.8) | −0.7 (4.8) | <0.001 |
| Relative PNI change (%) b | −5.2 (−13.6, 2.7) | −8.4 (−16.9, −0.5) | −0.1 (−7.7, 5.3) | <0.001 |
| NLR | ||||
| Pre‐treatment NLR | 4.1 (3.0) | 4.3 (3.4) | 3.6 (2.2) | 0.048 |
| Post‐treatment NLR | 4.0 (2.8) | 4.7 (3.1) | 2.8 (1.9) | <0.001 |
| Absolute NLR change | −0.1 (3.8) | 0.4 (4.3) | −0.9 (2.4) | 0.001 |
| Relative NLR change (%) b | −2.5 (−46.7, 59.4) | 20.6 (−36.0, 85.7) | −29.4 (−51.6, 22.7) | <0.001 |
| PLR | ||||
| Pre‐treatment PLR | 260.4 (170.9) | 277.6 (186.8) | 233.5 (139.2) | 0.02 |
| Post‐treatment PLR | 249.6 (168.6) | 286.1 (186.6) | 192.6 (115.1) | <0.001 |
| Absolute PLR change | −10.8 (203.9) | 8.5 (266.3) | −40.9 (159.1) | 0.03 |
| Relative PNI change (%) b | −8.0 (−37.5, 51.1) | 1.7 (−32.9, 74.2) | −19.3 (−44.2, 21.8) | 0.001 |
Data are mean (standard deviation) or number (%).
HU, Hounsfield unit; NLR, neutrophil‐lymphocyte ratio; PLR, platelet‐lymphocyte ratio; PNI, prognostic nutritional index; SMD, skeletal muscle radiodensity; SMI, skeletal muscle index.
The cut‐off values for sarcopenia and myosteatosis are set at SMI < 37.3 cm2/m2 and SMD < 37.1 HU, respectively.
The relative change of albumin, PNI, NLR, and PLR are presented as median (interquartile range).
On comparing patients on the basis of malignant ascites status, the changes in skeletal muscle parameters and systemic inflammatory markers were significantly different between groups (Table 2). At baseline, the SMI and SMD were not significantly different between the groups, but the albumin level and PNI were lower, and the NLR and PLR were higher in patients with malignant ascites. The prevalence of pre‐treatment sarcopenia or myosteatosis was not significantly different between the groups. After treatment, patients with malignant ascites showed a significant decrease in SMI by 3.9% (P < 0.001) and SMD by 4.0% (P < 0.001); however, patients without malignant ascites showed an increase in SMI by 2.2% (P = 0.004) and a non‐significant decrease in SMD by 0.4% (P = 0.35). The prevalence of SMI or SMD loss ≥5% after treatment was significantly higher in patients with malignant ascites (P < 0.001). Patients with malignant ascites showed significant reductions in albumin and PNI by 4.4% (P < 0.001) and 8.4% (P < 0.001), respectively, while patients without malignant ascites maintained albumin levels by 2.1% (P = 0.12) and PNI by −0.1% (P = 0.34). The NLR and PLR significantly increased by 20.6% (P < 0.001) and 1.7% (P = 0.004), respectively, in patients with malignant ascites; however, patients without malignant ascites showed reductions of 29.4% (P = 0.001) and 19.3% (P = 0.02) in NLR and PLR, respectively.
Association between skeletal muscle loss and survival
Among the 307 patients, 158 patients (51.5%) died and 208 (67.8%) patients developed recurrence. The median duration of follow‐up was 5.2 years (range: 1.1–11.3 years) for the 149 alive patients. In the overall cohort, the median OS was 5.6 years (95% CI: 4.4 to 6.8), and the median PFS was 1.8 years (95% CI: 1.5 to 2.1). Patients with malignant ascites had shorter median OS and PFS than patients without malignant ascites (OS: 3.7 years vs. not reached, P < 0.001; PFS: 1.7 years vs. 5.3 years, P < 0.001).
Univariable and multivariable Cox proportional hazards models are presented in Tables 3, S1 and S2. In the univariable analysis, decreased SMI and SMD after treatment were associated with poorer OS and PFS, while pre‐treatment SMI and SMD were not associated with survival outcomes. When analysed as categorical variables, pre‐treatment sarcopenia and myosteatosis were not associated with survival outcomes. Pre‐treatment albumin, PNI, and PLR and changes in albumin, PNI, NLR, and PLR were also associated with OS and PFS.
Table 3.
Association of SMI and SMD with survival outcomes
| Overall survival | Progression‐free survival | |||||||
|---|---|---|---|---|---|---|---|---|
| Univariable | Multivariable a | Univariable | Multivariable b | |||||
| HR (95% CI) | P value | HR (95% CI) | P value | HR (95% CI) | P value | HR (95% CI) | P value | |
| Model 1 c | ||||||||
| Pre‐treatment SMI | 1.00 (0.98 to 1.03) | 0.78 | 1.01 (0.99 to 1.03) | 0.48 | ||||
| SMI change (per 1% decrease) | 1.06 (1.04 to 1.08) | <0.001 | 1.01 (0.97 to 1.04) | 0.50 | 1.06 (1.04 to 1.08) | <0.001 | 1.01 (0.99 to 1.03) | 0.46 |
| Pre‐treatment SMD | 0.99 (0.97 to 1.01) | 0.39 | 0.99 (0.97 to 1.01) | 0.24 | ||||
| SMD change (per 1% decrease) | 1.09 (1.06 to 1.12) | <0.001 | 1.08 (1.03 to 1.13) | 0.001 | 1.08 (1.05 to 1.10) | <0.001 | 1.05 (1.01 to 1.08) | 0.02 |
| Model 2 c | ||||||||
| Pre‐treatment sarcopenia d | 1.04 (0.75 to 1.46) | 0.81 | 0.96 (0.71 to 1.28) | 0.76 | ||||
| SMI loss ≥5% | 2.33 (1.70 to 3.19) | <0.001 | 1.09 (0.71 to 1.67) | 0.70 | 2.26 (1.72 to 2.98) | <0.001 | 1.17 (0.82 to 1.67) | 0.38 |
| Pre‐treatment myosteatosis d | 1.17 (0.84 to 1.62) | 0.36 | 1.11 (0.83 to 1.48) | 0.49 | ||||
| SMD loss ≥5% | 3.30 (2.40 to 4.54) | <0.001 | 2.95 (1.90 to 4.58) | <0.001 | 2.50 (1.90 to 3.29) | <0.001 | 1.98 (1.38 to 2.85) | <0.001 |
CI, confidence interval; HR, hazard ratio; SMD, skeletal muscle radiodensity; SMI, skeletal muscle index.
Multivariable analysis is adjusted for ECOG, stage, grade, residual disease, malignant ascites, and pre‐treatment and changes in albumin, prognostic nutritional index, neutrophil‐lymphocyte ratio, and platelet‐lymphocyte ratio.
Multivariable analysis is adjusted for stage, histology, grade, residual disease, malignant ascites, and pre‐treatment and changes in albumin, prognostic nutritional index, neutrophil‐lymphocyte ratio, and platelet‐lymphocyte ratio.
In model 1 and model 2, SMI and SMD are analysed as continuous and categorical variables, respectively.
The cut‐off values for sarcopenia and myosteatosis are set at SMI < 37.3 cm2/m2 and SMD < 37.1 HU, respectively.
In the multivariable analysis, decreased SMD after treatment was independently associated with poorer OS (HR: 1.08 per 1% decrease; P = 0.001) and PFS (HR: 1.05 per 1% decrease; P = 0.02). SMD loss ≥5% was also independently associated with poorer OS and PFS. SMI changes were not independently associated with survival outcomes. Malignant ascites was independently associated with a poorer PFS. Pre‐treatment albumin and PNI were independently associated with poorer OS (albumin: HR: 0.85, 95% CI: 0.79 to 0.93, P < 0.001; PNI: HR: 1.12, 95% CI: 1.03 to 1.21, P = 0.005); however, the changes in systemic inflammatory markers were not independently associated with survival outcomes (Tables S1 and S2).
Correlation of ascites and systemic inflammation with skeletal muscle
Next, we analysed the correlation between changes in systemic inflammatory markers and skeletal muscle parameters. Figure 2 shows the correlation between changes in the albumin level and PNI with skeletal muscle parameters. Changes in the albumin level and PNI were moderately correlated with changes in SMI and SMD in the whole cohort and in groups based on malignant ascites status. As shown in Figure 2, patients with malignant ascites tended to have decreased albumin levels and PNI, accompanied by decreased SMI and SMD, and vice versa. The changes in NLR and PLR were also moderately correlated with the changes in SMI and SMD in the whole cohort and in groups based on malignant ascites status (Figure 3). Patients with malignant ascites tended to have increased NLR and PLR and decreased skeletal muscle parameters, whereas patients without malignant ascites tended to have decreased NLR and PLR and increased skeletal muscle parameters.
Figure 2.
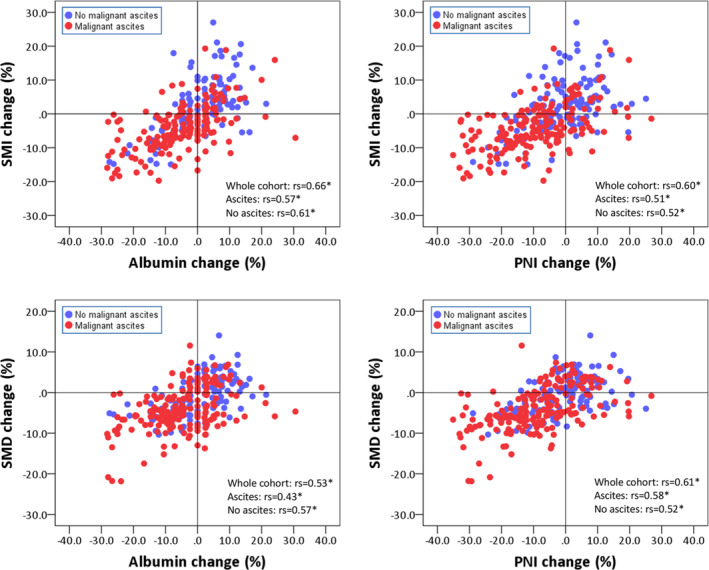
Scatter plot depicting the relationship between changes in albumin and PNI and changes in SMI and SMD. The red and blue dots represent patients with and without malignant ascites, respectively. rs, Spearman's rank correlation coefficient; PNI, prognostic nutritional index; SMD, skeletal muscle radiodensity; SMI, skeletal muscle index. *P < 0.001.
Figure 3.
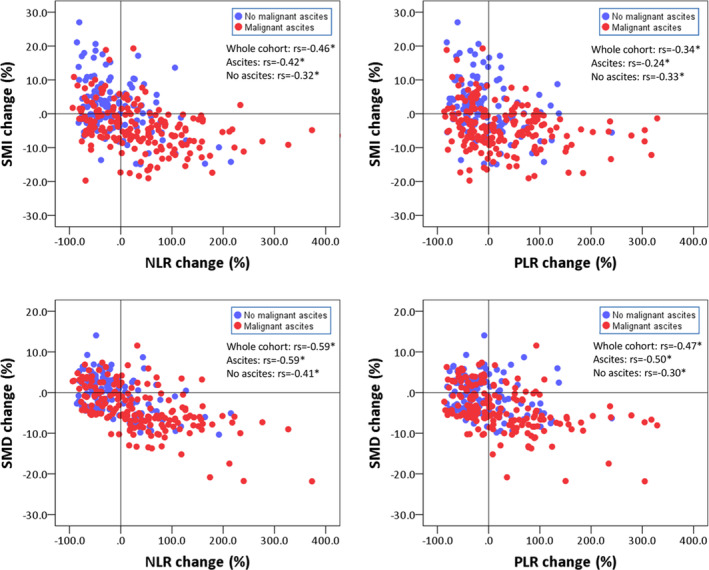
Scatter plot depicting the relationship between changes in NLR and PLR and changes in SMI and SMD. The red and blue dots represent patients with and without malignant ascites, respectively. rs, Spearman's rank correlation coefficient; NLR, neutrophil‐lymphocyte ratio; PLR, platelet‐lymphocyte ratio; SMD, skeletal muscle radiodensity; SMI, skeletal muscle index. *P < 0.001.
In the multiple linear regression analysis (Table 4), malignant ascites and NLR change were negatively correlated with SMI change, whereas albumin change was positively correlated with SMI change. Malignant ascites and NLR change were negatively correlated with SMD change, whereas PNI change was positively correlated with SMD change. When analysed as categorical variables (Table S3), multiple logistic regression analysis showed that malignant ascites and changes in albumin and NLR were independently correlated with SMI loss ≥5% (ascites: odds ratio: 2.45, 95% CI: 1.16 to 5.20, P = 0.02; albumin change: odds ratio: 0.90, 95% CI: 0.85 to 0.96, P = 0.001; NLR change: odds ratio: 1.008, 95% CI: 1.002 to 1.014, P = 0.008). Meanwhile, malignant ascites and changes in PNI and NLR were independently correlated with SMD loss ≥5% (ascites: odds ratio: 2.65, 95% CI: 1.21 to 5.81, P = 0.02; PNI change: odds ratio: 0.93, 95% CI: 0.87 to 0.99, P = 0.04; NLR change: odds ratio: 1.016, 95% CI: 1.009 to 1.024, P < 0.001).
Table 4.
Linear regression analysis of factors associated with change in SMI and SMD (%) after treatment
| SMI change, continuous | SMD change, continuous | |||||||
|---|---|---|---|---|---|---|---|---|
| Univariable | Multivariable | Univariable | Multivariable | |||||
| β (95% CI) | P value | β (95% CI) | P value | β (95% CI) | P value | β (95% CI) | P value | |
| Age, continuous | −0.02 (−0.10 to 0.07) | 0.70 | −0.01 (−0.07 to 0.04) | 0.62 | ||||
| ECOG, 1 vs. 0 | −3.82 (−5.73 to −1.90) | <0.001 | −1.67 (−3.11 to −0.22) | 0.02 | −1.27 (−2.61 to 0.08) | 0.07 | 0.24 (−0.79 to −1.46) | 0.65 |
| FIGO stage IVA vs. III | −4.81 (−7.60 to −2.03) | 0.001 | −2.12 (−4.24 to 0.01) | 0.051 | −0.49 (−2.44 to 1.46) | 0.62 | ||
| Histology, non‐serous vs. serous | 0.01 (−2.08 to 2.10) | 0.993 | 0.30 (−1.14 to 1.74) | 0.68 | ||||
| Histological grade (reference: Grade 1) | ||||||||
| Grade 2 | −3.85 (−7.68 to −0.01) | 0.049 | −0.89 (−3.66 to 1.88) | 0.53 | −2.89 (−5.52 to −0.25) | 0.03 | −1.29 (−3.27 to 0.70) | 0.20 |
| Grade 3 | −3.36 (−7.01 to 0.28) | 0.07 | 0.04 (−2.65 to 2.72) | 0.98 | −2.88 (−5.38 to −0.38) | 0.02 | −1.02 (−2.94 to 0.90) | 0.30 |
| Residual disease (reference: None) | ||||||||
| Residual disease ≤1 cm | −2.71 (−4.60 to −0.82) | 0.005 | −0.69 (−2.19 to 0.80) | 0.36 | −1.73 (−3.02 to −0.43) | 0.009 | −0.37 (−1.43 to 0.70) | 0.50 |
| Residual disease >1 cm | −4.17 (−6.82 to −1.51) | 0.002 | −0.28 (−2.41 to 1.84) | 0.79 | −2.98 (−4.80 to −1.15) | 0.001 | −0.21 (−1.72 to 1.29) | 0.78 |
| Malignant ascites, yes vs. no | −7.44 (−9.07 to −5.82) | <0.001 | −3.19 (−4.71 to −1.68) | <0.001 | −4.62 (−5.76 to −3.48) | <0.001 | −1.28 (−2.37 to −0.19) | 0.02 |
| Pre‐treatment SMI | −0.39 (−0.51 to −0.27) | <0.001 | −0.22 (−0.31 to −0.12) | <0.001 | −0.09 (−0.18 to −0.01) | 0.049 | 0.03 (−0.04 to 0.10) | 0.45 |
| Pre‐treatment SMD | 0.04 (−0.09 to 0.17) | 0.59 | 0.01 (−0.08 to 0.10) | 0.87 | ||||
| Pre‐treatment albumin | 0.11 (−0.08 to 0.29) | 0.26 | 0.12 (−0.01 to 0.25) | 0.06 | −0.20 (−0.41 to 0.01) | 0.06 | ||
| Albumin change | 0.48 (0.41 to 0.55) | <0.001 | 0.37 (0.25 to 0.49) | <0.001 | 0.28 (0.23 to 0.33) | <0.001 | 0.09 (−0.01 to 0.18) | 0.08 |
| Pre‐treatment PNI | 0.05 (−0.10 to 0.19) | 0.54 | 0.09 (−0.01 to 0.19) | 0.07 | 0.29 (0.11 to 0.46) | 0.001 | ||
| PNI change | 0.37 (0.31 to 0.44) | <0.001 | −0.06 (−0.19 to 0.07) | 0.34 | 0.26 (0.22 to 0.30) | <0.001 | 0.11 (0.01 to 0.21) | 0.04 |
| Pre‐treatment NLR | 0.12 (−0.18 to 0.42) | 0.44 | −0.02 (−0.23 to 0.19) | 0.84 | ||||
| NLR change | −0.04 (−0.05 to −0.03) | <0.001 | −0.02 (−0.03 to −0.01) | 0.003 | −0.036 (−0.042 to −0.030) | <0.001 | −0.02 (−0.032 to −0.015) | <0.001 |
| Pre‐treatment PLR | 0.002 (−0.003 to 0.007) | 0.40 | −0.002 (−0.006 to 0.002) | 0.26 | ||||
| PLR change | −0.03 (−0.04 to −0.02) | <0.001 | −0.001 (−0.014 to 0.012) | 0.87 | −0.03 (−0.04 to −0.02) | <0.001 | 0.001 (−0.01 to 0.01) | 0.90 |
β indicates linear regression coefficient.
CI, confidence interval; ECOG, Eastern Cooperative Oncology Group; FIGO, International Federation of Gynaecology and Obstetrics; NLR, neutrophil‐lymphocyte ratio; PLR, platelet‐lymphocyte ratio; PNI, prognostic nutritional index; SMD, skeletal muscle radiodensity; SMI, skeletal muscle index.
Mediation analysis
The simple mediation analysis models are shown in Figure 4. There was a direct effect of malignant ascites on SMI change and SMD change (all P < 0.001). Moreover, malignant ascites had a significant indirect effect on SMI change through NLR change (indirect effect: −1.61, 95% CI: −2.22 to −1.08) and albumin change (indirect effect: −2.92, 95% CI: −4.01 to −1.94). Malignant ascites also had a significant indirect effect on SMD change through NLR change (indirect effect: −1.76, 95% CI: −2.34 to −1.22) and PNI change (indirect effect: −2.00, 95% CI: −2.79 to −1.36).
Figure 4.
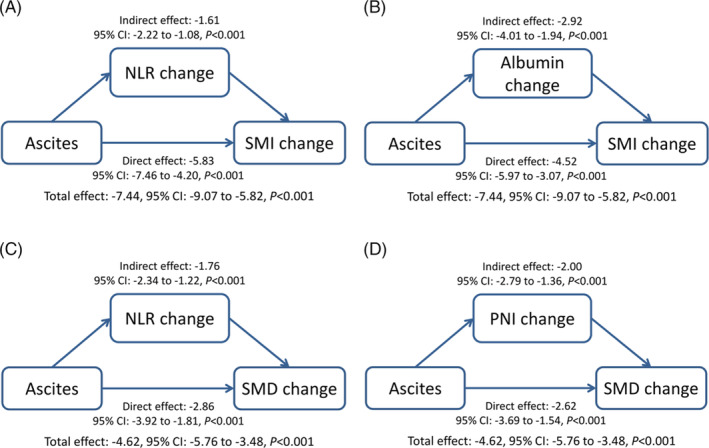
Mediation analysis. (A, B) Effect of ascites on changes in NLR, albumin level, and SMI. (C, D) Effect of ascites on changes in NLR, PNI, and SMD. The changes in SMI or SMD are used as outcome variable, while the changes in NLR, albumin, or PNI are used as their mediator. NLR, neutrophil‐lymphocyte ratio; PNI, prognostic nutritional index; SMD, skeletal muscle radiodensity; SMI, skeletal muscle index.
Discussion
To our knowledge, this is the first study to investigate the association of malignant ascites with systemic inflammation and skeletal muscle in advanced‐stage ovarian cancer. This study found that malignant ascites was associated with the changes in systemic inflammation and skeletal muscle after PDS and adjuvant chemotherapy. Patients with malignant ascites tended to have enhanced systemic inflammation accompanied by significantly decreased SMI and SMD, whereas patients without malignant ascites showed decreased systemic inflammation and maintained muscle. Malignant ascites and the changes in systemic inflammatory markers were independently associated with the changes in SMI and SMD. Moreover, the association between malignant ascites and skeletal muscle loss may be mediated by the changes of systemic inflammation.
Assessments of malignant ascites may help identify the drivers of muscle loss in ovarian cancer. Malignant ascites includes various cellular and acellular factors that increase pro‐inflammatory cytokine levels, enhance systemic inflammation, and induce pronounced changes in skeletal muscle protein metabolism. Our findings support the findings of previous in vivo and in vitro studies in this regard. 14 , 15 , 16 However, although the malignant ascites of most patients was removed during PDS, these patients still showed progressively decreased muscle mass, albumin level, and PNI and increased NLR and PLR after treatment. One possible explanation is that the potential effects of ascites on systemic inflammation and muscle might have persisted. Pro‐inflammatory cytokines and mediators of systemic inflammation have profound catabolic effects on host metabolism, and these effects can trigger muscle breakdown and fatty infiltration in the muscle. Muscle depletion can contribute to local inflammation in the muscle, leading to further breakdown and systemic inflammation. 32 Systemic inflammation and muscle loss therefore constitute a vicious cycle that potentiates tumour progression and reduces treatment response, resulting in poorer survival. 33 , 34 , 35
Muscle quality may be more important than quantity in ovarian cancer. 11 This study showed that decreased SMD (i.e., increased fat infiltration of the muscle) during treatment was independently associated with poorer survival outcomes. However, the SMI decrease was not independently associated with survival outcomes in this analysis, which is not consistent with previous studies. 7 , 8 A possible explanation is that this study analysed a larger group of patients with ovarian cancer treated in recent years. The recent improvements in treatments and quality of care may have influenced the prognostic effects of muscle. 36 Pre‐treatment SMI and SMD were not associated with survival outcomes. Changes in muscle are dynamic, and a longitudinal analysis can provide more information than an analysis at a single time point. 37 Moreover, we mainly analysed skeletal muscle parameters as continuous variables because a universally valid cut‐off has not been established to date. Analysis of muscle parameters as continuous variables can also prevent methodological artefacts and provide more robust statistical analyses. 35
To improve muscle quality, multimodal interventions including nutrition, exercise, and anti‐inflammatory interventions may be safe and effective in maintaining or improving muscle. 38 Randomized controlled trials are undergoing to evaluate the effectiveness of a tailored exercise and dietary intervention on body composition, physical function, and fatigue in women with ovarian cancer. 39 , 40 In addition, enhanced systemic inflammation can impair the effectiveness of nutrition and exercise, suggesting the potential role of anti‐inflammation in multimodal interventions. 41 In a randomized phase III trial of treatment for cachexia in patients with advanced‐stage gynaecological cancer, patients treated with a combination of megestrol acetate plus l‐carnitine, antioxidants, and celecoxib had significantly better lean body mass and lower systemic inflammatory parameters than patients treated with megestrol acetate alone. 42 Although anti‐inflammatory interventions with nutrition and exercise may be suggested, further studies are still needed to provide better evidence to reveal the effects of multimodal interventions on improving muscle in women with ovarian cancer.
This study had some limitations. First, we may not have addressed unknown confounders due to the retrospective nature of the study. Second, information regarding diet, exercise, muscle strength, volume of ascites, and metabolic characteristics was available for only a few patients and was therefore not analysed. Third, neoadjuvant chemotherapy followed by interval debulking surgery is another treatment option for advanced‐stage ovarian cancer, with similar outcomes. 5 Intraperitoneal chemotherapy following optimal debulking surgery may also benefit patients with advanced‐stage ovarian cancer. 43 However, only a few patients received these treatments in our institution, but these patients were not included in this study. The association of ascites with systemic inflammation and muscle in patients treated with these treatments needs to be evaluated in future studies. Despite these limitations, the strength of this study is that our patients received highly similar treatments, and the treatment outcomes were comparable with those of previous studies. 5 , 6 , 7 , 8 , 9 , 10 , 11 In addition, the muscle measurements were obtained using a consistent protocol and the portal‐venous phase of contrast‐enhanced CT scans, providing accurate measurements of muscle changes during treatment.
Conclusions
Malignant ascites was associated with enhanced systemic inflammation and impaired muscle quality and quantity after PDS and adjuvant chemotherapy. The association between malignant ascites and muscle loss may be mediated by systemic inflammation. The evaluation of malignant ascites may help further investigate the underlying mechanisms of muscle loss in patients with ovarian cancer.
Funding
This work was supported by the Ministry of Science and Technology Taiwan (grant number: MOST 110‐2314‐B‐195‐033).
Conflict of interest
The authors declare no conflicts of interest.
Supporting information
Table S1 Cox proportional hazards model for overall survival.
Table S2 Cox proportional hazards model for progression‐free survival.
Table S3 Logistic regression analysis of factors associated with SMI or SMD loss ≥5%.
Acknowledgements
The authors certify that they comply with the ethical guidelines for authorship and publishing of the Journal of Cachexia, Sarcopenia and Muscle. 44
Weng C‐S, Huang W‐C, Chang C‐L, Jan Y‐T, Chen T‐C, Lee J (2023) Association of malignant ascites with systemic inflammation and muscle loss after treatment in advanced‐stage ovarian cancer, Journal of Cachexia, Sarcopenia and Muscle, 14, 2114–2125, 10.1002/jcsm.13289
References
- 1. Siegel RL, Miller KD, Fuchs HE, Jemal A. Cancer statistics, 2022. CA Cancer J Clin 2022;72:7–33. [DOI] [PubMed] [Google Scholar]
- 2. Torre LA, Trabert B, DeSantis CE, Miller KD, Samimi G, Runowicz CD, et al. Ovarian cancer statistics, 2018. CA Cancer J Clin 2018;68:284–296. [DOI] [PMC free article] [PubMed] [Google Scholar]
- 3. Berek JS, Kehoe ST, Kumar L, Friedlander M. Cancer of the ovary, fallopian tube, and peritoneum. Int J Gynaecol Obstet 2018;143:59–78. [DOI] [PubMed] [Google Scholar]
- 4. Aust S, Knogler T, Pils D, Obermayr E, Reinthaller A, Zahn L, et al. Skeletal muscle depletion and markers for cancer cachexia are strong prognostic factors in epithelial ovarian cancer. PLoS ONE 2015;10:e0140403. [DOI] [PMC free article] [PubMed] [Google Scholar]
- 5. Fagotti A, Ferrandina MG, Vizzielli G, Pasciuto T, Fanfani F, Gallotta V, et al. Randomized trial of primary debulking surgery versus neoadjuvant chemotherapy for advanced epithelial ovarian cancer (SCORPION‐NCT01461850). Int J Gynecol Cancer 2020;30:1657–1664. [DOI] [PubMed] [Google Scholar]
- 6. Ubachs J, Ziemons J, Minis‐Rutten IJG, Kruitwagen R, Kleijnen J, Lambrechts S, et al. Sarcopenia and ovarian cancer survival: a systematic review and meta‐analysis. J Cachexia Sarcopenia Muscle 2019;10:1165–1174. [DOI] [PMC free article] [PubMed] [Google Scholar]
- 7. McSharry V, Glennon K, Mullee A, Brennan D. The impact of body composition on treatment in ovarian cancer: a current insight. Expert Rev Clin Pharmacol 2021;14:1–10. [DOI] [PubMed] [Google Scholar]
- 8. Huang CY, Yang YC, Chen TC, Chen JR, Chen YJ, Wu MH, et al. Muscle loss during primary debulking surgery and chemotherapy predicts poor survival in advanced‐stage ovarian cancer. J Cachexia Sarcopenia Muscle 2020;11:534–546. [DOI] [PMC free article] [PubMed] [Google Scholar]
- 9. Pergialiotis V, Sotiropoulou IM, Liatsou E, Liontos M, Frountzas M, Thomakos N, et al. Quality of life of ovarian cancer patients treated with combined platinum taxane chemotherapy: a systematic review of the literature. Support Care Cancer 2022;30:7147–7157. [DOI] [PubMed] [Google Scholar]
- 10. Sarkar S, Sahoo PK, Pal R, Mistry T, Mahata S, Chatterjee P, et al. Assessment of quality of life among advanced ovarian cancer patients in a tertiary care hospital in India. Support Care Cancer 2022;30:3371–3378. [DOI] [PubMed] [Google Scholar]
- 11. Polen‐De C, Fadadu P, Weaver AL, Moynagh M, Takahashi N, Jatoi A, et al. Quality is more important than quantity: pre‐operative sarcopenia is associated with poor survival in advanced ovarian cancer. Int J Gynecol Cancer 2022;32:1289–1296. [DOI] [PubMed] [Google Scholar]
- 12. Rickard BP, Conrad C, Sorrin AJ, Ruhi MK, Reader JC, Huang SA, et al. Malignant ascites in ovarian cancer: cellular, acellular, and biophysical determinants of molecular characteristics and therapy response. Cancers (Basel) 2021;13:4318. [DOI] [PMC free article] [PubMed] [Google Scholar]
- 13. Rutten IJ, Ubachs J, Kruitwagen RF, van Dijk DP, Beets‐Tan RG, Massuger LF, et al. The influence of sarcopenia on survival and surgical complications in ovarian cancer patients undergoing primary debulking surgery. Eur J Surg Oncol 2017;43:717–724. [DOI] [PubMed] [Google Scholar]
- 14. Ubachs J, van de Worp W, Vaes RDW, Pasmans K, Langen RC, Meex RCR, et al. Ovarian cancer ascites induces skeletal muscle wasting in vitro and reflects sarcopenia in patients. J Cachexia Sarcopenia Muscle 2022;13:311–324. [DOI] [PMC free article] [PubMed] [Google Scholar]
- 15. Pin F, Barreto R, Kitase Y, Mitra S, Erne CE, Novinger LJ, et al. Growth of ovarian cancer xenografts causes loss of muscle and bone mass: a new model for the study of cancer cachexia. J Cachexia Sarcopenia Muscle 2018;9:685–700. [DOI] [PMC free article] [PubMed] [Google Scholar]
- 16. Pin F, Jones AJ, Huot JR, Narasimhan A, Zimmers TA, Bonewald LF, et al. RANKL blockade reduces cachexia and bone loss induced by non‐metastatic ovarian cancer in mice. J Bone Miner Res 2022;37:381–396. [DOI] [PMC free article] [PubMed] [Google Scholar]
- 17. Mourtzakis M, Prado CM, Lieffers JR, Reiman T, McCargar LJ, Baracos VE. A practical and precise approach to quantification of body composition in cancer patients using computed tomography images acquired during routine care. Appl Physiol Nutr Metab 2008;33:997–1006. [DOI] [PubMed] [Google Scholar]
- 18. Huang CY, Sun FJ, Lee J. Prognostic value of muscle measurement using the standardized phase of computed tomography in patients with advanced ovarian cancer. Nutrition 2020;72:110642. [DOI] [PubMed] [Google Scholar]
- 19. Aubrey J, Esfandiari N, Baracos VE, Buteau FA, Frenette J, Putman CT, et al. Measurement of skeletal muscle radiation attenuation and basis of its biological variation. Acta Physiol (Oxf) 2014;210:489–497. [DOI] [PMC free article] [PubMed] [Google Scholar]
- 20. Zhang W, Ye B, Liang W, Ren Y. Preoperative prognostic nutritional index is a powerful predictor of prognosis in patients with stage III ovarian cancer. Sci Rep 2017;7:9548. [DOI] [PMC free article] [PubMed] [Google Scholar]
- 21. Savant SS, Sriramkumar S, O'Hagan HM. The role of inflammation and inflammatory mediators in the development, progression, metastasis, and chemoresistance of epithelial ovarian cancer. Cancers (Basel) 2018;10:251. [DOI] [PMC free article] [PubMed] [Google Scholar]
- 22. Ceran MU, Tasdemir U, Colak E, Gungor T. Can complete blood count inflammatory parameters in epithelial ovarian cancer contribute to prognosis? ‐ a survival analysis. J Ovarian Res 2019;12:16. [DOI] [PMC free article] [PubMed] [Google Scholar]
- 23. Cole CL, Kleckner IR, Jatoi A, Schwarz EM, Dunne RF. The role of systemic inflammation in cancer‐associated muscle wasting and rationale for exercise as a therapeutic intervention. JCSM Clin Rep 2018;3:1–19. [PMC free article] [PubMed] [Google Scholar]
- 24. Evans DC, Corkins MR, Malone A, Miller S, Mogensen KM, Guenter P, et al. The use of visceral proteins as nutrition markers: an ASPEN position paper. Nutr Clin Pract 2021;36:22–28. [DOI] [PubMed] [Google Scholar]
- 25. van Vugt JLA, Coebergh van den Braak RRJ, Schippers HJW, Veen KM, Levolger S, de Bruin RWF, et al. Contrast‐enhancement influences skeletal muscle density, but not skeletal muscle mass, measurements on computed tomography. Clin Nutr 2018;37:1707–1714. [DOI] [PubMed] [Google Scholar]
- 26. Lortie J, Gage G, Rush B, Heymsfield SB, Szczykutowicz TP, Kuchnia AJ. The effect of computed tomography parameters on sarcopenia and myosteatosis assessment: a scoping review. J Cachexia Sarcopenia Muscle 2022;13:2807–2819. [DOI] [PMC free article] [PubMed] [Google Scholar]
- 27. van Dijk DP, Bakens MJ, Coolsen MM, Rensen SS, van Dam RM, Bours MJ, et al. Low skeletal muscle radiation attenuation and visceral adiposity are associated with overall survival and surgical site infections in patients with pancreatic cancer. J Cachexia Sarcopenia Muscle 2017;8:317–326. [DOI] [PMC free article] [PubMed] [Google Scholar]
- 28. Fearon K, Strasser F, Anker SD, Bosaeus I, Bruera E, Fainsinger RL, et al. Definition and classification of cancer cachexia: an international consensus. Lancet Oncol 2011;12:489–495. [DOI] [PubMed] [Google Scholar]
- 29. Lee J, Lin JB, Wu MH, Jan YT, Chang CL, Huang CY, et al. Muscle radiodensity loss during cancer therapy is predictive for poor survival in advanced endometrial cancer. J Cachexia Sarcopenia Muscle 2019;10:814–826. [DOI] [PMC free article] [PubMed] [Google Scholar]
- 30. Lee J, Chen TC, Jan YT, Li CJ, Chen YJ, Wu MH. Association of patient‐reported outcomes and nutrition with body composition in women with gynecologic cancer undergoing post‐operative pelvic radiotherapy: an observational study. Nutrients 2021;13:2629. [DOI] [PMC free article] [PubMed] [Google Scholar]
- 31. Preacher KJ, Hayes AF. SPSS and SAS procedures for estimating indirect effects in simple mediation models. Behav Res Methods Instrum Comput 2004;36:717–731. [DOI] [PubMed] [Google Scholar]
- 32. Kalinkovich A, Livshits G. Sarcopenic obesity or obese sarcopenia: a cross talk between age‐associated adipose tissue and skeletal muscle inflammation as a main mechanism of the pathogenesis. Ageing Res Rev 2017;35:200–221. [DOI] [PubMed] [Google Scholar]
- 33. Feliciano EMC, Kroenke CH, Meyerhardt JA, Prado CM, Bradshaw PT, Kwan ML, et al. Association of systemic inflammation and sarcopenia with survival in nonmetastatic colorectal cancer: results from the C SCANS study. JAMA Oncol 2017;3:e172319. [DOI] [PMC free article] [PubMed] [Google Scholar]
- 34. Lee J, Liu SH, Dai KY, Huang YM, Li CJ, Chen JC, et al. Sarcopenia and systemic inflammation synergistically impact survival in oral cavity cancer. Laryngoscope 2021;131:E1530–E1538. [DOI] [PubMed] [Google Scholar]
- 35. Hacker UT, Hasenclever D, Baber R, Linder N, Busse H, Obermannova R, et al. Modified Glasgow prognostic score (mGPS) is correlated with sarcopenia and dominates the prognostic role of baseline body composition parameters in advanced gastric and esophagogastric junction cancer patients undergoing first‐line treatment from the phase III EXPAND trial. Ann Oncol 2022;33:685–692. [DOI] [PubMed] [Google Scholar]
- 36. Prado CM, Purcell SA, Laviano A. Nutrition interventions to treat low muscle mass in cancer. J Cachexia Sarcopenia Muscle 2020;11:366–380. [DOI] [PMC free article] [PubMed] [Google Scholar]
- 37. Rutten IJ, van Dijk DP, Kruitwagen RF, Beets‐Tan RG, Olde Damink SW, van Gorp T. Loss of skeletal muscle during neoadjuvant chemotherapy is related to decreased survival in ovarian cancer patients. J Cachexia Sarcopenia Muscle 2016;7:458–466. [DOI] [PMC free article] [PubMed] [Google Scholar]
- 38. Muscaritoli M, Arends J, Bachmann P, Baracos V, Barthelemy N, Bertz H, et al. ESPEN practical guideline: clinical nutrition in cancer. Clin Nutr 2021;40:2898–2913. [DOI] [PubMed] [Google Scholar]
- 39. Stelten S, Hoedjes M, Kenter GG, Kampman E, Huijsmans RJ, van Lonkhuijzen LR, et al. Rationale and study protocol of the Physical Activity and Dietary intervention in women with OVArian cancer (PADOVA) study: a randomised controlled trial to evaluate effectiveness of a tailored exercise and dietary intervention on body composition, physical function and fatigue in women with ovarian cancer undergoing chemotherapy. BMJ Open 2020;10:e036854. [DOI] [PMC free article] [PubMed] [Google Scholar]
- 40. Maurer T, von Grundherr J, Patra S, Jaeger A, Becher H, Schmalfeldt B, et al. An exercise and nutrition intervention for ovarian cancer patients during and after first‐line chemotherapy (BENITA study): a randomized controlled pilot trial. Int J Gynecol Cancer 2020;30:541–545. [DOI] [PubMed] [Google Scholar]
- 41. Merker M, Felder M, Gueissaz L, Bolliger R, Tribolet P, Kägi‐Braun N, et al. Association of baseline inflammation with effectiveness of nutritional support among patients with disease‐related malnutrition: a secondary analysis of a randomized clinical trial. JAMA Netw Open 2020;3:e200663. [DOI] [PMC free article] [PubMed] [Google Scholar]
- 42. Macciò A, Madeddu C, Gramignano G, Mulas C, Floris C, Sanna E, et al. A randomized phase III clinical trial of a combined treatment for cachexia in patients with gynecological cancers: evaluating the impact on metabolic and inflammatory profiles and quality of life. Gynecol Oncol 2012;124:417–425. [DOI] [PubMed] [Google Scholar]
- 43. Gourley C, Walker JL, Mackay HJ. Update on intraperitoneal chemotherapy for the treatment of epithelial ovarian cancer. Am Soc Clin Oncol Educ Book 2016;35:143–151. [DOI] [PubMed] [Google Scholar]
- 44. von Haehling S, Morley JE, Coats AJS, Anker SD. Ethical guidelines for publishing in the Journal of Cachexia, Sarcopenia and Muscle: update 2021. J Cachexia Sarcopenia Muscle 2021;12:2259–2261. [DOI] [PMC free article] [PubMed] [Google Scholar]
Associated Data
This section collects any data citations, data availability statements, or supplementary materials included in this article.
Supplementary Materials
Table S1 Cox proportional hazards model for overall survival.
Table S2 Cox proportional hazards model for progression‐free survival.
Table S3 Logistic regression analysis of factors associated with SMI or SMD loss ≥5%.