

Abstract
Background
Radiation‐induced muscle pathology, characterized by muscle atrophy and fibrotic tissue accumulation, is the most common debilitating late effect of therapeutic radiation exposure particularly in juvenile cancer survivors. In healthy muscle, fibro/adipogenic progenitors (FAPs) are required for muscle maintenance and regeneration, while in muscle pathology FAPs are precursors for exacerbated extracellular matrix deposition. However, the role of FAPs in radiation‐induced muscle pathology has not previously been explored.
Methods
Four‐week‐old Male CBA or C57Bl/6J mice received a single dose (16 Gy) of irradiation (IR) to a single hindlimb with the shielded contralateral limb (CLTR) serving as a non‐IR control. Mice were sacrificed 3, 7, 14 (acute IR response), and 56 days post‐IR (long‐term IR response). Changes in skeletal muscle morphology, myofibre composition, muscle niche cellular dynamics, DNA damage, proliferation, mitochondrial respiration, and metabolism and changes in progenitor cell fate where assessed.
Results
Juvenile radiation exposure resulted in smaller myofibre cross‐sectional area, particularly in type I and IIA myofibres (P < 0.05) and reduced the proportion of type I myofibres (P < 0.05). Skeletal muscle fibrosis (P < 0.05) was evident at 56 days post‐IR. The IR‐limb had fewer endothelial cells (P < 0.05) and fibro‐adipogenic progenitors (FAPs) (P < 0.05) at 56 days post‐IR. Fewer muscle satellite (stem) cells were detected at 3 and 56 days in the IR‐limb (P < 0.05). IR induced FAP senescence (P < 0.05), increased their fibrogenic differentiation (P < 0.01), and promoted their glycolytic metabolism. Further, IR altered the FAP secretome in a manner that impaired muscle satellite (stem) cell differentiation (P < 0.05) and fusion (P < 0.05).
Conclusions
Our study suggests that following juvenile radiation exposure, FAPs contribute to long‐term skeletal muscle atrophy and fibrosis. These findings provide rationale for investigating FAP‐targeted therapies to ameliorate the negative late effects of radiation exposure in skeletal muscle.
Keywords: Atrophy, Differentiation, Extracellular matrix, Mesenchymal progenitors, Metabolism, Myofibroblast, Skeletal muscle
Introduction
Cancer survivorship is steadily increasing such that 82% of children and >2/3 of adults diagnosed with cancer will survive beyond 5 years. 1 Radiation therapy is a standard treatment for over 50% of cancer patients; however, the negative consequences of radiation exposure to healthy tissues results in debilitating long‐term consequences in cancer survivors. 2 Skeletal muscle was traditionally believed to be radiation resistant due to its post‐mitotic nature. Recent evidence indicates that radiation‐induced muscle pathology, characterized by atrophy, fibrosis, hypoplasia, and contracture,S1 is experienced by 80% of cancer survivors.S2 These late skeletal muscle effects have serious consequences including weakness and reduced mobility leading to morbidity and disability.S3 The lack of effective therapies to prevent the detrimental muscular consequences of radiation therapy is a critical gap in cancer survivorship that affects the long‐term health and physical performance of survivors.
Skeletal muscle growth, maintenance, and repair depend on complex and dynamic interactions between muscle satellite (stem) cells (MuSCs) and their niche.S4 MuSCs reside in a quiescence state and are located between the basal lamina and the cell membrane of the muscle fibre.S5 During skeletal muscle development, MuSCs are indispensable for normal muscle growth 3 and lifelong maintenance. 4 Preclinical models have shown the effect of cancer treatment on skeletal muscle and MuSC content. 4 , 5 , 6 , 7 In prepubertal mice, radiation therapy causes an immediate reduction in MuSC content resulting in a decrease in myonuclear number, cross‐sectional area (CSA), and loss of muscle mass. 4 Strategies to mitigate radiation damage by replacing lost MuSCs via transplantation have had limited clinical success,S6 even when a relatively small population of radiation‐resistant MuSCs are transplanted. 8 These results suggest that the alteration induced by radiation in the muscle niche contribute to impaired skeletal muscle growth in juvenile cancer survivors.
The MuSC niche consists of several mononuclear cell populations that contribute to muscle growth and regeneration. Vascular endothelial cells are important for maintaining MuSCs stemness, and controlling the infiltration of immune cells,S7,S8 which are critical regulators of the inflammatory and regenerative response following muscle injury. 9 ,S9 Mesenchymal progenitors, also known as fibro‐adipogenic progenitors (FAPs), are muscle resident, non‐myogenic progenitor cells identified by the expression of platelet‐derived growth factor receptor alpha (PDGFRα). 10 , 11 FAPs provide pro‐myogenic signals essential for muscle growth, maintenance, and regeneration. 11 , 12 First described as regulators of myogenic differentiation during regeneration, 10 recent work has identified a role for FAPs in myoblast activation, 13 muscle growth, 14 ,S10,S11 and maintenance. 15 FAPs regulate these processes primarily via paracrine mechanisms 16 ,S12 with pro‐myogenic subpopulations beginning to be identified. 17 , 18 Specific paracrine factors secreted by FAPs that promote myogenesis include bone morphogenic protein 3B, 19 WNT1 inducible signalling pathway protein 1, 13 and follistatin. 20 Conversely, under pathological conditions, FAPs directly contribute to fibrotic and fatty tissue accumulation in skeletal muscle 10 , 11 , 12 , 15 via their differentiation into myofibroblast, adipocytes, or osteocytes/chondrocytes. 21 Indeed, in diverse muscle pathologies, with excess ECM deposition, FAPs expand, and localize to fibrotic areas. 22 , 23 , 24 ,S13,S14 In a murine model of pediatric cancer plus radiation therapy, an increase in inflammatory and pro‐fibrotic genes was observed, 14 accompanied by lifelong muscle fibrosis. 25 At the cellular level, activated myofibroblasts which are derived from FAPs and express stress fibres with highly contractile properties, are mainly responsible for ECM synthesis and depositionS15. As such, FAP differentiation into myofibroblasts has been implicated in skeletal muscle fibrosis.S16 However, FAPs' role in radiation‐induced muscle pathology has not previously been examined. Thus, the present study aimed to characterize the effects of radiation on skeletal muscle architecture and different cell population in the muscle niche with a specific focus on determining the role of FAPs in a juvenile model of radiation‐induced muscle fibrosis.
Methods
Additional and complete description of the protocols are included in the extended methods section available in the supporting information Data S1.
Mice and ethics statement
The present study was conducted in accordance with guidelines established by the Canadian Council on Animal Care and received ethical approval from the University of Ottawa Animal Care and Veterinary Service Committee. Mice were housed in a pathogen‐free environment (22–25°C, 30% humidity, and a 12‐hour light: dark cycle) and were supplied with food and water ad libitum. Four‐week‐old male C57Bl/6J (#000664) mice and male CBA (#000656) mice were purchased from The Jackson Laboratory. An acclimatization period of 1 week was allowed for mice prior to experiments.
Acute radiation exposure
One hindlimb of 4‐ to 5‐week‐old CBA or C57Bl/6J male mice was exposed to a single dose (16 Gy) 26 of in vivo irradiation (in vivo‐IR) (X‐RAD 320, Precision X‐Ray Irradiation, North Branford, CT), while the rest of the body was lead‐shielded and contralateral limb served as the non‐IR control (CLTR). Mice were anaesthetised by constant administration of isoflurane and oxygen throughout the irradiation procedure. Mice underwent daily evaluation by animal facility staff following radiation exposure and were sacrificed at 3, 7, 14, and 56 days post‐IR (n = 6–8/day, Figure 1A). For in vitro irradiation (in vitro‐IR) experiments, a single dose of 1 Gy was applied to cells.S17
Figure 1.
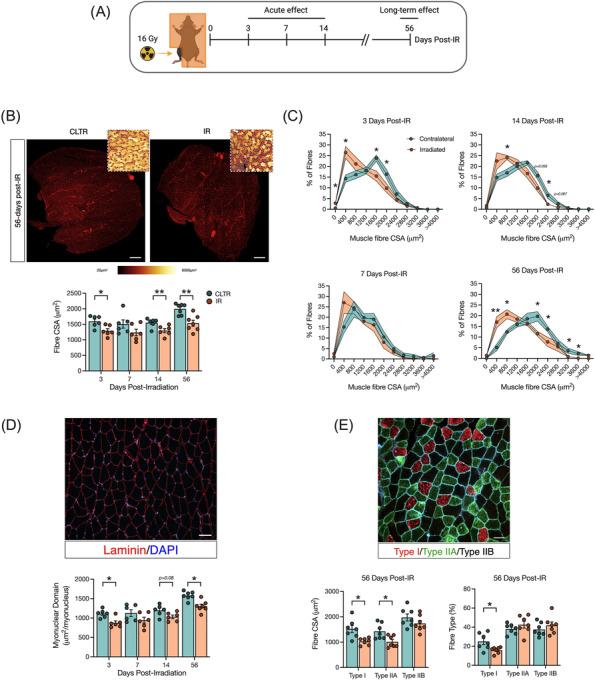
Radiation induces muscle atrophy particularly in oxidative fibres. (A) Experimental design. (B) Gas/sol muscle complex CSA at 56 days post‐IR, laminin staining (red), colour‐coded CSA to visualize changes in myofibre size (insert). Scale bar: 500 μm, and fibre CSA (μm2). (C) Muscle fibre distribution at 3, 7, 14, and 56 days post‐IR. (D) Myonuclear domain, and representative image of CSA: Laminin (red), DAPI (blue). Scale bar 100 μm. (E) Representative image of myosin heavy chain (MyHC) staining, type I fibres (red), type IIA (green), type IIB (black) at 56 days post‐IR, fibre type CSA and % of muscle fibre type at 56 days post‐IR. *P < 0.05, **P < 0.01; paired Student's t‐test between CLTR and IR at each timepoint (n = 6–7).
Tissue collection
The gastrocnemius/soleus (Gas/sol) complex was resected and divided for immunofluorescence analysis by embedding in optimal cutting temperature (OCT, Cat# 4585, Fisher Scientific) compound prior to flash freezing in liquid nitrogen‐cooled isopentane (Cat# 277258‐1L, Sigma‐Aldrich), or flash frozen for western blot analysis and stored immediately at −80°C, or weighed for immediate processing for fluorescence‐activated cell sorting (FACS) and/or flow cytometry analysis.
Histochemical and immunofluorescent analysis
From the mid‐belly of the gastrocnemius, 10‐μm‐thick sections were cut and mounted on a Premium Frosted Microscope Slides (Cat# 12‐544‐2, Fisher Scientific) using an HM 525 NX‐2210 cryostat. Masson's Trichrome staining was conducted by the Histology Core and the University of Ottawa as previously described. 27 A complete description of immunofluorescent protocols for Pax7, PDGFRα, CD31, F4/80, and CD206 are provided in the extended methods.
Fluorescence‐activated cell sorting and flow cytometer
For FACS and flow cytometry analysis, skeletal muscle was prepared as previously described with some modifications (see extended methods).S18
Protein extraction and western blot analysis
Western blot analysis was performed as previously described. 28
5‐Ethynyl‐2′‐deoxyuridine incorporation assay
For in vitro 5‐ethynyl‐2′‐deoxyuridine (EdU) incorporation assay, cells were seeded and incubated with 10 μM of EdU for 72 h. Click‐iT EdU Assay Kits (Ca# C10337, Thermo Fisher Scientific) was performed according to the manufacturer's instructions. Images were acquired by CellDiscoverer7 microscope (ZEISS) and analysed by a semi‐automated pipeline using Zen Blue (v. 2.6) software.
Fibro/adipogenic progenitors and C3H/10T1/2 cell culture and differentiation
Sorted primary FAPs were resuspended in DMEM High Glucose (Cat# 319‐005‐CL, Wiset Bioproducts), 20% FBS (Cat# 12483‐020, Thermo Fisher Scientific), bFGF (5 ng/mL, Cat# F0291, MilliporeSigma), and 100 U/mL penicillin/streptomycin (P/S) (Cat# 15140‐122, Thermo Fisher Scientific). C3H/10T1/2, a mesenchymal progenitor cell line (ATCC, Clone 8 Cat# CCL‐226™), was used as an in vitro model of FAPs. C3H/10T1/2 were culture in DMEM High Glucose, 10% FBS, and 100 U/mL P/S. FAP and C3H/10T1/2 adipogenic differentiation was initiated by applying MesenCult™ Adipogenic Differentiation Kit (Cat# 05507, Stemcell Technologies) for 3 days followed by adipogenic maintenance medium for two additional days (1 μg/mL insulin, Cat# I9278, MilliporeSigma). Fibrogenic differentiation of FAPs and C3H/10T1/2 cells was accomplished by culturing in DMEM high glucose, 2% horse serum, 5 ng/mL of TGFβ‐1 (Cat# 100‐21, PeproTech), and 100 U/mL P/S.
Muscle satellite (stem) cells culture and differentiation
Freshly FACS sorted MuSCs were cultured in growth media consisting of DMEM high glucose, 20% FBS, bFGF (5 ng/mL, Cat# F0291, MilliporeSigma), and 100 U/mL P/S. Differentiation media for primary MuSCs consisted of DMEM low glucose (Cat#319‐010‐CL, Wiset Bioproducts), 2% Horse Serum (Cat# 16050122, Thermo Fisher Scientific), and 100 U/mL P/S.
DNA damage assay
Cells were fix in 4% PFA at 15 min and 24 h after in vitro‐IR. Anti‐phospho‐Histone H2A.X (Ser139) (Cat# 9718T, Cell Signalling Technology) was applied and the nuclei were counterstained with 4′, 6‐diamidino‐2‐phenylindole (DAPI) (Cat# D9542, Sigma‐Aldrich).
Stress fibres assay
Fibrogenic differentiation was induced as described above, and then cells were fixed with 4% PFA for 10 min at room temperature and permeabilized with 0.5% Triton X‐100 for 5 min. Cells were incubated with block solution (10% FBS, 0.1% Triton X‐100 in 1× PBS) for 1 h. Primary antibody for alpha‐smooth muscle actin (αSMA) was applied and incubated overnight at 4°C. Secondary antibody Alexa Fluor 594‐Goat Anti‐Mouse (Cat# A11005, Invitrogen) was used to visualize stress fibre formation and nuclei were counterstained with DAPI. Stress fibre formation was analysed from line profilesS19 with Fiji software.
Oxidative stress assay
Cells were exposed to in vitro‐IR and resuspended in media containing CellROX™ Green reagents (Cat# C10444, Thermo Fisher Scientific) at a final concentration of 5 μM at 37°C for 30 min according to manufacturer's instructions.
Senescence assay
Senescence‐associated β‐galactosidase (SA‐β‐Gal) staining was performed according to manufacturer's instructions (Cat# 9860, Cell Signalling Technology).
MitoTracker Green
FAPs were plated at a density of 0.5 × 10⁶ cells in a 35 mm glass bottom cell culture dish (Cat# 627860, Greiner Bio‐One) and stained with MitoTracker Green FM (Cat# M7514, Invitrogen) according to manufacturer's instructions.
Bioenergetic analysis
FACS‐isolated FAPs were immediately plated on Seahorse XFe96 Microplates (Cat# 101085‐004 Agilent Technologies) at 1.0 × 10⁵ cells per well. In vitro‐IR was applied with non‐irradiated FAP cell cultures used as control (CON). After 24 h, cellular bioenergetics were evaluated using the Seahorse XFe96 Analyser as previously described. 29
DNA isolation and qPCR
The mitochondrial to nuclear DNA ratio was determined as previously described with minor modifications (see extended methods).S20
Low‐high glucose assay
C3H/10T1/2 cells were cultured in low glucose DMEM (1 g/L) or high glucose DMEM (4.5 g/L), respectively, for 24 h and αSMA staining was performed for stress fibres visualization.
Fibro/adipogenic progenitor‐derived conditioned media experiment
FAPs and MuSCs were freshly isolated from the IR and the CLTR limb at 3 and 56 days post‐in vivo‐IR by FACS. After 3 days of culture, conditioned media (CM) from IR‐FAPs or CLTR‐FAPs were recovered. CM was centrifuged to remove dead cells at 600× g for 5 min and applied to non‐irradiated primary myoblast (CON) with differentiation media (50:50 volume/volume) as previously described. 30 Following 3 days in culture, myotubes were fixed and stained for myosin heavy chain.
Statistical analyses
Analyses were conducted by an investigator blinded to the experimental group. Values are expressed as mean ± standard error of the mean (SEM). The number of biological replicates (n) for each experiment is indicated in the figure legend. Comparisons between IR and CLTR limbs were performed using paired Student's t‐tests. Comparisons between IR and CON cells were performed using unpaired Student's t‐tests. Changes over time were performed using one‐way ANOVAs. A P value of <0.05 was considered statistically significant. Statistics and graphs were prepared using GraphPad Prism version 8.0.1 software (GraphPad Software).
Results
Radiation induces long‐term myofibre atrophy and a lower proportion of type I muscle fibres
Myofibre characteristics were evaluated at several timepoints following in vivo‐IR. IR significantly reduced myofibre CSA at 3, 14, and 56 days post‐IR compared with CLTR (Figure 1B) with significantly more smaller diameter fibres at 3, 14, and 56 days post‐IR (Figure 1C). Similarly, myonuclear domain was significantly smaller in the IR‐limb at 3 and 56 days post‐IR (Figure 1D). Type I and type IIA fibre CSA were significantly smaller at 56 days post‐IR, with no change in type IIB fibre CSA (Figure 1E). Further, a smaller proportion of type I fibres was detected in the IR limb at 56 days post‐IR with no differences in type IIA or IIB proportion (Figure 1E). Mice had higher body weight at day 56 compared with 3, 7, and 14 days (Figure S1A) with no changes in Gas/sol weight per body weight (g/g) (Figure S1B) or myofibre content (Figure S1C). There was a trend for fewer myonuclei per fibre at 56 days (P = 0.09, Figure S1D).
Radiation induces long‐term muscle fibrosis independent of sustained p‐SMAD3 signalling
To confirm previous studies showing that IR‐induces long‐term muscle fibrosis, 25 , 26 Mason's trichrome staining was performed and fibrotic signalling pathways were evaluated using western blot analysis. Muscle fibrosis was significantly higher in the IR limb versus the CLTR limb at 56 days but not 14 days post‐IR (Figure 2A). Significantly higher levels of the fibrotic markers fibronectin and α‐smooth muscle actin (αSMA)S21 were detected at 56 days post‐IR (Figure 2B). SMAD3 phosphorylation, a well know downstream target of the transforming growth factor β1 (TGFβ‐1) and a critical regulator of fibrosis,S22 was significantly elevated at 3 days post‐IR but returned to CLTR levels at 56 days post‐IR (Figure 2B).
Figure 2.
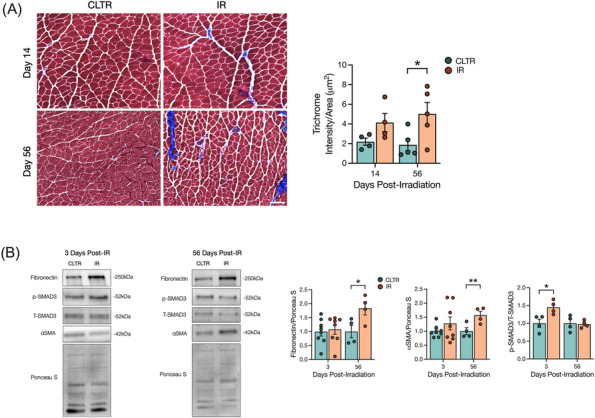
Radiation increases long‐term muscle fibrosis independent of sustained p‐SMAD3 signalling. (A) Representative image of Masson trichrome stain of muscle cryosections, and quantification of trichrome intensity per area of ROI. (B) Representative western blots of fibronectin, p‐SMAD3, t‐SMAD3, αSMA, and Ponceau S at 3 and 56 days post‐IR. Quantification of fibronectin, αSMA, and p‐SMAD3 protein expression. Scale bar: 200 μm (A). *P < 0.05, **P < 0.01; paired Student's t‐test between CLTR and IR at each timepoint (n = 4–8).
Radiation depletes skeletal muscle endothelial cells, MuSCs, and FAPs
To explore the effect of juvenile radiation exposure on various mononuclear cell populations in muscle, flow cytometry analysis was performed (Figure S2A,B). We detected significantly fewer endothelial cells at 56 days in the IR limb with no change in haematopoietic cells versus CLTR (Figure 3A). We also detected significantly fewer MuSCs at 3 and 56 days in IR versus CLTR, while FAPs were significantly lower at 56 days only in IR versus CLTR (Figure 3B). Our flow cytometry analyses were confirmed by immunofluorescence imaging showing significantly lower capillary to fibre ratio at 56 days in IR versus CLTR, with a trend for fewer CD31+ cells/area at 56 days in IR versus CLTR (P = 0.06, Figure S3A). Additional immunofluorescence analysis revealed significantly more macrophages in IR versus CLTR at 3 days post‐IR but not at 56 days (Figure S3B), with significantly fewer ‘M1’ macrophages at 14 days in IR versus CLTR, and significantly more ‘M2’ macrophages at 3 and 7 days in IR versus CLTR (Figure S3B). Immunofluorescence further confirmed our MuSC and FAP flow analyses as significantly fewer MuSCs were present in IR versus CLTR at 7, 14, and 56 days (Figure 3C), while significantly fewer FAPs were detected at 14 and 56 days in IR versus CLTR (Figure 3D).
Figure 3.
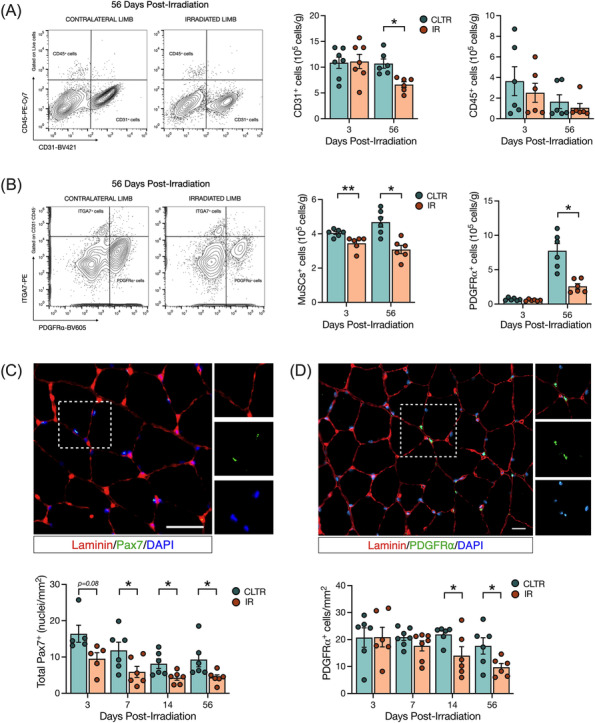
Radiation depletes endothelial cells, MuSCs, and FAPs long term. (A) Representative flow cytometry plots of CD31+ and CD45+ cells at 56 days post‐IR from CLTR and IR limb. CD31+ and CD45+ cells per grams of muscle. (B) Representative flow cytometry plots of ITGA7+ and PDGFRα+ cells at 56 days post‐IR from CLTR and IR limb. ITGA7+ and PDGFRα+ cells per grams of muscle. (C) Representative image of Pax7+ cells (green), laminin (red), and DAPI (blue). Scale bar: 20 μm. Total Pax7+ cells per mm2. (D) Representative image of PDGFRα+ cells (green), laminin (red) and DAPI (blue). PDGFRα cells per mm2. *P < 0.05, **P < 0.01; paired Student's t‐test between CLTR and IR at each timepoint (n = 5–8).
Radiation inhibits myoblast and FAP proliferation and induces acute DNA damage signalling and cell senescence
To functionally characterize the effects of radiation on MuSCs and FAPs, we isolated MuSCs and FAPs by FACS from in vivo‐IR or CLTR limbs for in vitro characterization of cell fate (Figures 4A and S4A–D). MuSC proliferation was significantly impaired in IR versus CLTR at both 3 and 56 days (Figure 4B). Conversely, FAP proliferation was not altered at 3 days post‐IR and demonstrated a trend for impairment at 56 days in IR compared with CLTR (P = 0.06, Figure 4B). The DNA damage (γH2AX foci) response was significantly higher in MuSCs and FAPs at 15 min post‐in vitro‐IR and remained elevated only in FAPs at 24 h (Figure 4C). Post‐in vitro‐IR, MuSCs had significantly higher cellular oxidative stress compared with CON at 15 min, but not at 24 h, while with no differences in oxidative stress levels were detected in FAPs (Figure 4D). Cellular senescence, as determined via senescence‐associated β‐galactosidase staining at 24 h post‐in vitro‐IR, was significantly higher in IR‐FAPs compared with CON‐FAPs (Figure 4E).
Figure 4.
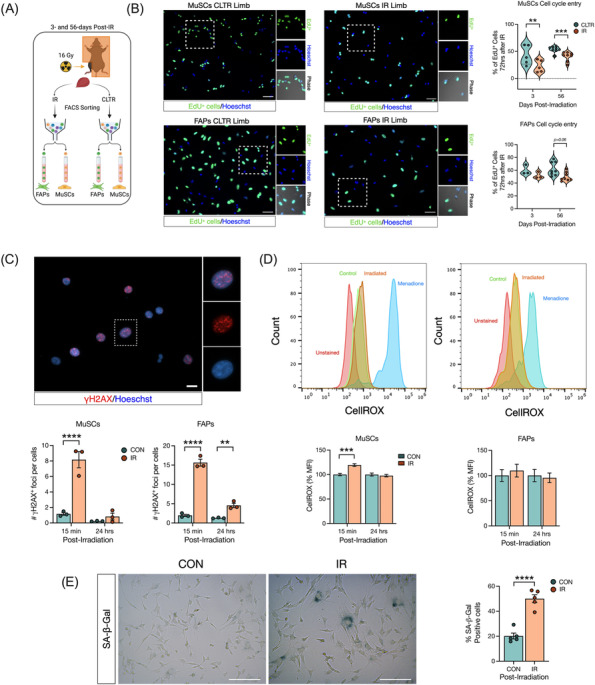
Radiation inhibits myoblast and FAP proliferation long‐term and induces acute DNA damage. (A) Experimental design. (B) Representative image of EdU+ MuSCs and FAPs from CLTR and IR limb from 56 days post‐in vivo‐IR. Percentage of EdU+ MuSCs and FAPs 72 h after in vivo‐IR. (C) Representative image of yH2AX+ foci per cell, and number of yH2AX+ foci in MuSCs and FAPs 15 min and 24 h post‐in vitro‐IR. (D) Representative flow cytometry histogram of CellROX fluorescence in MuSCs, and FAPs after in vitro‐IR. Quantification of CellROX mean fluorescence intensity (MFI) as a % of MuSCs, and FAPs 15 min and 24 h post‐in vitro‐IR. (E) Representative image of SA‐β‐Gal staining and %of SA‐β‐Gal+ cells. **P < 0.01, ***P < 0.001, ****P < 0.0001. Paired (B) and unpaired (C–E) Student's t‐test (n = 3–5).
Radiation promotes a fibrotic phenotype in FAPs
Unlike other pro‐fibrotic conditions, 31 ,S23,S24 we observed a reduction in FAP content and impaired FAP proliferation following radiation; thus, we speculated that radiation was promoting their fibrotic differentiation. In vitro‐IR FAPs (Figure 5A) were evaluated for several markers of fibrotic differentiationS25‐S27 compared with CON‐FAPs while FAPs treated with TGF‐β1 (+TGF‐β1) served as a positive control (Figure 5B). At 72 h following treatment, IR‐FAPs and +TGF‐β1‐FAPs were significantly larger (Figure 5B), had significantly more stress fibre formation per cell (Figure 5C), and had significantly elevated SMAD3 signalling than CON (Figure 5D). Supporting our in vivo findings, IR‐ and TGF‐β1‐treated FAPs had significantly lower PDGFRα content than CON (Figure 5D).
Figure 5.
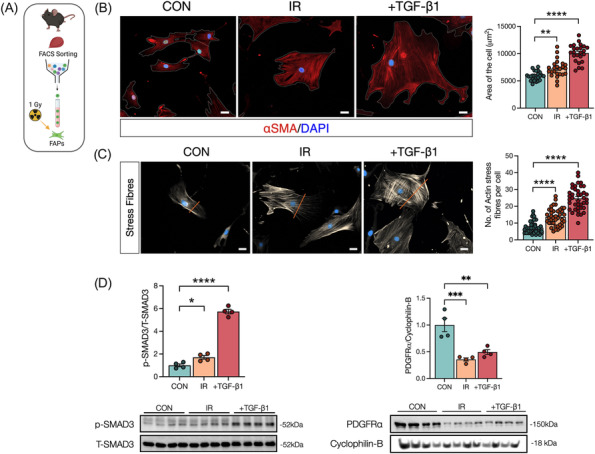
Radiation promotes fibrotic differentiation in fibro‐adipogenic progenitors. (A) Experimental design. (B) Representative image of FAPs 72 h post‐in vitro‐IR. Control, irradiated and TGF‐β1 (used as a positive control). αSMA (red), DAPI (blue). Scale bar: 20 μm. Average of cell area (μm2). (C) Representative image of FAPs 72 h post‐in vitro‐IR. αSMA (grey) staining to visualize stress fibres formation. Scale bar: 20 μm. Quantification of actin stress fibres per cell. (D) Quantification and representative western blots of FAPs after 72 h post‐in vitro‐IR showing, p‐SMAD3, T‐SMAD3, PDGFRα, and cyclophilin‐B. *P < 0.05, **P < 0.01, ****P < 0.0001. Unpaired Student's t‐test (n = 4).
Radiation induces a metabolic shift in FAPs to favour glycolysis and inhibiting glycolysis prevents myofibroblast differentiation
Previous work has linked radiation to alterations in skeletal muscle metabolism and mitochondrial function,S28,S29 and metabolic changes have been found to impact FAP fate. 32 , 33 Thus, we evaluated FAP bioenergetics at 3‐ and 24 h post‐in vitro‐IR to determine if IR‐induced alterations to FAP metabolism explained IR‐induced alterations in FAP fate. No changes in mitochondrial mass were detected in IR‐FAPs compared with CON at 24 h post‐in vitro‐IR (Figure S5A). Similarly, mitochondria DNA (mtDNA) to nuclear DNA (nDNA) ratio revealed no differences in mitochondrial biogenesis (Figure S5B). A significant increase in mitochondrial membrane potential was observed in IR‐FAPs compared with CON, even when normalized for mitochondrial mass in IR‐FAPs compared with CON (Figure 6A). Qualitatively, we observed consistently more fragmented mitochondria, a marker of increased glycolytic metabolism 34 , at 24 h in IR‐FAPs compared with CON (Figure 6A). Seahorse assay revealed that in vitro‐IR‐FAPs had higher glycolytic capacity and lower oxygen consumption rate/extracellular acidification rate (OCR/ECAR) ratio at maximal respiration versus CON (Figure 6B). Differences in oxidative capacity and ATP production were not detected; however, significantly lower proton leak was detected in IR‐FAPs versus CON (Figure 6C). Next, we asked if directly altering glycolysis promoted FAP fibrotic differentiation. After inhibiting glycolysis with 2‐Deoxy‐D‐Glucose (2‐DG), we observed a significant reduction in stress fibre formation following in vitro‐IR (Figure 6D). Conversely, no changes in stress fibre formation were found when oxidative phosphorylation activity is inhibited by Oligomycin. To increase glycolysis while maintaining oxidative metabolism, as observed in our in vitro‐IR model, we manipulated glucose levels in the media with high glucose media representing a condition where glycolysis and oxidative metabolism are activated, and low glucose media where glycolysis activity decreases while oxidative metabolism remains active.S30,S31 Under these conditions and 24 h post‐in vitro‐IR, we detected significantly more stress fibre formation under high glucose conditions compared with the low glucose condition (Figure 6E).
Figure 6.
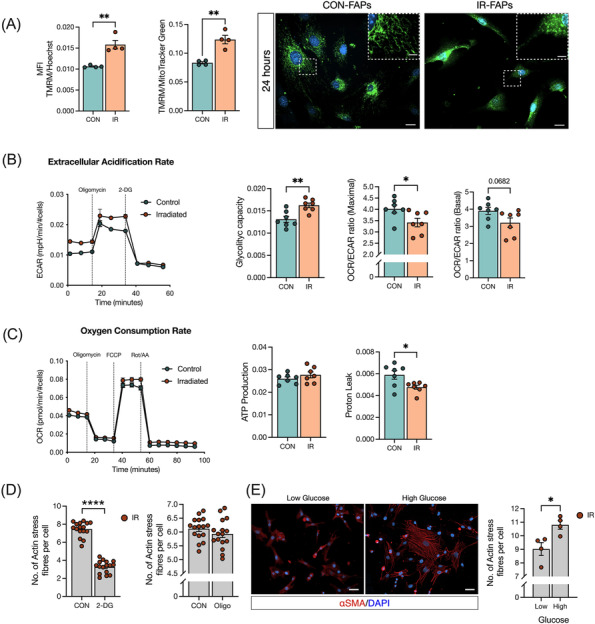
Radiation induces a metabolic shift in FAPs to favour glycolysis and inhibiting glycolysis prevents myofibroblast differentiation. (A) TMRM fluorescence intensity and TMRM fluorescence intensity normalized by mitochondrial mass (MitoTracker Green) from FAPs followed 24 h post‐in vitro‐IR. Representative image of MitoTracker Green staining 24 h post‐in vitro‐IR showing elongated and fractionated mitochondria. Scale bar: 20 μm; scale bar zoom in: 2 μm. (B) Extracellular acidification rate (ECAR), glycolytic capacity, OCR/ECAR ratio at maximal respiration, and OCR/ECAR ratio at basal respiration. (C) Oxygen consumption rate (OCR), ATP production, and proton leak. (D) Number of actin stress fibre from 24 h post‐in vitro‐IR on C3H/10T1/2 cells treated with 2‐DG or oligomycin. (E) Representative image of αSMA+ cells and number actin stress fibre followed low or high glucose treatment on C3H/10T1/2 cells. Scale bar: 50 μm. *P < 0.05, **P < 0.01, ****P < 0.0001. Unpaired Student's t‐test (n = 3–7).
Radiation alters the FAP secretome to inhibit myoblast differentiation and fusion
To determine if the observed cell‐intrinsic changes to FAPs exposed to IR impaired their role in regulating myoblast fate via paracrine mechanisms, we conducted a conditioned media experiment where conditioned media from IR or CLTR FAPs isolated at 3 and 56 days post‐in vivo‐IR was mixed with non‐irradiated primary myoblasts in differentiation media (50:50 v/v) 30 (Figure 7A). Myoblast differentiation and fusion was evaluated by myosin heavy chain and DAPI co‐immunocytochemistry (Figure 7B). Conditioned media from 56‐day isolated IR‐FAPs impaired myoblast differentiation compared with 56‐day isolated CLTR‐FAPs (Figure 7B, P < 0.05) with no differences between 3‐day isolated IR‐FAP and CLTR‐FAP conditioned media. Further, conditioned media from both 3‐ and 56‐day isolated IR‐FAPs significantly reduced the number of myotubes per area, myoblast fusion index, and the number of nuclei per myotube (Figure 7B) compared with CLTR. Despite these differences in myoblast differentiation and fusion, conditioned media (50:50 v/v) from 3‐ or 56‐day isolated IR‐FAPs did not reduce myoblast content, as determined by the total number of nuclei, compared with CLTR (Figure S6A). In a separate experiment, we applied conditioned media from the above groups to differentiated myotubes to determine if conditioned media from IR‐FAPs induced myotube atrophy (Figure S6B). Conditioned media from IR‐FAPs did not change myotube diameter or the proportion of myotubes of different diameters compared with CLTR (Figure S6B).
Figure 7.
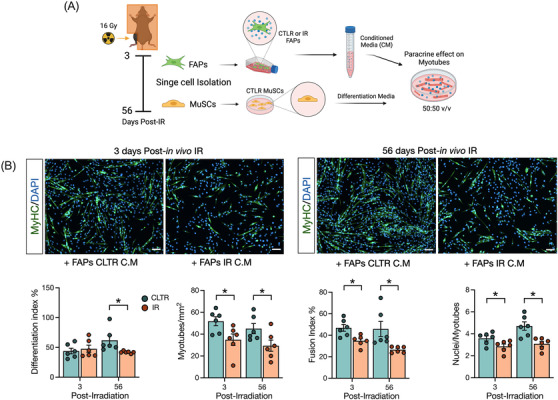
Radiation alters FAPs secretome to inhibit myoblast differentiation and fusion. (A) Experimental design. (B) Representative image on MyHC staining. MyHC (green), and DAPI (blue). Quantification of differentiation index, myotube per mm2, fusion index and nuclei per myotubes. Scale bar: 100 μm. *P < 0.05. Unpaired Student's t‐test (n = 6).
Discussion
Radiation induces long‐term muscle atrophy and fibrosisS1 and depletes MuSCs 25 resulting in long‐term complications in cancer survivors, particularly juvenile cancer survivors. However, the effects of radiation on mononuclear niche cells in muscle and their role in radiation‐induce fibrosis has remained relatively unexplored. The present study addresses this gap by characterizing the effects of radiation exposure on skeletal muscle morphology and skeletal muscle niche cells using a clinically relevant preclinical model. 26 Mice exposed to a single dose of radiation showed long‐term muscle atrophy and fibrosis, confirming clinical findings,S1 and reduced MuSC content as has been previously described. 4 Unlike other models of long‐term skeletal muscle fibrosis, 22 we observed long‐term FAP depletion in our model of radiation‐induced fibrosis, similar to what is observed in aged muscle. 13 , 19 Interestingly, FAP depletion was associated with increased myofibroblast differentiation and a reduction in PDGFRα content, which may have been driven by increased glycolytic metabolism. Further, radiation induced FAP senescence and altered their secretome in a manner that inhibited myoblast differentiation. Collectively, our data indicate FAPs as a potential cellular source responsible for radiation‐induce muscle pathology, likely driven by radiation‐induced mitochondrial defects leading to enhanced reliance on glycolysis.
Previous clinical findings indicate that 80% of childhood cancer survivors experience muscle atrophy and fibrosis,S1‐S3 a phenotype we successfully recapitulated in our preclinical model. The long‐term muscle atrophy we observed was due to a lower CSA specifically in the more oxidative type I and IIA fibres, and a lower proportion of type I fibres. Radiation reacts with oxygen molecules within the cell to produce reactive oxygen speciesS32; thus, it is not surprising that oxidative fibres would be more susceptible to the effects of radiation. Indeed, our findings align with previous studies showing that radiation reduces the percentage of oxidative type I muscle fibresS29 and decreases the CSA of type IIA myofibres. 26 Juvenile muscle growth requires MuSCs. 3 Similar to previous work, we show that radiation exposure decreases MuSC content as early as 3 days after radiation exposure and is not restored. 4 , 25 FAPs are also required for muscle maintenance, 15 , 19 and we present the novel finding that FAP content decrease persists long after radiation. Thus, radiation‐induced FAP and MuSC depletion likely contributed to the lower myofibre CSA observed in this model. Because FAPs regulate muscle mass via paracrine mechanisms, 12 ,S33 we investigated whether radiation altered the FAP secretome. Interestingly, we showed that the in vivo irradiated FAP secretome impaired MuSC fusion and differentiation without impacting MuSC proliferation or inducing myotube atrophy directly in vitro. This finding was supported by a trend for fewer myonuclei per fibre at the latest post‐IR timepoint, demonstrating a persistent alteration of the FAP secretome long after IR. These findings align with results from aged FAPs, which have a reduced capacity to regulate the myogenic program due to aging‐induced alterations in the FAP secretome. 13 , 19 Although we were not able to identify specific trophic factors that were altered following radiation exposure, previous work has identified several potential targets for future studies. 12 Specifically, WNT1 inducible signalling pathway protein 1 regulates MuSC proliferation and differentiation and is reduced in aged FAPs. 13 Further, follistatin and bone morphogenic protein 3B have also been well‐described as regulators of MuSC differentiation and muscle maintenance. 19 , 20 Together, our findings suggest that reduced myofibre CSA following radiation exposure is due, in part, to long‐term MuSC depletion and impaired FAP paracrine signalling resulting in reduced myogenic differentiation of remaining MuSCs.
Skeletal muscle fibrosis is one of the most prominent adverse effects experienced by childhood cancer survivors.S2 Our results confirmed previous work 25 by demonstrating ECM accumulation at 56 days post‐IR, which was supported by an increase in pro‐fibrotic markers such as fibronectin and αSMA. Gene expression data from Kallenbach and colleagues implicated TGF‐β1 in radiation‐induced muscle defects. 25 Similarly, we observed an early upregulation of SMAD3 signalling following radiation; however, this signalling was not maintained long‐term. SMAD3 signalling is a critical regulator of myofibroblast transitionS34; thus, the early increase in SMAD3 signalling in the whole muscle could be the initial trigger for the myofibroblastic transition that leads to the long‐term fibrosis observed in our study. One of the main contributors to ECM deposition in the skeletal muscle are myofibroblasts that are driven from FAP fibrogenic differentiation.S35 FAPs co‐localize to fibrotic areas in different models of myopathy characterized by continued structural damage to the myofibres,S13 as in human patients with Duchenne muscular dystrophy. 23 Conversely, FAPs were depleted in our model suggesting that radiation‐induced muscle fibrosis more closely aligns with muscle fibrosis seen in aging,S36 which is associated with reduced FAP content. 13 , 19 Interestingly, the putative FAP marker PDGFRα 11 is reduced when FAPs undergo fibrotic differentiation 35 , 36 which aligns with our in vivo and in vitro findings. Further, Yao and colleagues showed that while PDGFRα supported early fibroblast proliferation, PDGFRα down‐regulation was necessary for fibrogenic transition into αSMA+ myofibroblast. 36 We extend these findings to the context of radiation‐induced fibrosis by showing that PDGFRα is reduced in FAPs during their fibrotic transition following radiation exposure. In addition, myofibroblasts exhibit a senescence‐like phenotype,S37 and senescence has been associated with muscle dysfunction.S38 Our findings show that radiation induces FAP senescence with persistent DNA damage and reduced proliferation. Our findings align with those from Moiseeva and colleagues, 37 showing that senescent cells accumulate in aged skeletal muscle and are associated with fibrosis. Moreover, Zhang and colleagues showed that a FAP subpopulation present a senescence signature in old skeletal muscle, 38 and FAPs isolated from old skeletal muscles have enhanced fibrotic differentiation, 13 further supporting the notion that radiation induces a premature aging phenotype in skeletal muscle. Together, these findings suggest that radiation depletes PDGFRα+ FAPs by inducing their fibrotic differentiation, which contributes to radiation‐induced skeletal muscle fibrosis.
Recent studies have provided a link between metabolism and FAP fate, 32 , 33 , 39 and radiation has been shown to impair mitochondrial dynamics and function.S28,S29 Thus, we examined if fibrotic differentiation in IR‐FAPs was linked to alterations in FAP metabolism. Our results showed that despite an increase in mitochondrial membrane potential, essential for ATP production, we did not detect alterations in ATP‐linked respiration or oxidative capacity. Further, we did not detect any changes in mitochondrial content. Elevated mitochondrial membrane potential in cardiac mesenchymal precursors cells has been associated with increased oxidative metabolismS39; however, this was not the case in the present work. Rather, the increase in mitochondrial membrane potential observed in our results could be due to the decrease in proton leakS40 observed following radiation exposure. Further, elevated membrane potential is traditionally associated with increased ROS production.S41 Changes in mitochondrial structural integrity due to fission have been associated with increasing glycolytic metabolism, 34 ,S42 which aligns with our qualitative observations of mitochondria in IR‐FAPs. This notion is further supported by the higher glycolytic rates for energy production in in vitro‐IR‐FAPs. An increase in glycolytic metabolism, and not mitochondrial metabolism, may be a protective mechanism to prevent cellular oxidative stress while matching an elevated ATP demand.S43 Indeed, fibroblasts treated with H2O2 demonstrate an increase in glycolysis and NADPH content, a cofactor associated with antioxidant activity.S44 Further, cardiac mesenchymal progenitors with high membrane potential demonstrated higher resistance to oxidative stress and elevated SOD2.S39 Similar mechanisms in FAPs may explain the lack of change we observed in FAP oxidative stress following radiation exposure. Together, these findings suggest that following radiation exposure, FAPs experience increased glycolytic metabolism perhaps to increase ATP production while preventing oxidative stress from mitochondria.
Growing evidence suggest the modulation of glycolysis and oxidative phosphorylation as a determinant of stem cell fate.S45,S46 Indeed human FAPs with enhanced glycolytic metabolism have a fibrotic phenotype. 33 Given that radiation enhanced FAP glycolysis and induced their fibrotic differentiation, we investigated if alterations to FAP metabolism were driving the fibrotic differentiation. In line with this hypothesis, inhibiting glycolysis with 2‐DG reduced FAP fibrotic differentiation. While inhibiting oxidative metabolism with oligomycin had no effect on FAP fate, we reasoned that this model did not completely recapitulate the post‐IR condition as oxidative metabolism is still active following radiation. Thus, we modulated glycolysis while maintaining oxidative metabolism in vitro by exposing FAPs to high and low glucose conditions. Under high glucose conditions, glycolysis would be elevated and oxidative phosphorylation would also be active, similar to post‐IR; however, in low glucose conditions, glycolysis is decreased while oxidative metabolism is maintained.S30,S31 Indeed, FAP fibrotic differentiation was enhanced when glycolysis was elevated and oxidative metabolism still active, similar to the post‐IR phenotype suggesting that the shift to glycolysis to maintain energy homeostasis following radiation exposure enhances FAP fibrotic differentiation. In agreement with our results, decreased fibroblast activation, proliferation and differentiation is observed, when glycolysis is inhibited.S47,S48 Similarly, Reggio and colleagues decreased FAP proliferation by reducing glucose concentrations in the culture media. 32
A limitation of the study is using a single radiation dose as opposed to fractionated doses as is conducted during cancer therapy. Unfortunately, given the shorter lifespan of the mice, an exact replication of the human radiation protocol would have resulted in mice being treated well‐beyond their pubertal development. As such, we used the biologically equivalent dose formulaS49 to determine that a 16 Gy dose is predicted to be biologically equivalent to 60 Gy delivered in 2 Gy fractions/day which is normally used to treat different types of common cancers.S50 Previous work has used this dose to replicate radiation‐induced pathology. 4 , 26 Further, the clinical phenotype of fibrosis and muscle atrophyS1,S2,S3 was reproduced by our dosing strategy further supporting the translational relevance of our model. Another limitation of our study was the decision to irradiate mice without cancer. This decision was taken for several reasons. First, the presence of a tumour would complicate data interpretation by adding another variable. Second, there are clinical scenarios when radiation is delivered without a tumour, such as in the adjuvant setting. Finally, previous work has shown that the presence of a tumour within the muscle microenvironment during radiation exposure produces similar outcomes as the cancer‐free irradiated limb. 25 We also acknowledge that radiation is not a targeted therapy and can alter adjacent tissues. Indeed, our laboratory and others have shown that radiation alters the bone marrow. 40 ,S51 Future studies should address the crosstalk between bone and muscle and find potential circulatory mediators that may contribute to skeletal muscle atrophy following radiation exposure.
Together, our results indicate that juvenile radiation exposure alters the whole skeletal muscle niche long‐term. Specifically, the novelty of our findings suggests that FAPs contribute to long‐term skeletal muscle atrophy and fibrosis following juvenile radiation exposure. These findings suggest that FAP‐targeted therapies may help mitigate the negative long‐term consequences observed in cancer survivors.
Conflict of interest
The authors declare no competing interests.
Funding
This work was supported by the Natural Sciences and Engineering Research Council of Canada (RGPIN‐2017‐04320), the Ontario Early Research Award, the Canadian Foundation for Innovation, the Canadian Institute for Health Research (PDI 184016), and discretionary research funds (M.D.). N.C. is supported by The Chilean National Agency for Research and Development (Agencia Nacional de Investigacion y Desarrollo [ANID]), the uOttawa/CHEO Research Institute's Doctoral Fellowship for Advancement of Biological Perspectives for Exercise Interventions Across the Lifespan, and the uOttawa Eric Poulin Centre for Neuromuscular Disease (CNMD) Scholarship in Translational Research (STaR). A.E.G is the recipient of a University of Ottawa Brain and Mind Research Institute uOttawa Eric Poulin Centre for Neuromuscular Disease Scholarship in Translational Research Award. K.J.M is funded by the Canadian Institutes of Health Research (MOP 159455) and the NSERC Collaborative Research and Training Experience Program (Metabolomics Advanced Training and International Exchange Program) and discovery grants (RGPIN 2018‐06838 and DGECR 2018‐00012).
Supporting information
Figure S1. Changes in mice body weight, and no changes in muscle fibre number and myonuclei per fibre following radiation. (A) Body weight (g), (B) gas/sol weight per body weight (g/g), (C) number of muscle fibres at 56‐days post‐IR per cross‐section, and (D) number of myonuclei per fibre. One‐way ANOVA (A), and Paired Student's t‐test between CLTR and IR at each timepoint (B‐D). *p < 0.05 (n = 6–8).
Figure S2. Flow cytometer gating strategy (A) Flow cytometer gating strategy. (B) Fluorescence minus one (FMO) staining to establish gating strategy.
Figure S3. Radiation induces macrophage polarization, decreases vascular endothelial cells content, and reduces PDGFRα content. (A) Representative image of vascular endothelial cells. CD31+ cells (red), Dystrophin (green), and DAPI (blue). Scale bar 20 μm. Quantification of capillary to fibre ratio, and CD31+ cells per mm2. (B) Representative image of macrophages staining. F4/80+ cells (green), CD206+ cells (red), and DAPI (blue). Scale bar: 16 μm. Quantification of: Total macrophages (F4/80+) per μm2. ‘M1’ macrophages (F4/80+/CD206−) per μm2, and ‘M2’ macrophages (F4/80+/CD206+) per um2. *p < 0.05, Paired Student's t‐test between CLTR and IR at each timepoint (n = 3–8).
Figure S4. FAP, MuSC, and C3H/10T1/2 cell differentiation. (A) FACS gating strategy. (B) Representative images of FAPs expressing: PDGFRα (green), fibrogenic FAP differentiation expressing αSMA (orange), adipogenic FAP differentiation expressing Perilipin (red), and DAPI (blue), and MuSCs differentiation expressing MyHC (red), and DAPI (blue). (C) Representative images of C3H/10T1/2 cells expressing: PDGFRα (green), fibrogenic differentiation αSMA (orange), adipogenic differentiation Perilipin (red), and DAPI (blue). Scale bar: 20 μm.
Figure S5. No changes in mitochondrial biogenesis followed in vitro radiation. (A) MitoTracker Green Fluorescence Intensity normalized by Hoechst Fluorescence Intensity. (B) Mitochondrial DNA to nuclear DNA (mtDNA/nDNA) ratio.
Figure S6. Total number of Nuclei is not altered by radiation and no changes in myotube diameter is found when condition media from IR‐FAPs is applied. (A) Total number of nuclei per field (B) Representative brightfield image of myotube formation used to quantify myotube diameter (μm). Scale bar: 100 μm. Unpaired Student's t‐test. (n = 5–6).
Data S1. Supporting Information.
Data S2. Supporting Information.
Acknowledgements
We want to acknowledge the laboratory manager, Fernando Ortiz, of the Cell Sorting and Flow Cytometry Core Facility at the Ottawa Hospital Research Institute for his assistance with Cell Sorting. Also, we would like to acknowledge the services of the Behavioural Core Facility, Pre‐clinical Imaging Core Facility, the Cell Biology and Image Acquisition Core, and the Louise Pelletier Histology Core Facility at the Faculty of Medicine at the University of Ottawa. Lastly, we acknowledge the important published work that were not able to be cited because of word count and references limitations. This manuscript complies with the ethical guidelines for authorship and publishing in the Journal of Cachexia, Sarcopenia and Muscle.S55
Collao N., D'Souza D., Messeiller L., Pilon E., Lloyd J., Larkin J., et al (2023) Radiation induces long‐term muscle fibrosis and promotes a fibrotic phenotype in fibro‐adipogenic progenitors, Journal of Cachexia, Sarcopenia and Muscle, 14, 2335–2349, 10.1002/jcsm.13320
References
- 1. Canadian Cancer Society's Advisory Committee on Cancer Statistics . Canadian Cancer Statistics (2015). [Google Scholar]
- 2. Miller KD, Nogueira L, Mariotto AB, Rowland JH, Yabroff KR, Alfano CM, et al. Cancer treatment and survivorship statistics, 2019. CA Cancer J Clin 2019;69:363–385. [DOI] [PubMed] [Google Scholar]
- 3. Bachman JF, Klose A, Liu W, Paris ND, Blanc RS, Schmalz M, et al. Prepubertal skeletal muscle growth requires Pax7‐expressing satellite cell‐derived myonuclear contribution. Development 2018;145:dev167197. [DOI] [PMC free article] [PubMed] [Google Scholar]
- 4. Bachman JF, Blanc RS, Paris ND, Kallenbach JG, Johnston CJ, Hernady E, et al. Radiation‐induced damage to prepubertal Pax7+ skeletal muscle stem cells drives lifelong deficits in myofiber size and nuclear number. iScience 2020;23:101760. [DOI] [PMC free article] [PubMed] [Google Scholar]
- 5. Rosenblatt JD, Parry DJ. Gamma irradiation prevents compensatory hypertrophy of overloaded mouse extensor digitorum longus muscle. J Appl Physiol 1985;1992:2538–2543. [DOI] [PubMed] [Google Scholar]
- 6. Adams GR, Caiozzo VJ, Haddad F, Baldwin KM. Cellular and molecular responses to increased skeletal muscle loading after irradiation. Am J Physiol Cell Physiol 2002;283:C1182–C1195. [DOI] [PubMed] [Google Scholar]
- 7. Paris ND, Kallenbach JG, Bachman JF, Blanc RS, Johnston CJ, Hernady E, et al. Chemoradiation impairs myofiber hypertrophic growth in a pediatric tumor model. Sci Rep 2020;10:19501. [DOI] [PMC free article] [PubMed] [Google Scholar]
- 8. Scaramozza A, Park D, Kollu S, Beerman I, Sun X, Rossi DJ, et al. Lineage tracing reveals a subset of reserve muscle stem cells capable of clonal expansion under stress. Cell Stem Cell 2019;24:944–957.e5. [DOI] [PMC free article] [PubMed] [Google Scholar]
- 9. Collao N, Rada I, Francaux M, Deldicque L, Zbinden‐Foncea H. Anti‐inflammatory effect of exercise mediated by toll‐like receptor regulation in innate immune cells ‐ a review. Int Rev Immunol 2020;39:39–52. [DOI] [PubMed] [Google Scholar]
- 10. Joe AWB, Yi L, Natarajan A, Le Grand F, So L, Wang J, et al. Muscle injury activates resident fibro/adipogenic progenitors that facilitate myogenesis. Nat Cell Biol 2010;12:153–163. [DOI] [PMC free article] [PubMed] [Google Scholar]
- 11. Uezumi A, Fukada S, Yamamoto N, Takeda S, Tsuchida K. Mesenchymal progenitors distinct from satellite cells contribute to ectopic fat cell formation in skeletal muscle. Nat Cell Biol 2010;12:143–152. [DOI] [PubMed] [Google Scholar]
- 12. Biferali B, Proietti D, Mozzetta C, Madaro L. Fibro–adipogenic progenitors cross‐talk in skeletal muscle: the social network. Front Physiol 2019;10:10. [DOI] [PMC free article] [PubMed] [Google Scholar]
- 13. Lukjanenko L, Karaz S, Stuelsatz P, Gurriaran‐Rodriguez U, Michaud J, Dammone G, et al. Aging disrupts muscle stem cell function by impairing matricellular WISP1 secretion from fibro‐adipogenic progenitors. Cell Stem Cell 2019;24:433–446.e7. [DOI] [PMC free article] [PubMed] [Google Scholar]
- 14. Collao N, Sanders O, Caminiti T, Messeiller L, De Lisio M. Resistance and endurance exercise training improves muscle mass and the inflammatory/fibrotic transcriptome in a rhabdomyosarcoma model. J Cachexia Sarcopenia Muscle 2023;14:781–793. [DOI] [PMC free article] [PubMed] [Google Scholar]
- 15. Wosczyna MN, Konishi CT, Perez Carbajal EE, Wang TT, Walsh RA, Gan Q, et al. Mesenchymal stromal cells are required for regeneration and homeostatic maintenance of skeletal muscle. Cell Rep 2019;27:2029–2035.e5. [DOI] [PMC free article] [PubMed] [Google Scholar]
- 16. Giuliani G, Rosina M, Reggio A. Signaling pathways regulating the fate of fibro/adipogenic progenitors (FAPs) in skeletal muscle regeneration and disease. FEBS J 2021;289:6484–6517. [DOI] [PubMed] [Google Scholar]
- 17. Malecova B, Gatto S, Etxaniz U, Passafaro M, Cortez A, Nicoletti C, et al. Dynamics of cellular states of fibro‐adipogenic progenitors during myogenesis and muscular dystrophy. Nat Commun 2018;9:3670. [DOI] [PMC free article] [PubMed] [Google Scholar]
- 18. Leinroth AP, Mirando AJ, Rouse D, Kobayahsi Y, Tata PR, Rueckert HE, et al. Identification of distinct non‐myogenic skeletal‐muscle‐resident mesenchymal cell populations. Cell Rep 2022;39:110785. [DOI] [PMC free article] [PubMed] [Google Scholar]
- 19. Uezumi A, Ikemoto‐Uezumi M, Zhou H, Kurosawa T, Yoshimoto Y, Nakatani M, et al. Mesenchymal Bmp3b expression maintains skeletal muscle integrity and decreases in age‐related sarcopenia. J Clin Invest 2021;131:139617. [DOI] [PMC free article] [PubMed] [Google Scholar]
- 20. Mozzetta C, Consalvi S, Saccone V, Tierney M, Diamantini A, Mitchell KJ, et al. Fibroadipogenic progenitors mediate the ability of HDAC inhibitors to promote regeneration in dystrophic muscles of young, but not old Mdx mice. EMBO Mol Med 2013;5:626–639. [DOI] [PMC free article] [PubMed] [Google Scholar]
- 21. Soliman H, Theret M, Scott W, Hill L, Underhill TM, Hinz B, et al. Multipotent stromal cells: one name, multiple identities. Cell Stem Cell 2021;28:1690–1707. [DOI] [PubMed] [Google Scholar]
- 22. Uezumi A, Ito T, Morikawa D, Shimizu N, Yoneda T, Segawa M, et al. Fibrosis and adipogenesis originate from a common mesenchymal progenitor in skeletal muscle. J Cell Sci 2011;124:3654–3664. [DOI] [PubMed] [Google Scholar]
- 23. Uezumi A, Fukada S, Yamamoto N, Ikemoto‐Uezumi M, Nakatani M, Morita M, et al. Identification and characterization of PDGFRα+ mesenchymal progenitors in human skeletal muscle. Cell Death Dis 2014;5:e1186. [DOI] [PMC free article] [PubMed] [Google Scholar]
- 24. Lemos DR, Babaeijandaghi F, Low M, Chang C‐K, Lee ST, Fiore D, et al. Nilotinib reduces muscle fibrosis in chronic muscle injury by promoting TNF‐mediated apoptosis of fibro/adipogenic progenitors. Nat Med 2015;21:786–794. [DOI] [PubMed] [Google Scholar]
- 25. Kallenbach JG, Bachman JF, Paris ND, Blanc RS, O'Connor T, Furati E, et al. Muscle‐specific functional deficits and lifelong fibrosis in response to paediatric radiotherapy and tumour elimination. J Cachexia Sarcopenia Muscle 2022;13:296–310. [DOI] [PMC free article] [PubMed] [Google Scholar]
- 26. Hardee JP, Puppa MJ, Fix DK, Gao S, Hetzler KL, Bateman TA, et al. The effect of radiation dose on mouse skeletal muscle remodeling. Radiol Oncol 2014;48:247–256. [DOI] [PMC free article] [PubMed] [Google Scholar]
- 27. Roubos S, D'Souza D, Hernández‐Saavedra D, Xu G, Collao N, Emmons R, et al. Weight loss with exercise improves muscle architecture and progenitor cell populations compared with weight loss alone in mice with preneoplastic colorectal lesions. Appl Physiol Nutr Metab 2021;46:837–845. [DOI] [PubMed] [Google Scholar]
- 28. Collao N, Akohene‐Mensah P, Nallabelli J, Binet ER, Askarian A, Lloyd J, et al. The role of L‐type amino acid transporter 1 (Slc7a5) during in vitro myogenesis. Am J Physiol Cell Physiol 2022;323:C595–C605. [DOI] [PubMed] [Google Scholar]
- 29. Cadete VJJ, Deschênes S, Cuillerier A, Brisebois F, Sugiura A, Vincent A, et al. Formation of mitochondrial‐derived vesicles is an active and physiologically relevant mitochondrial quality control process in the cardiac system. J Physiol 2016;594:5343–5362. [DOI] [PMC free article] [PubMed] [Google Scholar]
- 30. AlSudais H, Rajgara R, Saleh A, Wiper‐Bergeron N. C/EBPβ promotes the expression of atrophy‐inducing factors by tumours and is a central regulator of cancer cachexia. J Cachexia Sarcopenia Muscle 2022;13:743–757. [DOI] [PMC free article] [PubMed] [Google Scholar]
- 31. Madaro L, Passafaro M, Sala D, Etxaniz U, Lugarini F, Proietti D, et al. Denervation‐activated STAT3‐IL‐6 signalling in fibro‐adipogenic progenitors promotes myofibres atrophy and fibrosis. Nat Cell Biol 2018;20:917–927. [DOI] [PMC free article] [PubMed] [Google Scholar]
- 32. Reggio A, Rosina M, Krahmer N, Palma A, Petrilli LL, Maiolatesi G, et al. Metabolic reprogramming of fibro/adipogenic progenitors facilitates muscle regeneration. Life Sci Alliance 2020;3:e202000646. [DOI] [PMC free article] [PubMed] [Google Scholar]
- 33. Farup J, Just J, de Paoli F, Lin L, Jensen JB, Billeskov T, et al. Human skeletal muscle CD90+ fibro‐adipogenic progenitors are associated with muscle degeneration in type 2 diabetic patients. Cell Metab 2021;33:2201–2214.e11. [DOI] [PMC free article] [PubMed] [Google Scholar]
- 34. Guido C, Whitaker‐Menezes D, Lin Z, Pestell RG, Howell A, Zimmers TA, et al. Mitochondrial fission induces glycolytic reprogramming in cancer‐associated myofibroblasts, driving stromal lactate production, and early tumor growth. Oncotarget 2012;3:798–810. [DOI] [PMC free article] [PubMed] [Google Scholar]
- 35. Contreras O, Cruz‐Soca M, Theret M, Soliman H, Tung LW, Groppa E, et al. Cross‐talk between TGF‐β and PDGFRα signaling pathways regulates the fate of stromal fibro‐adipogenic progenitors. J Cell Sci 2019;132:jcs232157. [DOI] [PubMed] [Google Scholar]
- 36. Yao L, Rathnakar BH, Kwon HR, Sakashita H, Kim JH, Rackley A, et al. Temporal control of PDGFRα regulates the fibroblast‐to‐myofibroblast transition in wound healing. Cell Rep 2022;40:111192. [DOI] [PMC free article] [PubMed] [Google Scholar]
- 37. Moiseeva V, Cisneros A, Sica V, Deryagin O, Lai Y, Jung S, et al. Senescence atlas reveals an aged‐like inflamed niche that blunts muscle regeneration. Nature 2023;613:169–178. [DOI] [PMC free article] [PubMed] [Google Scholar]
- 38. Zhang X, Habiballa L, Aversa Z, Ng YE, Sakamoto AE, Englund DA, et al. Characterization of cellular senescence in aging skeletal muscle. Nat Aging 2022;2:601–615. [DOI] [PMC free article] [PubMed] [Google Scholar]
- 39. Collao N, Farup J, De Lisio M. Role of metabolic stress and exercise in regulating fibro/adipogenic progenitors. Front Cell Dev Biol 2020;8:9. [DOI] [PMC free article] [PubMed] [Google Scholar]
- 40. Wright LE, Buijs JT, Kim H‐S, Coats LE, Scheidler AM, John SK, et al. Single‐limb irradiation induces local and systemic bone loss in a murine model. J Bone Miner Res 2015;30:1268–1279. [DOI] [PMC free article] [PubMed] [Google Scholar]
Associated Data
This section collects any data citations, data availability statements, or supplementary materials included in this article.
Supplementary Materials
Figure S1. Changes in mice body weight, and no changes in muscle fibre number and myonuclei per fibre following radiation. (A) Body weight (g), (B) gas/sol weight per body weight (g/g), (C) number of muscle fibres at 56‐days post‐IR per cross‐section, and (D) number of myonuclei per fibre. One‐way ANOVA (A), and Paired Student's t‐test between CLTR and IR at each timepoint (B‐D). *p < 0.05 (n = 6–8).
Figure S2. Flow cytometer gating strategy (A) Flow cytometer gating strategy. (B) Fluorescence minus one (FMO) staining to establish gating strategy.
Figure S3. Radiation induces macrophage polarization, decreases vascular endothelial cells content, and reduces PDGFRα content. (A) Representative image of vascular endothelial cells. CD31+ cells (red), Dystrophin (green), and DAPI (blue). Scale bar 20 μm. Quantification of capillary to fibre ratio, and CD31+ cells per mm2. (B) Representative image of macrophages staining. F4/80+ cells (green), CD206+ cells (red), and DAPI (blue). Scale bar: 16 μm. Quantification of: Total macrophages (F4/80+) per μm2. ‘M1’ macrophages (F4/80+/CD206−) per μm2, and ‘M2’ macrophages (F4/80+/CD206+) per um2. *p < 0.05, Paired Student's t‐test between CLTR and IR at each timepoint (n = 3–8).
Figure S4. FAP, MuSC, and C3H/10T1/2 cell differentiation. (A) FACS gating strategy. (B) Representative images of FAPs expressing: PDGFRα (green), fibrogenic FAP differentiation expressing αSMA (orange), adipogenic FAP differentiation expressing Perilipin (red), and DAPI (blue), and MuSCs differentiation expressing MyHC (red), and DAPI (blue). (C) Representative images of C3H/10T1/2 cells expressing: PDGFRα (green), fibrogenic differentiation αSMA (orange), adipogenic differentiation Perilipin (red), and DAPI (blue). Scale bar: 20 μm.
Figure S5. No changes in mitochondrial biogenesis followed in vitro radiation. (A) MitoTracker Green Fluorescence Intensity normalized by Hoechst Fluorescence Intensity. (B) Mitochondrial DNA to nuclear DNA (mtDNA/nDNA) ratio.
Figure S6. Total number of Nuclei is not altered by radiation and no changes in myotube diameter is found when condition media from IR‐FAPs is applied. (A) Total number of nuclei per field (B) Representative brightfield image of myotube formation used to quantify myotube diameter (μm). Scale bar: 100 μm. Unpaired Student's t‐test. (n = 5–6).
Data S1. Supporting Information.
Data S2. Supporting Information.