

Summary
The mechanism by which a bacterial cell senses external nutrients remains largely unknown. In this study, we identified a bacterial cell sensing system for polycyclic aromatic hydrocarbons (PAHs) in a common marine PAH-using bacterium, Cycloclasticus. It consists of an outer membrane receptor (PahS) and a periplasmic protein (PahP) in combination with a two-component sensing system (TCS) that ensures a rapid response to PAH occurrence by directly controlling serial reactions including chemotactic sensing and movement, PAH uptake and intracellular PAH metabolism. PahS protrudes from the cell and acts as a PAH sensor, transducing the PAH signal across the outer membrane to its periplasmic partner PahP, which in turn transduces the PAH signal across the periplasm to a specialized TCS. This sensing system plays a critical role in sensing and promoting the metabolism of PAHs, which can be scavenged by various hydrocarbon-degrading bacteria.
Subject areas: Microbiology, Applied microbiology, Cell biology
Graphical abstract
Highlights
-
•
A bacterial cell sensing system for PAHs, which is composed of PahS/PahP/PahK/PahR
-
•
The signaling pathway as follows: PAH → PahS/P → PahP-PAH → TCS → metabolic processes
-
•
PAHs acting as the chemical signal is captured by the outer membrane receptor PahS
-
•
Receiving PAH, PahP is detached from PahS, and transmits the PAH signal to the PahK
Microbiology; Applied microbiology; Cell biology
Introduction
Bacteria can sense a vast range of environmental signals, from the concentrations of nutrients and toxins to oxygen levels, pH, osmolarity, and light levels,1 even cell density, host, and beyond.2,3 Organic compounds are growth nutrients for diverse prokaryotes, which can be utilized as carbon and energy sources. Foraging organic nutrients is an essential trait of a heterotroph. Although heterotrophic bacteria are ubiquitous in the global ecosystem and play an important role, there is still a lack of knowledge about their cell sensing and signaling pathway potential mechanisms. As we know, the cells of Gram-negative (G—) bacteria are enveloped with an outer membrane (OM) in addition to the inner membrane, and a thick layer of periplasm lays between the two cell membranes. Thus, the chemoreceptors of the sensory systems located in the cytoplasmic membrane only receive the chemo effectors in the periplasm, such as the MCP-complex represented TCS.4,5,6
Polycyclic aromatic hydrocarbons (PAHs) are a well-known class of organic compounds widespread in global environments.7,8 As carbon and energy sources, PAHs can be utilized by diverse prokaryotes in global ecosystems.9,10,11 Recently, Integrated Ocean Drilling Program (IODP) drilling on Southwest Indian Ridge revealed the existence of PAHs and the predominance of PAH-utilizing bacteria in the deep biosphere of the oceanic crust therein.12 PAHs also provide carbon and energy sources for the myriads of commensal microbes inhabiting man’s every surface and gut.13,14 In addition, PAHs also can be transformed by eukaryotic cells and generate metabolites of potential hazards.15 The interaction of duplex effects between cell and PAH is considered to have occurred for long in nature. PAHs may be recognized by both prokaryotic and eukaryotic cells, either as a chemical attractant or a repellent. The initial response of a cell to PAH exposure, either as a toxic compound or as a growth substrate, is to perceive its presence at its early occurrence.
Cycloclasticus is known as one of the most important PAH-degrading bacterial genus in the marine environment, and bacteria of this group are globally distributed and obligate in PAH degradation.16,17,18,19 Recently, we characterized the key factors involved in PAH intracellular sensing, signal transduction, and regulation of different PAH degradation pathways in a deep-sea isolate of Cycloclasticus.20 Inside the cell, PAHs specially bind to a diguanylate cyclase (DGC), thereby leading to the generation of cyclic dimeric GMP (c-di-GMP), which subsequently binds to the two regulators of the CRP/FNR family and activates the transcriptional regulators required to initiate the expression of the pyrene degradation pathway and phenanthrene/naphthalene pathway, respectively.20
By far, how a cell perceives the external PAH remains unclear. In this report, we aimed to answer how a cell senses external PAHs. Insights into bacterial external PAH sensing will expand our knowledge on cell chemotaxis and uptake of growth substrates, and on cell surface sensing (CSS) and signaling, which remain extremely insufficiently explored.
Results
PahS, an outer membrane protein functioning as a molecular sensor of PAHs
To identify the genes involved in PAH sensing, a transposon-mediated random mutation library of strain Cycloclasticus sp. P1 was constructed, as previously described.20 Screening the mutants disabled or abnormal in PAH metabolism revealed a series of genes involved in PAH utilization. Gene complementation confirmed that the deficiencies in PAH metabolism of the mutants were not caused by polar effects on the genes downstream of the corresponding interrupted genes (Figure S1). Among these mutants, one named strain PASP1 failed to utilize any tested PAHs, as a transposon insertion led to disruption of a gene orf Q91_0827, subsequently named as pahS. This was annotated as a TonB-dependent receptor (TBDR) protein of 687 amino acids in length with unknown function.
To confirm the potential role of PahS in PAH signal transduction, its binding ability to PAHs was examined using surface plasmon resonance (SPR) with five kinds of PAHs. The KD values at 20°C were calculated to be 1.46 × 10⁻⁸, 2.14 × 10⁻⁸, 2.11 × 10⁻⁸, 1.79 × 10⁻⁷, and 2.17 × 10⁻⁸ M for naphthalene, phenanthrene, pyrene, fluorene, and anthracene, respectively (Figure 1A). These results confirmed that PahS is a PAH-binding protein in the outer membrane possessing high affinity to different PAHs, such as naphthalene, phenanthrene, and pyrene.
Figure 1.

Measurement by SPR analysis of the affinity constants of PahS for PAHs (A), of PahS for PahP or PahK, and of PahK for PahP or PahR (B)
(A) PahS-specific binding with different PAHs. Representative SPR sensorgrams were recorded after injection of different concentrations of naphthalene, phenanthrene, pyrene, fluorene, and anthracene in a PahS sensor chip.
(B) Representative SPR sensorgrams were recorded after injection of different concentrations of PahS and PahK in PahP, PahR, and PahK sensor chips. PahS-PahP, PahS-PahK, and PahS-PahR stand for using the PahP, PahK, and PahR sensor chips, respectively, and injection of different concentrations of PahS, PahK-PahP, and PahK-PahR stand for using the PahP and PahR sensor chips, respectively, and injection of different concentrations of PahK. The affinity constant KD values were calculated by global fitting using a steady-state affinity model. Data in (A) and (B) are representative of three independent experiments.
PAH-binding structure modeling of PahS
To determine the mechanism of PAHs binding, the theoretical structure of PahS was solved by homology modeling using RoseTTAFold,21 and the results showed that PahS possesses a classical TBDR-fold consisting of an N-terminal plug domain surrounded by a 22-stranded transmembrane β-barrel. However, the similarity of PahS to other TBDRs was only limited to this transmembrane region; the extracellular loops, which occupied approximately 40% of the polypeptide chain, were highly divergent from any previously described protein structures (Figure 2A). These loops largely consisted of β-sheet and non-regular secondary structure elements in addition to three small helical regions (Figure 2A). Therefore, it is necessary to determine the structure of PahS protein in the future.
Figure 2.

Modeling of PAH interactions with PahS and PahP by Discovery Studio 2019
(A) 2D (upper right) and 3D (left) models of PahS interactions with pyrene.
(B) 2D (upper right) and 3D (left) models of PahP interactions with pyrene.
To gain insights into the interactions between PAHs and PahS, the binding models were established by Discovery Studio 2019 (see STAR Methods). With regard to pyrene, the PAH molecule is positioned directly over the pore of the PahS barrel and has extensive interactions with the β-wall formed by extracellular loops of PahS (Figure 2A). Pyrene is accommodated well into PahS via three conventional hydrogen bonds between the benzene ring and Leu370 (distance = 5.83 Å), Leu444 (distance = 5.64 Å), and Ala452 (distance = 5.83 Å) (Figure 2A).
To reconfirm this binding model, site mutations were introduced into PahS at Leu370‒Ala370, Leu444‒Ala444, and Ala452‒Gly452, resulting in three mutated proteins. Then, the binding affinity of the mutants for naphthalene, phenanthrene, pyrene, fluorene, and anthracene was examined using SPR. The KD values of the mutated proteins with different PAHs ranged from 10−3 to 10−4 M (Figure S2), which was significantly higher than that of wild-type PahS (Figure 1). This confirmed that the extracellular loops of PahS play an essential role in binding and recognition of PAH substrates. These results support that PahS functions as a PAH receptor in the outer membrane.
Downstream of pahS, there were two genes encoding a hypothetical substrate-binding periplasmic protein and a histidine kinase, named respectively PahP and PahK. They formed a gene cluster with pahS, as illustrated in Figure S3A. All three were transcribed constitutively, regardless of the presence or absence of PAHs (SRR926181, SRR926183, SRR926186, and SRR926223).20
To pull down the potential components interacting with PahS, we screened for the proteins in association with PahS by co-immunoprecipitation (CoIP) using a Flag immunoprecipitation kit (Sigma). With PahS as bait in the form of PahS-3×Flag, potential partners in the match were hooked from the total proteins of strain P1 cells. Three proteins were pulled down that were named PahP (Q91_0826), PahK (Q91_0825), and PahR (Q91_ 1137) with predicted sizes of 318, 771, and 215 amino acids, respectively. They clustered as partners of PahS, as indicated by high interaction scores in CoIP tests (Table S1). To reconfirm their association, we used PahK as the bait to fish for its partners. In a CoIP assay with PahK-3×Flag, the other three proteins PahR, PahS, and PahP were co-purified and vice versa (Table S2). This confirms that they did constitute a four-component complex.
To disentangle their connections and to construct a possible assembly model, the binding affinity of PahS with PahP, PahK, and PahR was examined by surface plasmon resonance (SPR) analyses. SPR results showed that PahS possessed high binding affinity to PahP with KD values of 9.2 × 10⁻⁸ M, while the affinity was substantially lower to PahR and PahK, with a KD value of 1.19 × 10⁻⁴ M and 1.74 × 10⁻⁴ M, respectively (Figure 1B). In contrast, PahK showed a high affinity with both PahP and PahR, with KD values of 9.8 × 10⁻⁹ and 1.89 × 10⁻⁸ M, respectively (Figure 1B). We also employed the bacterial adenylate cyclase-based two-hybrid system (BACTH). As expected, the coexpression of PahS and PahP, PahK and PahR, and PahK and PahP to T18 and T25 (see STAR Methods), resulted in the formation of blue colonies on X-Gal/IPTG medium, indicating positive interactions between PahS and PahP, PahK and PahR, and PahK and PahP. The strong β-galactosidase activity, approximately 10- to 20-fold compared to that of the negative control (p < 0.0001), was detected between the PahS and PahP, PahK and PahR, PahK and PahP (Figure S4). These data support the suggestion that PahS only directly binds with PahP, while PahK directly binds with both PahP and PahR, and PahK/PahR may constitute a subset two-component system delivering PAH signals across the inner membrane to the cytoplasm.
PahP, a novel periplasmic substrate-binding protein for PAHs
Disruption of the gene pahP (orf Q91_0826) totally abolished the ability of strain P1 to utilize any PAH, as tested with the mutant strain (named PAPP1) screened from the transposon insertion library. As mentioned above, the gene was annotated as encoding a putative periplasmic substrate-binding protein.20 To evaluate its interaction with PAHs, PahP was expressed in a heterologous host and purified, and its PAH binding affinity was further examined. SPR analyses results confirmed that PahP could bind all tested PAHs, including naphthalene, phenanthrene, pyrene, fluorene, and anthracene, with KD values of 0.53 × 10⁻⁸ M, 1.96 × 10⁻⁸ M, 1.44 × 10⁻⁸ M, 1.74 × 10⁻⁸ M, and 4.1 × 10⁻⁸ M, respectively (Figure 3). These results corroborate that PahP is a substrate-binding protein for PAHs.
Figure 3.

Measurement of affinity constants of PahP with five PAHs by SPR analysis
Representative SPR sensorgrams were recorded after injection of different concentrations of naphthalene, phenanthrene, pyrene, fluorene, and anthracene in a PahP sensor chip. The affinity constant K D values were calculated by global fitting using a steady-state affinity model. Data are representative of three independent experiments.
To gain insights into the mechanism of PAH recognition by PahP, we solved the theoretical structure of PahP by homology modeling. PahP has a classic substrate-binding protein fold,22 with two a/b domains connected via a three-stranded hinge (Figure 2B). The binding mode of interaction of PAH and PahP was analyzed with a software of Discovery Studio 2019; the results indicated that pyrene is positioned in a hydrophobic pocket surrounded by residues Tyr-42, Leu-135, Ala-210, Tyr-215, Phe-237, and Leu-254 (Figure 2B). To reconfirm the binding predicted by the above models, these four amino acids were substituted, respectively, as Tyr42‒Gly42, Leu135‒Ala135, Tyr-215‒Ala215, and Leu-254‒Ala254. Their binding ability to all tested PAHs (naphthalene, phenanthrene, pyrene, fluorine, and anthracene) significantly decreased compared to the wild-type PahP, with PAH binding affinity KD values ranging from 10−3 to 10−4 M as determined using SPR and binding to five kinds of PAHs (Figure S5).
PAH influenced the binding affinity of PahP with PahS and PahK in vitro
In strain P1, the mutant strain named PAKP1 failed to degrade any tested PAHs. It had the gene pahK (orf Q91_0825) disrupted, encoding a putative histidine kinase.20 In addition, another mutant named PARP1 also failed to grow with any of the tested PAHs; it had the gene orf Q91_1137 interrupted, annotated as a global regulator protein of GacA, and named pahR here.20 Previously, we also confirmed that PahK/PahR plays key roles in PAH signal transduction from the inner membrane to the cytoplasm as a two-component system (TCS).20
In the above CoIP experiments, PahP showed a significant binding affinity with PahS and PahK (Figure 1B; Tables S1 and S2). To examine whether PAHs could function as signal effectors to influence the binding within the four-component complex, the binding affinity of these proteins with each other was re-examined in the presence of pyrene/phenanthrene. Remarkably, in the presence of pyrene and phenanthrene (PahP binds PAH first), the binding affinity of PahP with PahS was lowered compared to that without PAH (Figure 4A); in contrast, when PahS bound either of the PAHs in advance, the binding affinity of PahS with PahP was enhanced, with KD values of 2.12 × 10⁻⁹ M (pyrene) and 2.97 × 10⁻⁹ M (phenanthrene), respectively (Figure 4B); i.e., the affinity was about 30–40 times that without PAH (Figures 1B, 4A, and 4B). Similarly, when PahP bound with either of the tested PAHs, its binding affinity to PahK was also enhanced (Figure 4C). In addition, PahK did not bind either PAH (Figure S6).
Figure 4.

PAH effects on the binding affinity of PahS with PahP (both A and B), and PahP with PahK (C)
Binding affinity constants by SPR analysis. The affinity constant KD values were calculated by global fitting using a steady-state affinity model. Data are representative of three independent experiments.
(A) Lowered PahP binding affinity for PahS when PahP binds pyrene or phenanthrene in advance. Representative SPR sensorgrams were recorded after the injection of different concentrations of PahP binding pyrene and phenanthrene in a PahS sensor chip.
(B) Enhancement of PahS binding affinity for PahP when PahS binds pyrene or phenanthrene in advance. Representative SPR sensorgrams were recorded after injection of different concentrations of PahS binding pyrene and phenanthrene in a PahP sensor chip.
(C) Enhancement of PahP binding affinity for PahK when PahP binds pyrene or phenanthrene. Representative SPR sensorgrams were recorded after injection of different concentrations of PahP binding phenanthrene or pyrene in a PahK sensor chip.
Localization of PahS and PahK in the cell envelopes was performed to further corroborate their involvement in PAH sensing and signal transmission from outside to inside the cell. Although the transmembrane structure implies that they are membrane proteins, we were unsure of their localization in the outer or inner membranes.
To clarify this uncertainty, inner and outer membrane extracts were prepared by sucrose gradient sedimentation and immunoblotted with anti-PahS and anti-PahK antisera. Total membranes from P1 cells obtained from an exponential culture were separated on a discontinuous sedimentation sucrose gradient (from 30% to 60%), and membrane fractions were collected from the bottom of the tube. Immunoblotting with anti-PahS and anti-PahK antisera of each fraction showed that PahS was detected in the high-density fractions containing 2-keto-3-deoxyoctonates (KDOs) (Figure 5), a component of the lipopolysaccharides used as markers of the outer membrane; most of the PahK protein co-precipitated with the NADH oxidase activity used as a marker of the inner membrane (Figure 5). These results demonstrate that PahS and PahK are associated with the outer and inner membranes, respectively.
Figure 5.

Subcellular localization of PahS and PahK in the outer and inner membranes of Cycloclasticus
(A) Subcellular localization of PahS and PahK by centrifugation separation. Total membranes from P1 cells obtained from an exponential culture grown on PAHs were separated on a discontinuous sedimentation sucrose gradient. Membrane fractions were collected from the bottom of the tube. The sucrose gradient (from 30% to 60%) is indicated above the graph. NADH oxidase activity (brown) and KDOs (black) were used as markers of the inner and outer membranes, respectively.
(B) Coimmunoprecipitation assays of membrane fractions with PahS and PahK. The immunoblotting assays were performed with anti-PahS or anti-PahK antisera on all fractions collected (F1 to F10) and on total membrane extract (TOT) loaded on the gradient. Data are representative of three independent experiments. Error bars represent the s.d.
PAH altered FRET between CFP-PahS and YFP-PahP, CFP-PahK and YFP-PahP, and CFP-PahK and YFP-PahR, respectively
Förster (fluorescence) resonance energy transfer (FRET), which relies on the distance- and orientation-dependent transfer of energy from an excited donor fluorophore to an acceptor fluorophore, has emerged as a powerful tool with which to study the function of bacterial signaling networks by monitoring protein–protein interactions in vivo. 23 To further investigate signal processing by the PAH-PahS/PahP/PahK/PahR pathway, we utilized genetically encoded PahS-PahP, PahP-PahK, and PahK-PahR FRET reporters, respectively. As shown below, these reporters provided direct readouts of PAHs-induced changes in the PahS/PahP/PahK/PahR signaling complex and thus of signaling activity within the cell. We measured FRET using acceptor photobleaching, where photoinactivation of the acceptor suppresses quenching of the fluorescence emitted by the donor, in proportion to the level of FRET observed prior to bleaching. This approach provided an absolute measure of the FRET efficiency, as the percentage change in donor fluorescence upon bleaching (see “STAR Methods”), which facilitates direct data comparisons across experiments.
For the FRET reporter strain, an increase or decrease in CFP fluorescence indicative of FRET was observed upon bleaching of the acceptor. The FRET efficiency in PAH- unstimulated PahS-PahP reporter in wild-type cells of strain P1 was (19.7 ± 1.6) %, while the FRET efficiency in PAH-stimulated above cells significantly decreased to (4.6 ± 0.6) %, (4.9 ± 0.4) % and (5.3 ± 0.7) %, respectively (Figure 6A). In contrast, the FRET efficiency in PAH-unstimulated PahK-PahP and PahK-PahR reporter cells was only (3.9 ± 0.2) % and (5.2 ± 0.8) %, respectively; but in PAHs stimulated cells the FRET efficiency increased to (16.7–21.4 ± 1.1–1.9) % (Figure 6A). In contrast, no change was observed in FRET efficiency in mutant strain PASP1 (PahS-) and PAPP1 (PahP-) regardless of PAHs present or not (Figure 6B), and also no change was observed in a negative control expressing free cytoplasmic monomeric YFP and CFP in strain P1 (Figure 6).
Figure 6.

FRET assay used to study PAH signaling processing in Cycloclasticus sp. P1
(A) Barplot of FRET efficiencies derived from PAHs stimulation experiments in wild-type P1 cell from left to the right: an FRET-negative control (NC), PahS-PahP reporter cells, PahP-PahK reporter cells, and PahK-PahR reporter cells.
(B) Barplot of FRET efficiencies derived from PAHs stimulation experiments in mutant P1 cell from left to the right: an FRET-negative control (NC), PahK-PahP and PahK-PahR reporter cells in mutant strain PASP1(PahS−), and PahK-PahR reporter cells in mutant strain PAPP1(PahP−). Data are representative of three independent experiments. Error bars: mean ± SD. Nap, naphthalene; Phe, phenanthrene; Pyr, pyrene; NaAc, sodium acetate (non-PAH treatment); NC, negative control group (expressing free cytoplasmic monomeric YFP and CFP).  : unpaired t-test, p < 0.001.
Together, both SPR and FRET data support that PahP acts as a signal transducer of PAH by contacting the outer membrane protein PahS to the inner membrane kinase PahK. All tested PAHs of two four rings can function as a ligand of PahP and exert influence on the binding affinity of PahS and PahP. Upon binding of PahP to a PHA-bound PahS molecule, the PHA will be transferred to PhaP which will then tightly dock to PahK. In this process, PAH is merely a signal effector rather than a growth substrate as further confirmed below.
Genes regulated by PahR as revealed by chromatin immunoprecipitation and nucleotide sequencing (ChIP-seq)
To observe the intracellular responses to the presence of PAHs outside the cell via the regulation of PahR, the genes under the regulation of PahR were identified. The DNA-binding sites of PahR in the genome were determined by ChIP-seq. A total of 127 binding peaks spanning 33 genomic regions were detected and 14 peaks were located in the promoter regions of genes potentially under PahR regulation (Table S3).
To determine the DNA-binding motif of PahR, we analyzed sequences extending 150 bp to each side of the 127 peak summits using the MEME algorithm.24 An asymmetric 19-bp consensus sequence was found, characterized by a 4-bp GC-rich region flanked by 7 bp- and 3 bp-long sequences with a predominance of A and T, a 2-bp GC-rich region, and a 2-bp AT-rich region (Figure S9), confirming that all the target genes are virtually under the regulation of PahR.
To reconfirm PahR-targeted transcriptional sites in the genome, the interactions of PahR with the predicted promoter regions of the genes involved in PAH degradation and chemotaxis were examined by SPR analysis (STAR Methods are described in supplemental information). The DNA fragments were captured onto an SPR sensor chip, and different concentrations of PahR were injected over the surface (see “STAR Methods”). All of the sensorgrams revealed high-affinity binding of PahR to the 14 promoters as revealed by Chip-seq (Figures S10 and S11). Notably, PahR showed the highest affinity for the promoters of dpr-1 (PQ91_0868), dpr-2 (PQ91_2232), and dgc (PQ91_0546), with KD values of 1.88 × 10⁻⁹ M, 3.13 × 10⁻⁹ M, and 2 × 10⁻⁹ M, respectively.
Q-RT-PCR quantification results reconfirmed that they were the regulation targets of PahR, as all the above genes obtained by Chip-seq were upregulated in response to PAHs (Figure S12A). However, when pahR was interrupted, the expression levels of these genes were significantly repressed in the pahR-negative mutant (Figure S12B).
The targeted genes revealed by Chip-seq included ompT (PQ91_2250/2251), cshK (PQ91_1119/1120), dgc (PQ91_0546), flrA (PQ91_0713), fur (PQ91_1464), csrA (PQ91_0863), dpr-1 (PQ91_0868), dpr-2 (PQ91_2232), dpr-3 (PQ91_0978), araC (PQ91_0498), iscR (PQ91_1049), tetR-1 (PQ91_1194), tetR-2 (PQ91_1231) and lysR (PQ91_1482). These loci encoded key proteins involved in PAH chemotaxis and uptake (discussed below and will be published separately), in addition to the recently identified intracellular sensing pathway for regulation of different PAH metabolic pathways.20
Retrieving the PAH signaling pathway constituted by pahS, pahP, pahK, and pahR in other bacteria
To explore whether such a signaling network exists in other PAH-degrading bacteria and to obtain insights into the ecophysiological roles of pahS, pahP, pahK, and pahR, their taxonomic distribution and their genetic organization were explored in bacterial genomes (criteria for positive hits were more than 45% identity and more than 80% of the query sequence aligned). These four genes occur concurrently in 74 species of bacteria for which the genome sequences are available in the IGM/M (Integrated Microbial Genomes & Microbiomes) database. These genomes belong to the following genera (Table S4), all of which are well-known hydrocarbon-degrading bacteria, including Cycloclasticus (20 genomes) of the order Thiotrichales, Alcanivorax (17 genomes), Halomonas (4 genomes), Oleiphilus (1 genome) and Oleispira (1 genome) of the order Oceanospirillales, Acinetobacter (8 genomes) and Pseudomonas (11 genomes) of the order Pseudomonadales, Erythrobacter (1 genome), Novosphingobium (4 genomes), and Sphingobium (3 genomes) of the order Sphingomonadale, Marinobacter (2 genomes) of the order Alteromonadales, and Pusillimonas (1 genome) of the order Burkholderiales. All of these strains have been isolated from hydrocarbon-contaminated environments, and 57 strains have been confirmed to use hydrocarbons as carbon sources.11,25,26 This CSS system might be the essence of hydrocarbonoclastic bacteria, facilitating the host to scavenge for hydrocarbons as carbon and energy sources in environments.
Discussion
The CSS system has been reported as a tripartite molecular device known as TonB-dependent machinery that allows G− bacteria to transduce an extracellular stimulus into a coordinated transcriptional response, a mechanism that was first reported in Pseudomonas.27,28,29,30 The CCS systems are reported to be responsible for bacterial iron uptake, biofilm formation, virulence, and cell-cell interactions such as in Vibrio and Pseudomonas.30,31,32 Typically, these CSS systems involve TonB-dependent signal processing and contain an extracytoplasmic function (ECF) sigma factor that initiates the expression of the stimulus-response gene(s).29,30,32,33,34,35 In this study, we characterized a cell surface sensory system for PAHs in Cycloclasticus. This machinery can be retrieved from other PAH-metabolizing bacteria.
This sensory system is a four-partite complex headed with a PAH receptor in the outer membrane, based on a traditional TCS and extends the receptor as a PAH sensor outside of the cell. In this signaling pathway, PahS functions as a PAH sensor to detect the signal molecule in the cell surroundings, signaling across the periplasm and cytomembrane, and integrating within the intracellular signaling pathway specialized for PAH, modulating the gene expression for chemotaxis and PAH uptake. This CSS from PAH is neither an analog for iron sensing and uptake in Pseudomonas species30 nor a chemotaxis complex.
To assure the direct and prompt response to the occurrence of the growth substrate PAH, the gene encoding the outer membrane receptor (PahS) is expressed constitutively. Structure prediction and docking modeling along with further site mutation revealed that PahS traps a PAH molecule through an extracellular structure formed by the outer loops atop a 22-stranded transmembrane β-barrel and passes it through the hydrophobic β-barrel that provides a conduit for PAH substrates to cross the outer membrane. Therefore, the PahS molecule extruding outside the cell membrane is the utmost sensor, pivotal to monitoring the external substrate ahead of all following cellular responses.
In this system, the periplasmic PahP functions as a signal conductor from the outer membrane to the inner membrane. PahP could bind all tested PAHs, including naphthalene, phenanthrene, pyrene, fluorene, and anthracene. Such a periplasmic protein was not included in the previously reported TonB-dependent transporters.36 This is the first periplasmic protein functioning in hydrophobic organic substrate signal delivery.
PahP bound with PAH can activate PahK. Without the occurrence of PAH, PahP binds to the receptor PahS, but once bound with a PAH molecule, PahS will transfer the PAH to PahP; the PahP-ligated PAH is then detached from the PahS/P complex. This was corroborated by the PAH-binding assay (Figures 4 and 5). The results point to the new role of a periplasmic substrate-binding protein in signal transduction from the outer membrane to the inner membrane. Previously, substrate binding protein (SBP) in periplasm resembling PahP in structure was originally found to be associated with prokaryotic ATP-binding cassette (ABC)-transporters,37 while PahP is the first example of SBPs in signaling pathways of prokaryotic cells.
On the inner membrane, PahK/PahR plays a key role in PAH signal transduction from the periplasm to the cytoplasm and controls the expression of a PAH metabolism network. Usually, the prototypical histidine kinase (HK) in two-component systems contains a periplasmic sensor domain in addition to a cytosolic autokinase domain linked by a transmembrane region.4,38 However, our histidine kinase PahK does not contain the periplasmic sensor domain, which reconfirms that PahK did not bind PAHs. Instead, PahP functioned as a periplasmic sensor domain by binding the signal ligand of PAH. Further study is needed on the interactions of PahP with PahK.
PahR can activate the expression of the CshK kinase, of an outer membrane OmpT transporter that presumably mediates PAH intake (unpublished results), as well as of the genes for PAH metabolization via a previously described intracellular PAH signaling pathway (Table S3; Figures S9–S12). Therefore, this surface signaling process acts as a chemical nose (“sensory organ”) for external PAHs, which forms a complete signaling system connected with a chemotactic sensory system and intracellular PAH signaling via a PAH-binding DGC, under the regulation of PahR. Worth to note, the PAH molecule transported via PahS is not used as a growth nutrient but merely as a signal molecule that is delivered from PahS to PahP, then from PahP to PahK, fulfilling the PAH signal delivery across the outer and inner membranes of a G— cell. All four components are constitutively expressed to assure prompt response to encounters with PAHs.
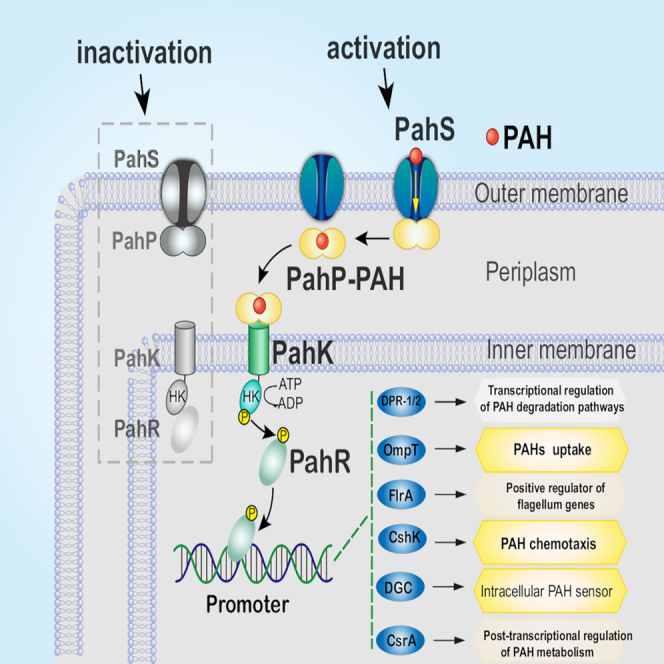
In summary, we revealed a cell surface sensory system (CSS) for external PAH, which is connected with the intracellular signaling pathway to modulate PAH oxidation and dictates a series of early responses of the cell (Figure 7). To fulfill the sensing and cross-membrane signal transduction from outside to inside, a molecule of PAH acting as the chemical signal is captured by the outer membrane receptor PahS with high affinity via its PAH-binding domain protruding outside the cell, then PahS transduces PAH cross the outer membrane to its partner PahP hanging at the periplasm side of PahS; once receiving PAH, PahP is detached from PahS, and transmits the PAH signal to the inner-membrane embedded receptor PahK, the histidine kinase of a specialized TCS, a chemoreceptor without sensor domain. All the components of this machinery (PahS/PahP/PahK/PahR) exhibit constitutive expression. The signaling pathway can summarize as follows: PAH → PahS-PahP → PahP-PAH → TCS → PAH metabolic processes, which connect with intracellular signaling pathways via PAH-activated DGC to generate the secondary messenger cyclic-di-GMP and modulate PAH degradation pathways.39,40 Altogether, this study provides the first example of a cell surface signaling pathway for external PAHs acquired as organic growth substrates.
Figure 7.

The PAH sensing and signaling pathway in Cycloclasticus
PahS is the receptor sensor of PAHs in the outer membrane. When PAHs are absent in the environment, PahS forms a two-component complex with PahP with high affinity. They constitute a cell surface sensory system (CSS) with a specialized two-component system (TCS). In the presence of PAHs, the system is activated by PAH binding to PahS. The signaling PAH molecule is transported through PahS to PahP, which then detaches from PahS, transverses the periplasm and binds tightly to PahK that is embedded in the inner membrane and triggers further signal transduction into the cytoplasm via PahR. PahR modulates multiple processes, including chemotaxis, PAH uptake, second-message-signaling pathways, etc.
Limitations of the study
Our results on the bacterial cell sensing and signaling pathway are limited to the mechanism by which a bacterial cell senses external PAHs. This sensing and signaling pathway is unlikely to represent the full range of mechanisms for bacterial external organics. Therefore, and subject to further testing, our results provide a useful model for the sensing of external nutrients by a bacterial cell. In addition, our PAH-binding structure modeling of PahS and PahP is necessarily probabilistic and does not have a true 3D spatial structure, which remains unknown and requires further testing.
STAR★Methods
Key resources table
| REAGENT or RESOURCE | SOURCE | IDENTIFIER |
|---|---|---|
| Antibodies | ||
| HRP antibody | Invitrogen | Cat#A10260 |
| His-tagged PahK | This study | N/A |
| His-tagged PahR | This study | N/A |
| anti-rabbit secondary antibody | Sigma-Aldrich | Cat#AP510 |
| Bacterial and virus strains | ||
| Cycloclasticus sp. P1 | This study | N/A |
| Escherichia coli BL21 | Sangong Biotech | Cat#B528419-0005 |
| Escherichia coli CC118(λpir) | de Lorenzo et al.41 | |
| Escherichia coli 101HB | de Lorenzo et al.41 | |
| Chemicals, peptides, and recombinant proteins | ||
| IPTG | Solarbio | Cat#I8070 |
| Tris-HCl buffer | Sigma-Aldrich | CAS#601185-53-1 |
| PMSF | Solarbio | Cat#P8340 |
| Sodium acetate | Xilong Scientfic | Cat#100283 |
| sodium acetate buffer | Xilong Scientfic | Cat#100283 |
| EDTA | Solarbio | CAS#60-00-4 |
| anti-Flag M2 resin | Sigma | Cat#A2220 |
| Sequencing Grade Modified Trypsin | Promega | Cat#V5111 |
| acetonitrile | Sigma-Aldrich | CAS#75-05-8 |
| TFA | Macklin | Cat#T822118 |
| Ni-nitrilotriacetic acid (NTA) agarose | Qiagen | Cat#30210 |
| EZ-view anti-FLAG agarose beads | Sigma | Cat#F2426 |
| PBS | solarbio | Cat#P1022 |
| KCl | Xilong Scientfic | Cat#100076 |
| MgCl2 | Xilong Scientfic | Cat#100077 |
| (γ- 33 P) ATP | Perkin Elmer | Cat#NEG302H001MC |
| lysozyme | Sigma-Aldrich | CAS#12650-88-3 |
| RNase | Sigma-Aldrich | CAS#9001-99-4 |
| DNase | Sigma-Aldrich | CAS#9003-98-9 |
| PrimeScript™ Reverse Transcriptase | Takara | Cat#2680Q |
| Ni2+-Chelating Sepharose Fast Flow column | Amersham Biosciences | Cat#17-0575-02 |
| C18 pre-concentration column | DIONEX | Cat#59149 |
| CM5 sensor chip | GE Healthcare | Cat#BR100530 |
| L1 sensor chip | GE Healthcare | Cat#BR100543 |
| SA sensor chip | GE Healthcare | Cat#BR100032 |
| 3×Flag peptide | Sigma | Cat#F4799 |
| PahS-3×Flag | This study | N/A |
| PahS | This study | N/A |
| PahP | This study | N/A |
| PahK | This study | N/A |
| PahR | This study | N/A |
| Critical commercial assays | ||
| Mem-PER Plus membrane protein extraction kit | Thermo Scientific | Cat#89842 |
| Flag immunoprecipitation kit | Sigma | Cat#FLAGIPT1 |
| The β-galactosidase activity | Gacek-Matthews et al.42 | N/A |
| RNeasy Mini Kit | Qiagen | Cat#74104 |
| ECL kit | GE Healthcare Pharmacia Biotech | Cat#RPN2232 |
| Experimental models: Organisms/strains | ||
| Strains:PASP1 | This study | N/A |
| Strains:PAPP1 | This study | N/A |
| Strains:pahR-3×Flag | This study | N/A |
| Strains:pahS-3×Flag, | This study | N/A |
| Strains:pahK-3×Flag | This study | N/A |
| Strains:region-3×Flag | This study | N/A |
| Strains used in complementation experiments,see Table S6 | This study | N/A |
| Random mutation library of strain Cycloclasticus sp. P1 | This study | N/A |
| Oligonucleotides | ||
| Primers used in this study, see Table S5 | This study | N/A |
| Recombinant DNA | ||
| Plasmid: pET28a (+) | Sigma-Aldrich | Cat#69864 |
| Plasmid: pET28a-pahS | This study | N/A |
| Plasmid: pET28a-pahP | This study | N/A |
| Plasmid: pET28a-pahK | This study | N/A |
| Plasmid: pET28a-pahR | This study | N/A |
| Plasmid: pET-3×Flag | This study | N/A |
| Plasmid: pET-3×Flag-1 | This study | N/A |
| Plasmid: pET-3×Flag-2 | This study | N/A |
| Plasmid: pET- eCFP | This study | N/A |
| Plasmid: pET-eYFP | This study | N/A |
| Plasmid: pET-eCFP-PahS | This study | N/A |
| Plasmid: pET-eYFP-PahP | This study | N/A |
| Plasmid: pET-eCFP-PahK | This study | N/A |
| Plasmid: pET-eYFP-PahP | This study | N/A |
| Plasmid: pET-eYFP-PahR | This study | N/A |
| Plasmid: pKT25 | Euromedex | Cat#EUP-25C |
| Plasmid: pKNT25 | Euromedex | Cat#EUP-25C |
| Plasmid: pUT18 | Euromedex | Cat#EUP-18N |
| Plasmid: pUTC18C BACTH | Euromedex | Cat#EUP-18N |
| Plasmid: pUC18-mini-Tn7T-Gm | Choi et al.43 | |
| Plasmid: pTNS2 | Choi et al.43 | |
| Plasmid: pUC18-mini-Tn7T-PahS. | This study | N/A |
| Plasmid: pRK2013 | BioVector | ID#3574075 |
| Software and algorithms | ||
| Biacore T200 system | GE Healthcare, Sweden | |
| Biacore T200 evaluation 2.0 software | GE Healthcare | |
| Proteome Discoverer | ThermoScientific | |
| MASCOT | Matrix science | |
| Quantity One | Bio-Rad | |
Resource availability
Lead contact
Further information and requests for resources and reagents should be directed to and will be fulfilled by the lead contact, Wanpeng Wang (wangwanpeng@tio.org.cn).
Materials availability
Antibodies and strains were obtained from the commercial sources described in the STAR Methods key resources table. All material generated in this study are available from the lead contact upon request.
Experimental model and study participant details
Microbial strains and growth conditions
The Cycloclasticus sp. P1 strain was grown in ML medium until the stationary growth phase, and the cells were then centrifuged at 3,200 ×g at 4°C. The Escherichia coli donor (λ pir, pUT min-Tn5 Km) and helper (pRK2013) strains were grown overnight at 37°C in LB medium with kanamycin (25μg/ml), then washed with fresh LB medium and centrifuged at 3,200 ×g at 4°C.
Method details
Plasmid construction and protein expression
Construction of expression vector
DNA fragments of the pahS, pahK pahP, and pahR genes that encode the PahS, PahP, PahK, and PahR proteins, were amplified with primers containing the corresponding restriction sites (Table S5). The following PCR program was utilized for these assays: 95°C for 3 min, followed by 30 cycles of 95°C for 30 sec, 50°C–55°C for 50 sec, and 72°C for 2 min, with a final extension at 72°C for 5 min. The resulting PCR products were then cloned into pET28a (+).
Protein expression
E. coli BL21 cells expressing pET28a-pahS (pahP, pahK , or pahR) were grown in LB supplemented with 50 mg/ml streptomycin at 37°C with shaking at 150 rpm to approximately OD600 = 0.5. The expression of pahS (pahP, pahK, or pahR) was induced by the addition of 1 mM IPTG followed by incubation for 3 h at 37°C. The cells were collected via centrifugation at 10,000×g at 4°C for 2 min and were then washed with and resuspended in 50 mM Tris-HCl buffer (pH 7.5). For the expression of pahP or pahR cell, after the addition of phenylmethylsulfonyl fluoride (PMSF) and lysozyme (at final concentrations of 1 mM and 1 mg/ml, respectively), the cell suspension was incubated for 20 min at 4°C and then sonicated. For the expression of pahS or pahK cell extracts was obtained using Mem-PER Plus membrane protein extraction kit according to the procedure recommended by the manufacturer (Thermo Scientific™). Following treatment with RNase (10 mg/mL) and DNase (5 mg/mL) for 15 min on ice, cell extracts were obtained via centrifugation at 23,000×g for 20 min29 at 4°C. Protein purification was performed using a Ni2+-Chelating Sepharose Fast Flow column (Amersham Biosciences, Piscataway, NJ) according to the procedure recommended by the manufacturer (Qiagen).
SPR experiments
SPR experiments of PahS and PahP
The immobilization of PahS and PahP on the sensor surface was carried out as described previously(Si Chen, 2017). Briefly, PahP was diluted in 10 mM sodium acetate (pH 5.5) and immobilized by the amine coupling method on a CM5 sensor chip according to the manufacturer’s protocol. In addition, 30 μg/mL PahS in 10 mM sodium acetate buffer (pH 5.5) was covalently immobilized onto the L1 sensor chip(GE Healthcare) using a standard primary amine coupling procedure. Surface plasma resonance (SPR) measurements were performed on a Biacore T200 system (GE Healthcare, Sweden).
PAH compounds were diluted in running buffer PBS containing 5% DMSO to a concentration of 50 μM. The running buffer PBS containing 5% DMSO (no PAHs) served as a negative control. The PAHs were then injected to the PahP or PahS sensor surface for 120 s at a flow rate of 30 μL/min. Sensorgrams of these PAHs were recorded and analyzed. Analytes were injected through reference and active channels at a flow rate of 30 μL/min. The association and dissociation times were both 120 s. The affinity fitting was carried out by Biacore T200 evaluation software using a 1:1 binding mode to obtain the affinity constant Kd.
The binding between PahS or PahK and PahP was examined using Biacore30 instrumentation. Experiments were performed on CM5 or L1 sensor chips at 25°C using filtered (0.2 mm) and degassed running buffer (50 mM HEPES pH 7.4, 150 mM NaCl, 0.05%[v/v] Tween 20 [Calbiochem]). PahP was dialyzed against the running buffer prior to SPR experiments. Same as above, 30–35 μg/mL PahS or PahK in 10 mM sodium acetate buffer (pH 5.5) was covalently immobilized onto the CM5 or L1 sensor chip. To measure PAHs binding to PahP bound to PahS or PahK, binding assays were conducted in the presence of a siderophore, and a 10-fold molar excess of PAHs was added to PahP and incubated for 30–60 min at room temperature. The PahP or PahP without the PAHs ligand was diluted in running buffer and captured at 20 mL/min (40-sec injections) over the immobilized PahS or PahK surfaces.
SPR experiments in PahK and PahR
Binding interactions between PahK and PahR were also examined using Biacore instrumentation. Experiments were performed on CM5 sensor chips at 25°C using filtered (0.2 mm) and degassed running buffer (50 mM HEPES pH 7.4, 150 mM NaCl, 0.05%[v/v] Tween 20 [Calbiochem]). PahK was diluted in 10 mM sodium acetate (pH 5.5) and immobilized by the amine coupling method on a CM5 sensor chip according to the manufacturer’s protocol. PahR was dialyzed against the running buffer prior to SPR experiments. PahR was then injected onto the PahK sensor surface for 120 s at a flow rate of 30 μL/min.
In addition, binding interactions between PahR and DNA fragments of the promoters were examined. The 50 μg/mL PahR in 10 mM sodium acetate buffer (pH 5.5) was covalently immobilized onto the CM5 sensor chip (GE Healthcare) using a standard primary amine coupling procedure. The experiments were carried out in running buffer composed of 20 mM Tris-HCl, 150 mM NaCl, and 0.005% Tween 20 (pH 7.0), using a Biacore T200 instrument (Biacore, GE Healthcare) at 25°C and a flow rate of 30 uL/min. The 5’-biotinylated double-stranded DNA fragments of the promoters of araC(PQ91_0498), dgc(PQ91_0546), flrA(PQ91_0713), csrA(PQ91_0863), dpr-1(PQ91_0868), dpr-3(PQ91_0978), iscR(PQ91_1049), cshK(PQ91_1119/1120), tetR-1(PQ91_1194), tetR-2(PQ91_1231), fur(PQ91_1464), lysR(PQ91_1482), dpr-2(PQ91_2232) and ompT (PQ91_2250/2251) were immobilized on an SA sensor chip (GE Healthcare) A DNA fragment of the Q91_1174 promoter was used as a negative control. The promoter sequences are shown in the supplemental note. At the end of each cycle, 0.05% sodium dodecyl sulfate was used to regenerate the surface of the sensor chip. The data were fit to the 1:1 binding model by using Biacore T200 evaluation 2.0 software (GE Healthcare).
Construction of 3×FLAG epitope-tagged proteins
Cycloclasticus sp. P1 genes were chromosomally tagged at their C-terminus by cloning constructs for C-terminal 3×FLAG epitope tagging on plasmids. The PahS, PahK, PahR, and PahP proteins were fused to a 3xFLAG epitope at their C-termini by cloning regions encoding approximately 500 bp of their C-terminal coding region (C-term, but no stop codon) and approximately 500 bp downstream of the stop codon into plasmid pET-3×Flag to flank a 3×FLAG tag and KanR cassette (see Figure S6 and supplemental note). Afterwards the above 3×FLAG-tag constructs plasmid (suicide vectors) were introduced into the chromosome of Cycloclasticus sp. P1 strain by electroporation and double-crossover homologous recombination. An example of this plasmid cloning strategy is described for PahS. Approximately 500 bp of the C-terminal coding region of the PahS without the stop codon or the region downstream of PahS stop codon were amplified from genomic DNA (gDNA) with primers PahS1f/PahS1r and PahS2f/PahS2r, respectively. These primers included BamHI/HidIII and XhoI/PstI sites, respectively. The upstream area of the C-terminal coding region of PahS without the stop codon PCR product was digested with BamHI and HidIII and ligated into a similarly digested pET-3×Flag backbone to create pET-3×Flag-1. Following this, the downstream region of the PahS stop codon PCR product was digested with XhoI and PstI and ligated into a similarly digested pET-3×Flag-1 backbone to create pET-3×Flag-2. Next, the entire integration cassette, including the C-terminal coding region of PahS (approximately 500 bp) without the stop codon, 3×FLAG-tag, and the downstream region of the PahS stop codon, was amplified by PCR with primers petf/petr from the backbone of pET-3×Flag-2 plasmid and electroporated into Cycloclasticus sp. P1. Mutants were confirmed by Western blot analysis with an anti-FLAG antibody and sequencing. The plasmid cloning strategies are described for PahK and PahP and the related primer sequences are listed in Table S5.
For electroporation, strains grown from frozen stocks on modified ML solid medium until the first or second passage were harvested into cold electroporation buffer (272 mM sucrose, 15% v/v glycerol) and washed twice with the same buffer. Cells (50 μL) were mixed with 200–400 ng PCR product on ice and electroporated (Biorad MicroPulser) in a 1 mm gap cuvette (PEQLAB) at 2.5 kV. Cells were then transferred with Brucella broth to a modified ML solid plate and recovered overnight at 37°C aerobically before plating on the appropriate selective medium.
FRET experiments
Cycloclasticus sp. P1 genes were chromosomally fluorescent protein-tagged at their C-terminus by cloning of constructs for C-terminal CFP or YFP tagging on plasmids. The PahS and PahK proteins were fused to a CFP epitope at their C-termini by cloning regions encoding approximately 600 bp of their C-terminal coding region (C-term, but no stop codon) and approximately 600 bp downstream of the start codon into plasmid pET- eCFP to flank a CFP tag and KanR cassette (see Figure S7 and supplemental note). The PahR and PahP proteins were fused to a YFP epitope at their C-termini by cloning regions encoding approximately 600 bp of their C-terminal coding region (C-term, but no stop codon) and approximately 600 bp downstream of the stop codon into plasmid pET-eYFP to flank an eYFP tag and KanR cassette (see Figure S8 and supplemental note). Afterwards, the pET-eCFP-PahS and pET-eYFP-PahP plasmid, pET-eCFP-PahK and pET-eYFP-PahP plasmid, pET-eCFP-PahK and pET-eYFP-PahR plasmids for suicide vector were introduced into the chromosome of Cycloclasticus sp. P1 strain by electroporation and double-crossover homologous recombination, respectively, and constructed three FRET reporters using CFP-PahS and PahP-YFP, CFP-PahK and PahP-YFP, and CFP-PahK and PahR-YFP in Cycloclasticus sp. P1 strain. Similarly, we also constructed a FRET reporter using CFP-PahK and PahP-YFP in mutant P1 strain (PASP1) that lacked the PahS genes and constructed a FRET reporter using CFP-PahK and PahR-YFP in mutant P1 strain (PAPP1) that lacked the PahP genes. In addition, in Cycloclasticus sp. P1 strain, the expressing free cytoplasmic monomeric YFP , and CFP were constructed for negative control.
An example of FRET reporter strain using CFP-PahS and PahP-YFP was described as follows. Approximately 600 bp of the N-terminal coding region of PahS without the start codon or the region downstream of PahS stop codon were amplified from genomic DNA (gDNA) with primers PahS3f/PahS3r and PahS4f/PahS4r, respectively. These primers included BamHI/HidIII and XhoI/PstI sites, respectively. The upstream of the N-terminal coding region of PahS without the start codon PCR product was digested with BamHI and HidIII and ligated into a similarly digested pET-CFP backbone to create pET-CFP. Following this, the downstream region of the PahS start codon PCR product was digested with XhoI and PstI and ligated into a similarly digested pET-CFP backbone to create pET-CFP-PahS. Similarly, the pET-YFP-PahP plasmid was also constructed. Next, pET-CFP-PahS and pET-YFP-PahP plasmid for suicide vector in succession was electroporated into Cycloclasticus sp. P1 and double-crossover homologous recombination. Fluorescent fusion proteins were detected with anti-GFP conjugated with HRP antibody (Invitrogen, Catalogue no. A10260, lot number 898225), and stability was assessed by western blotting.44 The other FRET reporter strains constructing strategies are similarly described and the related primer sequences are listed in Table S5.
Quantification and FRET acceptor-photobleaching experiments were performed as described by Babel et al. 46,47 Data acquisition from the PMTs was performed as described by Sourjik et al.23,46,47 The FRET efficiency was determined using the formula:45 FRET = (CFPpost -CFPpre)/ CFPpost ∗100%; where CFPpre and CFPpost denote the emission levels before and after acceptor photobleaching, respectively. Since CFP is continuously excited, CFP will also bleach during periods of acceptor photobleaching. We thus correct for donor photobleaching by performing a linear fit to the CFP trajectories prior to and after bleaching using the robust fit function in Mat lab 2017b.45 CFPpre is then evaluated at the end of the bleaching period by extrapolating the linear fit accordingly.45 Each measurement records the average fluorescence from hundreds of cells. Individual data points record the mean FRET from two technical replicates evaluated on the same gel pad. In each treatment, at least three biological replicates were set. Barplots report the corresponding means, and error bars depict the respective standard deviations.
Subcellular fractionation and membrane isolation
Cells were pelleted and membranes isolated as previously described.48,49 The mutants pahS-3×Flag, pahK-3×Flag , and wild-type P1strains were cultured in 200 ml of ASM medium (Liu and Shao, 2005) supplemented with 500 ppm PAHs for 5d (OD600 of 1.5) under 22°C. Bacteria were collected in 50-ml tubes and centrifuged at 4,000×g for 10 min at 4°C. Cell pellets were resuspended in 50 mL (10 mM Tris, 0.75 M sucrose, pH 7.5) followed by the addition of 100 mg/mL lysozyme and protease inhibitor cocktail (Roche), and 1.5 mM EDTA (pH 7.5) was then added drop-wise to a final concentration of 0.5 mM EDTA. Cells were disrupted by two passages through a French pressure cell at 15,000 psi, and cellular debris was removed by centrifugation. Membranes were collected (42,000 rpm, 1 h, Beckman Ti45 rotor) and resuspended in 25% (w/v) sucrose, 5 mM EDTA (pH 7.5), and fractionated on a six-step sucrose gradient (35:40:45:50:55:60% (w/v) sucrose in 5 mM EDTA, pH 7.5) by centrifugation (Beckman SW41 rotor, 35000 rpm, 42 h). Total membranes were collected with an ISCO density gradient fractionator. All of the steps were performed at 4°C, and total membranes were stored at −80°C.
Co-immunoprecipitation (CoIP)
For immunoprecipitations, purified membranes (approximately 800–1000 μg protein) were resuspended in ACA750 buffer (750 mM n-aminocaproic acid, 50 mM Bis-Tris, 0.5 mM Na2EDTA, pH 7.0) as previously described.48 Next, 40–60 μL of anti-Flag M2 resin (Sigma, catalog No. A2220) was added to the suspensions followed by incubation overnight with shaking at 4°C.
The suspensions were centrifuged, and the beads were resuspended in 500 μL of wash buffer (Flag immunoprecipitation kit; Sigma) and transferred to spin columns, followed by six washes in 500 μL of the same buffer. The samples were then incubated with a 150 ng/μL solution of 3×Flag peptide (Sigma; catalog no. F4799) in 100 μL of wash buffer at 4°C for 30 min with occasional gentle shaking. Proteins were collected by centrifugation at 8,200×g for 1 min at 4°C and analyzed by mass spectrometry. The wild-type P1 strain with intergenic coding region-3×Flag grown in the same conditions as the PahS-3×Flag and PahK-3×Flag strains were used as a negative control. The initial list of co-immunoprecipitated proteins was filtered by removing the proteins present in the negative controls. In two additional filtering steps, (i) all of the hits identified by fewer than three peptides were discarded, and (ii) only hits identified by at least two unique peptides were retained. The complete data set, including the low-scoring hits not present in the negative controls, is provided in the supplemental information (see Tables S1 and S2).
Mass spectrometry-based protein identification
Samples were digested by the addition of Sequencing Grade Modified Trypsin (Promega) and incubation at 37°C overnight according to the manufacturer’s protocols. Peptides were eluted by using 200 μl MeCN for 30 min in a sonic bath. Subsequently, the supernatant was transferred to a fresh tube; after evaporation of the solvent in a vacuum concentrator, the dry samples were dissolved in 25 μL 10% acetonitrile/0.1% TFA. The mass spectrometric analysis of the samples was performed using an Orbitrap Velos Pro mass spectrometer (Thermo Scientific). An Ultimate nano RSLC-HPLC system (Thermo Scientific) equipped with a home-made nano 1.8 μm C18 RP column was connected online to the mass spectrometer through a nanospray ion source. Depending on the sample concentration, 1–15 μL of the tryptic digest was usually injected onto a C18 pre-concentration column. Automated trapping and desalting of the sample were performed at a flow rate of 6 μL/min using water/0.05% formic acid as the solvent.
Separation of the tryptic peptides was achieved with water/0.045% formic acid (solvent A) and 80% acetonitrile/0.05% formic acid (solvent B) at a flow rate of 300 nL/min using the following gradient: holding 4% B for five minutes, followed by a linear gradient to 45% B within 30 minutes and linear increase to 95% solvent B in an additional 5 minutes. The column was connected to a stainless-steel nano emitter (ThermoScientific), and the eluent was sprayed directly towards the heated capillary of the mass spectrometer using a potential of 2300 V. A survey scan with a resolution of 60000 within the Orbitrap mass analyzer was combined with at least three data-dependent MS/MS scans with the dynamic exclusion for 30 s either using CID with the linear ion-trap or using HCD and orbitrap detection at a resolution of 7500.
Data analysis was performed using Proteome Discoverer (ThermoScientific) with SEQUEST and MASCOT (version 2.2; Matrix science) search engines using a user-defined database containing the sequence of the protein of interest.
Preparation of polyclonal antibodies against PahK and PahR
A DNA fragment encoding the PahK and PahR genes of Cycloclasticus sp. P1 was amplified by PCR using the corresponding primers (Table S5). The PCR product was cloned into a His 6 tag expression vector, pET28 (Invitrogen Life Technologies). The resulting His-tagged PahK and PahR were expressed in E. coli BL21(DE3), and the protein was purified by affinity chromatography according to the manufacturer’s procedure [Ni-nitrilotriacetic acid (NTA) agarose; Qiagen]. The purified PahK and PahR were used to immunize rabbits (Eurogentec).
In vitro phosphorylation assay
Autophosphorylation of histidine kinase PahKLN172 (0.4 mg/mL, 12.5 μM) was performed in 50 mM Tris–HCl (pH 8.0) containing 25 mM KCl, 5.0 mM MgCl2, and 10 mM ATP at 25°C for 0, 10, 20, and 30 min. An in vitro phosphorylation assay was carried out with a final volume of 25 μL of reaction buffer [50 mM Tris-HCl (pH 7.5), 50 mM KCl, 10 mM MgCl2, 10 μM (γ- 33 P) ATP (3000 Ci mmol −1)] containing histidine kinase PahK and response regulator PahR protein in equimolar concentrations (1 μM). The phosphorylation reaction was carried out for at least 10 min at room temperature. After the addition of sample buffer [60 mM Tris-HCl (pH 6.8), 10% glycerol, 2% SDS, 5% β-mercaptoethanol, 0.05% bromophenol blue], the reaction mixture was separated by SDS-PAGE. The gel was washed with 45% methanol–10% acetic acid and autoradiographed.
Analysis of PahK and PahR phosphorylation in vivo
Gel retardation of the phosphorylated forms of PahK and PahR was performed as described previously.50 Briefly, 1.5 × 10⁸ cells of Cycloclasticus sp. P1 were harvested by centrifugation, and the pellet was lysed with 12.7 μL of 1 M formic acid, solubilized by 5 μL of 4× SDS-PAGE loading buffer, and neutralized by 2.8 μL 5 N NaOH. The sample was loaded and run onto gels containing 35 μM Phos-tag™ acrylamide and 70 μM MnCl2. Then, 10 min washing with transfer buffer (25 mM Tris and 192 mM glycine) supplied with 1 mM EDTA followed by 10 min washing with transfer buffer without EDTA were performed before transferring the gels to nitrocellulose membranes using a Trans-Blot® TurboTM Blotting system (Bio-Rad) with a pre-programmed protocol (2.5 A, up to 25 V, 7 min). Western blotting against PahK and PahR was performed using standard protocols with the rabbit anti-PahK and anti-PahR polyclonal antibodies at a dilution of 1:1000 and anti-rabbit secondary antibody coupled to horseradish peroxidase at a dilution of 1:10000. Blots were imaged using a chemiluminescent detection (ECL kit, GE Healthcare Pharmacia Biotech).
Quantification of the phosphorylated PahK and PahR protein amounts
Phosphorylated PahK /PahR and unphosphorylated PahK /PahR were quantified by determination of the area intensity of each band with the software Quantity One (Bio-Rad) after detection by Western blotting. Quantification of phosphorylated PahK or PahR was expressed as the ratio of the phosphorylated PahK or PahR amount divided by the sum of the phosphorylated PahK or PahR and the unphosphorylated PahK or PahR amounts as described elsewhere.51
Membrane fractionation
Inner and outer membranes were separated using sucrose gradient centrifugation. In total, 1.5 × 10 11 cells growing exponentially (OD600 of approximately 0.8) on ASM plus 50 mM PAHs were harvested by centrifugation at 20,000×g for 15 min at 4°C, resuspended in 2 mL of lysis buffer (10 mM Tris-HCl, pH 7.4, 20% [vol/vol] sucrose, 10 μg/ml RNase A, 10 μg/mL DNase I, 8.6 mg/mL protease inhibitor cocktail), and lysed three times through an ice-chilled French press at 18,000 lb/in. Cell debris was removed by centrifugation at 15,000 ×g for 30 min at 4°C, and total membranes were harvested by ultracentrifugation at 100,000 ×g for 60 min at 4°C (rotor 18426; Kontron Instruments). The membrane pellet was resuspended in 500 μL of lysis buffer and loaded on the top of a discontinuous sucrose gradient consisting of 600 μL of 30%, 35%, 40%, 45%, 50%, 55%, and 60% (wt/vol) sucrose solutions prepared in 10 mM Tris-HCl, pH 7.4. The gradient was centrifuged at 90,000 ×g for 72 h at 4°C (rotor SW50.1; Beckman), and 400-μL fractions were collected from the bottom. Inner and outer membrane-containing fractions were identified by measuring NADH oxidase activity and KDO concentration, respectively.
NADH oxidase activity and KDOs assays
NADH oxidase activity was measured with 20 μL of each fraction diluted in 180 μL of Tris-HCl 50 mM pH 7.5, dithiothreitol 0.2 mM, and NADH 0.5 mM. Absorbance at 340 nm was recorded for 15 min at 25°C using a double beam spectrophotometer (UVIKON XL), and the values was converted into a concentration of NAD+ produced using ε NADH = 6,220 M −1. cm −1. KDOs assays were performed on 180 μL of each fraction according to the method described by Mounier et al.52,53
Molecule docking
Docking was carried out by CDOCKER protocol using Discovery software with default parameters. The binding site was chosen via the “receptor cavity” protocol based on the I-TASSER.54,55 Ligand binding sites analysis results. The molecule poses with the lowest CDOCKER energy value was selected for further analysis.
Bacterial two-hybrid system and β-galactosidase assay
The pahS, pahP, pahK , and pahR were amplified from strain P1 and cloned into pKT25, pKNT25, pUT18, and pUTC18C BACTH expression vectors (catalog no. EUK001; Euromedex, Souffelweyersheim, France). The respective plasmids were introduced into the E. coli BTH101 cya-deficient host strain by heat shock transformation. The procedure was based on the functional complementation of two subunits of the adenylate cyclase (T18 and T25) fused with the tested interacting partners as previously described.42,56 Respective combinations were co-transformed in E. coli BTH101 cells and plated on LB X-Gal/IPTG agar or LB IPTG for -galactosidase assay. The cells were incubated for 24 h at 30°C. Afterwards the cells were moved to room temperature (RT) for 20 h, transferred to 18°C, and incubated for 20 h. For the -galactosidase assay, the cells were harvested from the LB-IPTG plates and resuspended in 1 mLof Z buffer (10 mM KCl, 100 mM MgSO4, 0.27% β-mercaptoethanol, sodium phosphate buffer [pH 7.0]). The optical density at 600 nm (OD600) was adjusted to 0.5 to 0.7; cells were permeabilized using β-mercaptoethanol, SDS, and chloroform, and the enzymatic reaction (at 28°C) was induced by the addition of 4 mg/ml of o-nitrophenol-β-galactoside (ONPG) in sodium phosphate buffer. The time at which each sample turned yellow was recorded, and the reaction was stopped with 1MNa2CO3. OD420 and OD550 values were measured using a Spectrometer basic (Eppendorf, Hamburg, Germany). The β-galactosidase activity was determined according to the method of Miller42 and expressed in Miller units [MU]. The mean values of -galactosidase activity from each experiment were normalized by the mean value of the respective negative control (BTH101 cells co-expressing only T18 and T25 subunits of adenylate cyclase). Thus, the indicated positive interactions are expressed as fold change compared to the respective negative control.
Complementation experiments
The mini-Tn7 site-specific transposition system for gene complementation and expression was used as previously described43,57,58 with modifications. The pUC18-mini-Tn7T-Gm, pTNS2 helper plasmid and FLP recombinase expression vector pFLP3 have all been described previously.43,57,59,60 To construct the pUC18-mini-Tn7T-PahS expression vector, the pahS region was PCR-amplified from the P1 genome using primers Tn7-pahSf (5’- AAGGATCCATGAAACACCCTTATCTTGATGTTC) (the BamHI site is underlined) and Tn7-pahSr (5’- ATAAGCTTCAGGCACTCAGTAACTTGCGAAAT) (the HindIII site is underlined). The full-length pahS gene PCR fragment was cloned into pCR2.1 to create PahS. Next, a full-length pahSBamHI-HindIII fragment from pahS was cloned between the BamHI and HindIII sites of pUC18-mini-Tn7T-Gm to generate pUC18-mini-Tn7T-PahS. Using the same experimental procedure, the other pUC18-mini-Tn7T expression vectors (including pUC18-mini-Tn7T-PahP and others, detailed in Table S6) were constructed. The primers used are listed in Table S5.
To deliver the mini-Tn7 vectors by four parental matings, SM10(λpir)/pTNS2, HB101/pRK2013 (Kmr), E. coli harboring the respective mini-Tn7 delivery plasmid and the respective recipient mutant strains (as detailed in Table S5) were grown overnight at 37°C in LB supplemented with antibiotics for the plasmid-containing strains. Next, 0.1 mL of each culture was added to a microcentrifuge tube with 0.6 ml LB, and the cells were pelleted, washed twice with 1 ml of LB and resuspended in 30 μL LB medium. The conjugation mixture was placed on a filter membrane on nonselective LB agar and incubated at 37°C for ∼5 h. The filter was then placed in 0.2 ml 0.9% (w/vol) NaCl; the cells were dislodged by vortexing, and 0.1-mL aliquots were plated on selective agar plates. Colony PCR was used to verify chromosomal Tn7 insertions in bacteria for which the genome sequences were known. Common primers used for all bacteria were PTn7L (5’-ATTAGCTTACGACGCTACACCC) and PTn7R (5’-CACAGCATAACTGGACTGATTTC).57
Chromatin immunoprecipitation (ChIP)-seq
The ChIP protocol was based on previously published methods61 and the Affymetrix ChIP assay protocol with several modifications. The mutants pahR-3×Flag and wild type P1 strains with intergenic coding region-3×Flag were cultured in 200 ml of ASM medium supplemented with 500 ppm PAHs or sodium acetate for 5d (OD600 of 1.5), respectively. After induction with urocanic acid, formaldehyde was added to a final concentration of 1% (vol/vol) and incubated for 15 min at room temperature with gentle agitation. Crosslinking was stopped by the addition of glycine to a final concentration of 125 mM, and bacteria were subsequently washed three times in ice-cold phosphate-buffered saline. Bacterial pellets were resuspended in lysis buffer [50 mM Hepes pH 7.5, 150 mM NaCl, 1 mM EDTA, 1% (vol/vol) Triton X-100, 0.1% (wt/vol) sodium deoxycholate (DOC), 0.1% (wt/vol) sodium dodecyl sulfate (SDS), complete protease inhibitor cocktail (Roche), 1 mM phenylmethylsulfonyl fluoride (PMSF)], and chromatin was fragmented using a sonicator Misonix XL-2000 with 12 pulses of 30 s at 1.5-min intervals in an ice bath. The DNA was sheared by sonication to an average size of 100 to 1,000 bp. The supernatant was clarified at 13,000 rpm for 10 min at 4°C. Immunoprecipitation reaction mixtures contained a 200-μl aliquots of input sample, 800 μl of IP buffer (50 mM HEPES-KOH, pH 7.5, 150 mM NaCl, 1 mM EDTA, 1% Triton X-100, and 1 mM PMSF), and 40 μl EZ-view anti-FLAG agarose beads (Sigma) (equilibrated in Tris-buffered saline [TBS]) and were carried out for 2 h at room temperature on a rotator. Following immunoprecipitation, beads were collected and washed (Affymetrix ChIP assay protocol). Immunoprecipitated complexes were eluted, and cross-links were reversed as described elsewhere (Affymetrix ChIP assay protocol). Samples (input DNA and IP DNA) were analyzed by qRT-PCR to assess the quality of the immunoprecipitation from three independent experiments. DNA from representative ChIP samples was prepared for sequencing using the Illumina ChIP-seq sample prep kit. The following ChIP samples were sequenced: the input DNA and IP DNA from pahR-3×Flag (PAHs and sodium acetate induction, respectively) and input DNA and IP DNA from wild-type P1strain (PAHs and sodium acetate induction, respectively). See the supplemental information for a description of ChIP-seq data analysis procedures.
Real-time PCR
Cycloclasticus sp. P1 and the mutant strain PARP1 were grown in 200 mL of MMC medium containing the appropriate antibiotics, with sodium acetate or PAHs as the carbon source in 500 mL Erlenmeyer flasks at 28°C on a rotary shaker (200 rpm). Bacterial growth was monitored based on optical density measurements (OD600). Total RNA was extracted using the RNeasy Mini Kit (Qiagen, Valencia, CA, USA) according to the manufacturer’s protocol and subsequently treated with DNase I (Invitrogen, Carlsbad, CA, USA). The RNA yield was estimated using a Nanodrop UV Spectrometer (Thermo Scientific, Wilmington, DE, USA). Approximately 4μg of RNA was reverse transcribed using 20 ng of random primers (Invitrogen, Carlsbad, CA, USA) and PrimeScript™ Reverse Transcriptase (Takara, Dalian, China). Control reactions were performed in the absence of reverse transcriptase to verify the absence of genomic DNA. To calculate the number of viable bacteria present, 16S rRNA gene copy numbers were determined through quantitative real-time PCR. The 16S rRNA gene copy number ranged from approximately 107–109 in each sample.
The gene-specific primer sequences are listed in Table S5 and were synthesized by Invitrogen (Shanghai, China). Quantitative real-time PCR was performed using IQ™ SYBR Green Supermix and the IQ™5 Multicolor Real-time PCR Detection System (Bio-Rad, California, USA). The reactions were performed in 96-well optical plates sealed with optical caps in a 25 μl reaction volume containing 12.5 μl of 2X SYBR® Green PCR Supermix (Bio-Rad, California, USA), the DNA template, primers at an optimized concentration, and sterile water. The following program was utilized: 2 min at 50°C (uracil-N-glycosylase activation), 10 min at 95°C (activation of Taq polymerase), and 45 cycles of denaturation (10 s at 95°C), annealing and elongation (30 s at 56°C–61°C). Fluorescence data were acquired at the end of the elongation step. The specificity of the accumulated products was verified through melting curve analysis. In all of the experiments, appropriate negative controls were subjected to the same procedure to exclude or detect any possible contamination. The size and purity of the amplicon and the absence of dimer formation were assayed using conventional agarose gel electrophoresis.
The samples were quantified using a calibration curve that was generated in parallel. A quantification standard curve was generated for each of the tested genes based on a serial dilution of a known amount of target DNA (from 10 to 106 copies) utilizing the optimal PCR conditions described above. Each dilution was assayed in triplicate to generate each data point. For each standard, the concentration was plotted versus the cycle number at which the fluorescent signal increased above the background or threshold (Ct value of 0.1). The slope of each calibration curve was used in the following equation to determine the reaction efficiency: Efficiency = 10–1/slope –1. Accordingly, an efficiency of 1 signifies that the concentration of the product doubles in each cycle. Based on the calibration curve (IQTM 5 Multicolor Real-time PCR Detection System Software), the initial copy number of each target mRNA was calculated for each sample. The calculated values were normalized to the expression of the 16S rRNA gene to yield the number of copies of each mRNA transcript in 1,000 Cycloclasticus sp. P1 or mutant cells.
Statistical analyses
Unless otherwise specified in the figure legends, all reported results are means ± standard errors (SEs) and have been tested for statistical significance using the permutational t test.
Acknowledgments
This work was financially supported by the Project of the National Science Foundation of China (Nos. 91851203, 41922041 and 41876143), the Natural Science Fund of Fujian Province of China (No. 2021J02015), the Scientific Research Foundation of Third Institute of Oceanography, MNR, China (2023021 and 2019021), and the China Ocean Mineral Resources R&D Association (COMRA) program (No. DY135-B2-01).
Author contributions
Z.S. and W.W. planned and managed the projects. W.W. and Z.S. designed the experiments. W.W., J.X., and Z.W. conducted the experiments and analyzed the data. W.W. and Z.S. interpreted the results and wrote the manuscript that was finalized by Z.S.
Declaration of interests
The authors have no conflicts of interest to declare.
Published: September 22, 2023
Footnotes
Supplemental information can be found online at https://doi.org/10.1016/j.isci.2023.107912.
Contributor Information
Wanpeng Wang, Email: wangwanpeng@tio.org.cn.
Zongze Shao, Email: shaozz@163.com.
Supplemental information
Data and code availability
-
•
All data reported in this paper will be shared by the lead contact upon request.
-
•
This paper does not report original code.
-
•
Any additional information required to reanalyze the data reported in this paper is available from the lead contact upon request.
References
- 1.Wadhams G.H., Armitage J.P. Making sense of it all: bacterial chemotaxis. Nat. Rev. Mol. Cell Biol. 2004;5:1024–1037. doi: 10.1038/nrm1524. [DOI] [PubMed] [Google Scholar]
- 2.Keegstra J.M., Carrara F., Stocker R. The ecological roles of bacterial chemotaxis. Nat. Rev. Microbiol. 2022;20:491–504. doi: 10.1038/s41579-022-00709-w. [DOI] [PubMed] [Google Scholar]
- 3.Raina J.-B., Fernandez V., Lambert B., Stocker R., Seymour J.R. The role of microbial motility and chemotaxis in symbiosis. Nat. Rev. Microbiol. 2019;17:284–294. doi: 10.1038/s41579-019-0182-9. [DOI] [PubMed] [Google Scholar]
- 4.Jacob-Dubuisson F., Mechaly A., Betton J.M., Antoine R. Structural insights into the signalling mechanisms of two-component systems. Nat. Rev. Microbiol. 2018;16:585–593. doi: 10.1038/s41579-018-0055-7. [DOI] [PubMed] [Google Scholar]
- 5.Buschiazzo A., Trajtenberg F. Two-Component Sensing and Regulation: How Do Histidine Kinases Talk with Response Regulators at the Molecular Level? Annu. Rev. Microbiol. 2019;73:507–528. doi: 10.1146/annurev-micro-091018-054627. [DOI] [PubMed] [Google Scholar]
- 6.Francis V.I., Porter S.L. Multikinase Networks: Two-Component Signaling Networks Integrating Multiple Stimuli. Annu. Rev. Microbiol. 2019;73:199–223. doi: 10.1146/annurev-micro-020518-115846. [DOI] [PubMed] [Google Scholar]
- 7.Premnath N., Mohanrasu K., Guru Raj Rao R., Dinesh G.H., Prakash G.S., Ananthi V., Ponnuchamy K., Muthusamy G., Arun A. A crucial review on polycyclic aromatic Hydrocarbons - Environmental occurrence and strategies for microbial degradation. Chemosphere. 2021;280:130608. doi: 10.1016/j.chemosphere.2021.130608. [DOI] [PubMed] [Google Scholar]
- 8.Louvado A., Gomes N.C.M., Simões M.M.Q., Almeida A., Cleary D.F.R., Cunha A. Polycyclic aromatic hydrocarbons in deep sea sediments: Microbe–pollutant interactions in a remote environment. Sci. Total Environ. 2015;526:312–328. doi: 10.1016/j.scitotenv.2015.04.048. [DOI] [PubMed] [Google Scholar]
- 9.Zhou Z., Liu Y., Pan J., Cron B.R., Toner B.M., Anantharaman K., Breier J.A., Dick G.J., Li M. Gammaproteobacteria mediating utilization of methyl-, sulfur- and petroleum organic compounds in deep ocean hydrothermal plumes. ISME J. 2020;14:3136–3148. doi: 10.1038/s41396-020-00745-5. [DOI] [PMC free article] [PubMed] [Google Scholar]
- 10.Wang W., Li Z., Zeng L., Dong C., Shao Z. The oxidation of hydrocarbons by diverse heterotrophic and mixotrophic bacteria that inhabit deep-sea hydrothermal ecosystems. ISME J. 2020;14:1994–2006. doi: 10.1038/s41396-020-0662-y. [DOI] [PMC free article] [PubMed] [Google Scholar]
- 11.Head I.M., Jones D.M., Roling W.F. Marine microorganisms make a meal of oil. Nat. Rev. Microbiol. 2006;4:173–182. doi: 10.1038/nrmicro1348. [DOI] [PubMed] [Google Scholar]
- 12.Li J., Mara P., Schubotz F., Sylvan J.B., Burgaud G., Klein F., Beaudoin D., Wee S.Y., Dick H.J.B., Lott S., et al. Recycling and metabolic flexibility dictate life in the lower oceanic crust. Nature. 2020;579:250–255. doi: 10.1038/s41586-020-2075-5. [DOI] [PubMed] [Google Scholar]
- 13.Lindell A.E., Zimmermann-Kogadeeva M., Patil K.R. Multimodal interactions of drugs, natural compounds and pollutants with the gut microbiota. Nat. Rev. Microbiol. 2022;20:431–443. doi: 10.1038/s41579-022-00681-5. [DOI] [PMC free article] [PubMed] [Google Scholar]
- 14.Sowada J., Lemoine L., Schön K., Hutzler C., Luch A., Tralau T. Toxification of polycyclic aromatic hydrocarbons by commensal bacteria from human skin. Arch. Toxicol. 2017;91:2331–2341. doi: 10.1007/s00204-017-1964-3. [DOI] [PMC free article] [PubMed] [Google Scholar]
- 15.Zhou Q., Song C., Wang P., Zhao Z., Li Y., Zhan S. Generating dual-active species by triple-atom sites through peroxymonosulfate activation for treating micropollutants in complex water. Proc. Natl. Acad. Sci. USA. 2023;120 doi: 10.1073/pnas.2300085120. e2300085120. [DOI] [PMC free article] [PubMed] [Google Scholar]
- 16.Dyksterhouse S.E., Gray J.P., Herwig R.P., Lara J.C., Staley J.T. Cycloclasticus pugetii gen. nov., sp. nov., an aromatic hydrocarbon-degrading bacterium from marine sediments. Int. J. Syst. Bacteriol. 1995;45:116–123. doi: 10.1099/00207713-45-1-116. [DOI] [PubMed] [Google Scholar]
- 17.Kasai Y., Kishira H., Harayama S. Bacteria belonging to the genus cycloclasticus play a primary role in the degradation of aromatic hydrocarbons released in a marine environment. Appl. Environ. Microbiol. 2002;68:5625–5633. doi: 10.1128/AEM.68.11.5625-5633.2002. [DOI] [PMC free article] [PubMed] [Google Scholar]
- 18.Sieradzki E.T., Morando M., Fuhrman J.A. Metagenomics and Quantitative Stable Isotope Probing Offer Insights into Metabolism of Polycyclic Aromatic Hydrocarbon Degraders in Chronically Polluted Seawater. mSystems. 2021;6 doi: 10.1128/mSystems.00245-21. [DOI] [PMC free article] [PubMed] [Google Scholar]
- 19.Hu P., Dubinsky E.A., Probst A.J., Wang J., Sieber C.M.K., Tom L.M., Gardinali P.R., Banfield J.F., Atlas R.M., Andersen G.L. Simulation of Deepwater Horizon oil plume reveals substrate specialization within a complex community of hydrocarbon degraders. Proc. Natl. Acad. Sci. USA. 2017;114:7432–7437. doi: 10.1073/pnas.1703424114. [DOI] [PMC free article] [PubMed] [Google Scholar]
- 20.Wang W., Shao Z. An intracellular sensing and signal transduction system that regulates the metabolism of polycyclic aromatic hydrocarbons in bacteria. mSystems. 2021;6:e0063621. doi: 10.1128/mSystems.00636-21. [DOI] [PMC free article] [PubMed] [Google Scholar]
- 21.Baek M., DiMaio F., Anishchenko I., Dauparas J., Ovchinnikov S., Lee G.R., Wang J., Cong Q., Kinch L.N., Schaeffer R.D., et al. Accurate prediction of protein structures and interactions using a three-track neural network. Science (New York, N.Y.) 2021;373:871–876. doi: 10.1126/science.abj8754. [DOI] [PMC free article] [PubMed] [Google Scholar]
- 22.Matilla M.A., Ortega Á., Krell T. The role of solute binding proteins in signal transduction. Comput. Struct. Biotechnol. J. 2021;19:1786–1805. doi: 10.1016/j.csbj.2021.03.029. [DOI] [PMC free article] [PubMed] [Google Scholar]
- 23.Sourjik V., Vaknin A., Shimizu T.S., Berg H.C. In vivo measurement by FRET of pathway activity in bacterial chemotaxis. Methods Enzymol. 2007;423:365–391. doi: 10.1016/S0076-6879(07)23017-4. [DOI] [PubMed] [Google Scholar]
- 24.Bailey T.L., Williams N., Misleh C., Li W.W. MEME: discovering and analyzing DNA and protein sequence motifs. Nucleic Acids Res. 2006;34:W369–W373. doi: 10.1093/nar/gkl198. [DOI] [PMC free article] [PubMed] [Google Scholar]
- 25.Ghosal D., Ghosh S., Dutta T.K., Ahn Y. Current State of Knowledge in Microbial Degradation of Polycyclic Aromatic Hydrocarbons (PAHs): A Review. Front. Microbiol. 2016;7:1369. doi: 10.3389/fmicb.2016.01369. [DOI] [PMC free article] [PubMed] [Google Scholar]
- 26.Peng R.H., Xiong A.S., Xue Y., Fu X.Y., Gao F., Zhao W., Tian Y.S., Yao Q.H. Microbial biodegradation of polyaromatic hydrocarbons. FEMS Microbiol. Rev. 2008;32:927–955. doi: 10.1111/j.1574-6976.2008.00127.x. [DOI] [PubMed] [Google Scholar]
- 27.Beare P.A., For R.J., Martin L.W., Lamont I.L. Siderophore-mediated cell signalling in Pseudomonas aeruginosa: divergent pathways regulate virulence factor production and siderophore receptor synthesis. Mol. Microbiol. 2003;47:195–207. doi: 10.1046/j.1365-2958.2003.03288.x. [DOI] [PubMed] [Google Scholar]
- 28.Lamont I.L., Beare P.A., Ochsner U., Vasil A.I., Vasil M.L. Siderophore-mediated signaling regulates virulence factor production in Pseudomonasaeruginosa. Proc. Natl. Acad. Sci. USA. 2002;99:7072–7077. doi: 10.1073/pnas.092016999. [DOI] [PMC free article] [PubMed] [Google Scholar]
- 29.Llamas MA M.M., Sparrius M., Vandenbroucke-Grauls C.M., Ratledge C., Bitter W. Characterization of five novel Pseudomonas aeruginosa cell-surface signalling systems. Mol. Microbiol. 2008;67:458–472. doi: 10.1111/j.1365-2958.2007.06061.x. [DOI] [PubMed] [Google Scholar]
- 30.Llamas M.A., Imperi F., Visca P., Lamont I.L. Cell-surface signaling in Pseudomonas: stress responses, iron transport, and pathogenicity. FEMS Microbiol. Rev. 2014;38:569–597. doi: 10.1111/1574-6976.12078. [DOI] [PubMed] [Google Scholar]
- 31.Rowley G., Spector M., Kormanec J., Roberts M. Pushing the envelope: extracytoplasmic stress responses in bacterial pathogens. Nat. Rev. Microbiol. 2006;4:383–394. doi: 10.1038/nrmicro1394. [DOI] [PubMed] [Google Scholar]
- 32.Mascher T. Signaling diversity and evolution of extracytoplasmic function (ECF) sigma factors. Curr. Opin. Microbiol. 2013;16:148–155. doi: 10.1016/j.mib.2013.02.001. [DOI] [PubMed] [Google Scholar]
- 33.Brillet K., Journet L., Celia H., Paulus L., Stahl A., Pattus F., Cobessi D. A beta strand lock exchange for signal transduction in TonB-dependent transducers on the basis of a common structural motif. Structure. 2007;15:1383–1391. doi: 10.1016/j.str.2007.08.013. [DOI] [PubMed] [Google Scholar]
- 34.Draper R.C., Martin L.W., Beare P.A., Lamont I.L. Differential proteolysis of sigma regulators controls cell-surface signalling in Pseudomonas aeruginosa. Mol. Microbiol. 2011;82:1444–1453. doi: 10.1111/j.1365-2958.2011.07901.x. [DOI] [PubMed] [Google Scholar]
- 35.James H.E., Beare P.A., Martin L.W., Lamont I.L. Mutational analysis of a bifunctional ferrisiderophore receptor and signal-transducing protein from Pseudomonas aeruginosa. J. Bacteriol. 2005;187:4514–4520. doi: 10.1128/JB.187.13.4514-4520.2005. [DOI] [PMC free article] [PubMed] [Google Scholar]
- 36.Pollet R.M., Martin L.M., Koropatkin N.M. TonB-dependent transporters in the Bacteroidetes: Unique domain structures and potential functions. Mol. Microbiol. 2021;115:490–501. doi: 10.1111/mmi.14683. [DOI] [PubMed] [Google Scholar]
- 37.Nguyen P.T., Lai J.Y., Lee A.T., Kaiser J.T., Rees D.C. Noncanonical role for the binding protein in substrate uptake by the MetNI methionine ATP Binding Cassette (ABC) transporter. Proc. Natl. Acad. Sci. USA. 2018;115:E10596–E10604. doi: 10.1073/pnas.1811003115. [DOI] [PMC free article] [PubMed] [Google Scholar]
- 38.Krell T., Lacal J., Busch A., Silva-Jimenez H., Guazzaroni M.E., Ramos J.L. Bacterial sensor kinases: diversity in the recognition of environmental signals. Annu. Rev. Microbiol. 2010;64:539–559. doi: 10.1146/annurev.micro.112408.134054. [DOI] [PubMed] [Google Scholar]
- 39.Wang W., Wang L., Shao Z. Polycyclic aromatic hydrocarbon (PAH) degradation pathways of the obligate marine PAH degrader Cycloclasticus sp. strain P1. Appl. Environ. Microbiol. 2018;84:e01261-18. doi: 10.1128/AEM.01261-18. [DOI] [PMC free article] [PubMed] [Google Scholar]
- 40.Wang W., Shao Z. An Intracellular Sensing and Signal Transduction System That Regulates the Metabolism of Polycyclic Aromatic Hydrocarbons in Bacteria. mSystems. 2021;6:e0063621. doi: 10.1128/mSystems.00636-21. [DOI] [PMC free article] [PubMed] [Google Scholar]
- 41.de Lorenzo V., Herrero M., Jakubzik U., Timmis K.N. Mini-Tn5 transposon derivatives for insertion mutagenesis, promoter probing, and chromosomal insertion of cloned DNA in gram-negative eubacteria. J. Bacteriol. 1990;172:6568–6572. doi: 10.1128/jb.172.11.6568-6572.1990. [DOI] [PMC free article] [PubMed] [Google Scholar]
- 42.Gacek-Matthews A., Chromiková Z., Sulyok M., Lücking G., Barák I., Ehling-Schulz M. Beyond Toxin Transport: Novel Role of ABC Transporter for Enzymatic Machinery of Cereulide NRPS Assembly Line. mBio. 2020;11 doi: 10.1128/mBio.01577-20. [DOI] [PMC free article] [PubMed] [Google Scholar]
- 43.Choi K.-H., DeShazer D., Schweizer H.P. mini-Tn7 insertion in bacteria with multiple glmS-linked attTn7 sites: example Burkholderia mallei ATCC 23344. Nat. Protoc. 2006;1:162–169. doi: 10.1038/nprot.2006.25. [DOI] [PubMed] [Google Scholar]
- 44.Green M.R., Sambrook J. Cold Spring Harbor Laboratory Press; 2012. Molecular Cloning: A Laboratory Manual. [Google Scholar]
- 45.Babel H., Naranjo-Meneses P., Trauth S., Schulmeister S., Malengo G., Sourjik V., Bischofs I.B. Ratiometric population sensing by a pump-probe signaling system in Bacillus subtilis. Nat. Commun. 2020;11:1176. doi: 10.1038/s41467-020-14840-w. [DOI] [PMC free article] [PubMed] [Google Scholar]
- 46.Algar W.R., Hildebrandt N., Vogel S.S., Medintz I.L. FRET as a biomolecular research tool - understanding its potential while avoiding pitfalls. Nat. Methods. 2019;16:815–829. doi: 10.1038/s41592-019-0530-8. [DOI] [PubMed] [Google Scholar]
- 47.Piñas G.E., Frank V., Vaknin A., Parkinson J.S. The source of high signal cooperativity in bacterial chemosensory arrays. Proc. Natl. Acad. Sci. USA. 2016;113:3335–3340. doi: 10.1073/pnas.1600216113. [DOI] [PMC free article] [PubMed] [Google Scholar]
- 48.Anwari K., Poggio S., Perry A., Gatsos X., Ramarathinam S.H., Williamson N.A., Noinaj N., Buchanan S., Gabriel K., Purcell A.W., et al. A modular BAM complex in the outer membrane of the alpha-proteobacterium Caulobacter crescentus. PLoS One. 2010;5:e8619. doi: 10.1371/journal.pone.0008619. [DOI] [PMC free article] [PubMed] [Google Scholar]
- 49.Anwari K., Webb C.T., Poggio S., Perry A.J., Belousoff M., Celik N., Ramm G., Lovering A., Sockett R.E., Smit J., et al. The evolution of new lipoprotein subunits of the bacterial outer membrane BAM complex. Mol. Microbiol. 2012;84:832–844. doi: 10.1111/j.1365-2958.2012.08059.x. [DOI] [PMC free article] [PubMed] [Google Scholar]
- 50.Bontemps-Gallo S., Madec E., Lacroix J.M. The two-component system CpxAR is essential for virulence in the phytopathogen bacteria Dickeya dadantii EC3937. Environ. Microbiol. 2015;17:4415–4428. doi: 10.1111/1462-2920.12874. [DOI] [PMC free article] [PubMed] [Google Scholar]
- 51.Barbieri C.M., Stock A.M. Universally applicable methods for monitoring response regulator aspartate phosphorylation both in vitro and in vivo using Phos-tag-based reagents. Anal. Biochem. 2008;376:73–82. doi: 10.1016/j.ab.2008.02.004. [DOI] [PMC free article] [PubMed] [Google Scholar]
- 52.Mounier J., Hakil F., Branchu P., Naitali M., Goulas P., Sivadon P., Grimaud R. AupA and AupB Are Outer and Inner Membrane Proteins Involved in Alkane Uptake in Marinobacter hydrocarbonoclasticus SP17. mBio. 2018;9 doi: 10.1128/mBio.00520-18. [DOI] [PMC free article] [PubMed] [Google Scholar]
- 53.Osborn M.J., Gander J.E., Parisi E., Carson J. Mechanism of assembly of the outer membrane of Salmonella typhimurium. Isolation and characterization of cytoplasmic and outer membrane. J. Biol. Chem. 1972;247:3962–3972. [PubMed] [Google Scholar]
- 54.Yang J., Zhang Y. I-TASSER server: new development for protein structure and function predictions. Nucleic Acids Res. 2015;43:W174–W181. doi: 10.1093/nar/gkv342. [DOI] [PMC free article] [PubMed] [Google Scholar]
- 55.Zhang C., Freddolino P.L., Zhang Y. COFACTOR: improved protein function prediction by combining structure, sequence and protein-protein interaction information. Nucleic Acids Res. 2017;45:W291–W299. doi: 10.1093/nar/gkx366. [DOI] [PMC free article] [PubMed] [Google Scholar]
- 56.Karimova G., Pidoux J., Ullmann A., Ladant D. A bacterial two-hybrid system based on a reconstituted signal transduction pathway. Proc. Natl. Acad. Sci. USA. 1998;95:5752–5756. doi: 10.1073/pnas.95.10.5752. [DOI] [PMC free article] [PubMed] [Google Scholar]
- 57.Choi K.-H., Gaynor J.B., White K.G., Lopez C., Bosio C.M., Karkhoff-Schweizer R.R., Schweizer H.P. A Tn7-based broad-range bacterial cloning and expression system. Nat. Methods. 2005;2:443–448. doi: 10.1038/nmeth765. [DOI] [PubMed] [Google Scholar]
- 58.Wang W., Shao Z. The long-chain alkane metabolism network of Alcanivorax dieselolei. Nat. Commun. 2014;5:5755. doi: 10.1038/ncomms6755. [DOI] [PubMed] [Google Scholar]
- 59.Choi K.-H., Schweizer H.P. mini-Tn7 insertion in bacteria with secondary, non-glmS-linked attTn7 sites: example Proteus mirabilis HI4320. Nat. Protoc. 2006;1:170–178. doi: 10.1038/nprot.2006.26. [DOI] [PubMed] [Google Scholar]
- 60.Choi K.-H., Schweizer H.P. mini-Tn7 insertion in bacteria with single attTn7 sites: example Pseudomonas aeruginosa. Nat. Protoc. 2006;1:153–161. doi: 10.1038/nprot.2006.24. [DOI] [PubMed] [Google Scholar]
- 61.van Kessel J.C., Ulrich L.E., Zhulin I.B., Bassler B.L. Analysis of activator and repressor functions reveals the requirements for transcriptional control by LuxR, the master regulator of quorum sensing in Vibrio harveyi. mBio. 2013;4 doi: 10.1128/mBio.00378-13. [DOI] [PMC free article] [PubMed] [Google Scholar]
Associated Data
This section collects any data citations, data availability statements, or supplementary materials included in this article.
Supplementary Materials
Data Availability Statement
-
•
All data reported in this paper will be shared by the lead contact upon request.
-
•
This paper does not report original code.
-
•
Any additional information required to reanalyze the data reported in this paper is available from the lead contact upon request.