

Abstract

Carbon electrodes are one of the key components of vanadium redox flow batteries (VRFBs), and their wetting behavior, electrochemical performance, and tendency to side reactions are crucial for cell efficiency. Herein, we demonstrate three different types of electrode modifications: poly(o-toluidine) (POT), Vulcan XC 72R, and an iron-doped carbon–nitrogen base material (Fe–N–C + carbon nanotube (CNT)). By combining synchrotron X-ray imaging with traditional characterization approaches, we give thorough insights into changes caused by each modification in terms of the electrochemical performance in both half-cell reactions, wettability and permeability, and tendency toward the hydrogen evolution side reaction. The limiting performance of POT and Vulcan XC 72R could mainly be ascribed to hindered electrolyte transport through the electrode. Fe–N–C + CNT displayed promising potential in the positive half-cell with improved electrochemical performance and wetting behavior but catalyzed the hydrogen evolution side reaction in the negative half-cell.
Keywords: vanadium redox flow battery, carbon felt, electrode modification, synchrotron X-ray imaging, wettability, hydrogen evolution reaction
1. Introduction
Keeping in mind the negative impact of traditional power generation from fossil fuels and the steadily increasing energy demand of the world population, renewable energy sources, such as wind or solar energy, have become increasingly popular in recent years. However, energy fluctuations must be compensated.1,2 Vanadium redox flow batteries (VRFBs) can store excess energy efficiently via vanadium redox reactions. Among other things, the VRFB efficiency depends strongly on the type of electrode materials, their wettability, and their tendency to side reactions.3,4
Pristine carbon electrodes exhibit poor electrochemical activity for the vanadium redox reactions in VRFBs and an undesirable hydrophobic wetting behavior.5−8 Thus, several approaches have been presented to improve the performance of commercial carbon electrodes, such as thermal treatment, chemical treatment, or modification with different types of electrocatalysts.9−12 The most common treatment is thermal activation for several hours at around 400 °C.6,13,14 Herein, we present a modification approach based on the deposition of three different types of materials onto carbon felts: poly(o-toluidine) (POT), Vulcan XC 72R, and Fe–N–C + carbon nanotube (CNT). POT was chosen for its conducting properties and facile deposition via an electropolymerization process. Furthermore, it was previously shown to improve the capacitance and conductivity of activated carbon fabrics used in electrochemical capacitors15 and to show high energy storage capacity and good cycling stability.16 Vulcan XC 72R is a carbon black and a well-known catalyst material used in several electrochemical applications, e.g., fuel cells.17,18 Fe–N–C + CNT is an iron-doped carbon–nitrogen-based material synthesized from an iron salt and a nitrogen-rich organic precursor and doped with CNTs. Such non-platinum-group metal catalysts were initially prepared for different fuel cell applications to substitute the expensive platinum catalyst.19−23 CNTs were previously found to improve the performance of VRFBs.9,10 Thus, combining a promising electrocatalyst from fuel cell research with CNTs might synergistically enhance vanadium redox reactions.
The influence of the type of modification on different properties influencing the electrode performance is investigated throughout this study. Their wettability and permeability influence cell efficiency since a highly wettable and permeable material leads to high electrolyte saturation and reduced pumping losses. A higher saturation increases the electrolyte–electrode interface and the number of active sites for the reactions. This leads to higher possible currents and a more homogeneous potential distribution preventing electrode corrosion.5,24,25 Traditional approaches study hydrophilicity by contact angle measurements.26,27 However, this approach is not suitable for most thermally activated or otherwise modified carbon electrodes since they typically absorb a water droplet directly. Our group demonstrated a novel approach14 involving dynamic vapor sorption (DVS) measurements to study the wettability of carbon felt electrodes thermally activated at different temperatures. It was adapted from previous applications with membranes28,29 and mesoporous N-doped carbon spheres30 in VRFB research. We showed a clear trend of a higher water sorption capacity with increasing activation temperatures. However, DVS is used to measure an average sample value and cannot be used to differentiate between different areas of the respective sample. X-ray imaging is an emerging method in VRFB research5,7,26,27,31−35 and offers a complementary approach to studying electrode permeability. By following the electrolyte injection and distribution within the electrode via X-ray imaging, the electrolyte saturation in the electrode can be locally resolved. Previous publications show that this measurement is suitable for studying differences in the electrolyte distribution caused by thermal or plasma treatment, electrolytes, compression, or flow fields.5,26,27,31,35 Electrochemical impedance spectroscopy (EIS) can provide additional insights into processes related to the permeability of the electrodes. Schilling et al. showed that EIS in the positive half-cell combined with distribution of relaxation times (DRT) analysis could resolve the individual processes.36 Hereby, the medium-frequency and low-frequency ranges, which were associated with the transport through the porous electrode structure and the ion transport, respectively, provide an additional approach to probe the electrodes’ wettability and permeability.
In addition to wettability, side reactions influence the overall VRFB efficiency. The carbon corrosion and the oxygen evolution reaction in the positive half-cell and the hydrogen evolution reaction (HER) in the negative half-cell consume charge and lead to electrolyte imbalances.37,38 Furthermore, bubble formation, particularly during the HER,38 decreases the electrolyte–electrode interface and hinders the vanadium redox reactions. Previous publications investigated the influence of several parameters on the HER by employing hydrogen sensors in the electrolyte tank, hydrogen collection devices, and differential electrochemical mass spectrometry.38−44 However, these methods provided focused insights into the amount of hydrogen generated during the measurements but did not include local bubble formation. Eifert et al. were the first to demonstrate that synchrotron X-ray imaging could track the HER inside carbon felt electrodes.35
Herein, we characterize and compare carbon felts modified with POT, Vulcan XC 72R, and Fe–N–C + CNT by combining synchrotron X-ray imaging with scanning electron microscopy (SEM), DVS measurements, and electrochemical measurements in a flow cell setup. The combination of DVS, electrolyte injection experiments monitored by X-ray imaging and EIS provides an in-depth approach to characterize the electrodes’ wettability and permeability for vanadium electrolyte. Furthermore, cyclic voltammetry (CV) allows us to study the electrochemical performance in both half-cells separately and differentiate the impact of various modifications on both redox couples. Finally, we analyze the tendency of the samples toward the HER by comparing the CV results in the negative half-cell to electrolyte saturation changes observed via X-ray imaging at negative applied potentials.
2. Experimental Section
2.1. Materials and Electrolyte Preparation
Commercial graphitized rayon-based carbon felts (SIGRACELL GFA 6 EA, SGL Carbon) were further treated and modified for this study. A reference sample was prepared for comparison by thermally activating the pristine carbon felt according to a previously described standard procedure.6,8,13,14 A heating rate of 400 °C h–1 was applied, and the material was held at 400 °C for 25 h in an air atmosphere and afterward cooled down to room temperature in the muffle furnace.
Three other samples were prepared by modifying carbon felt. POT was deposited onto the carbon fibers using an electropolymerization process previously described by Sivakumar et al. for carbon fabric.15 First, the carbon felt was thermally treated according to the procedure described to ensure sufficient conductivity and wettability for electrochemical deposition. The deposition was performed in a three-electrode setup in a beaker containing 1 M H2SO4 (96%, Suprapur, Merck) and 0.1 M o-toluidine (≥99%, EMSURE, Merck). The thermally activated carbon felt was skewered onto a titanium wire (Ø 1.0 mm, Alfa Aesar) as the working electrode (WE), another thermally activated carbon felt (7.4 cm × 0.8 cm) connected by a titanium wire served as the counter electrode (CE), and a reversible hydrogen reference electrode (HydroFlex, Gaskatel) was used as the reference electrode (RE). An SP-300 potentiostat (BioLogic Science Instruments) was used for electrical control. One cyclic voltammogram between 0.0 V vs RHE and 1.1 V vs RHE was conducted with a scan rate of 1 mV s–1 for electropolymerization. Vulcan XC 72R (≥99%, The Fuel Cell Store) or Fe–N–C + CNT (received from the University of Mexico, preparation via sacrificial support method)19 was added to the carbon felts (7.4 cm × 0.8 cm) via an impregnation process. For this, 100 mg of the respective powder, 3 mL of 0.5 wt % D2021 Nafion dispersion (alcohol based 1100 EW, 20 wt %, The Fuel Cell Store), and 17 mL of a 4:1 water/isopropyl alcohol (≥98%, technical, VWR International) mixture were mixed and dispersed using a sonotrode (SONOPULS HD 2070, BANDELIN) for 30 s at a power of 10%. This mixture is based on previous publications about fuel cell catalysts.19,23 The pristine carbon felts were first sonicated in ultrapure water for 10 min to remove the loose fibers and impurities. Afterward, the carbon felts were transferred to the respective mixtures and sonicated for another 30 min. The samples were cleansed with water to remove excess material and thermally activated according to the described thermal activation procedure. In this case, thermal activation was performed after the modification since preceding measurements showed better electrochemical performance.
The vanadium(IV) electrolyte for the experiments consisted of 0.1 M VOSO4 (vanadyl sulfate hydrate, 99.9% metal basis, Thermo Fisher), which was dissolved in 2 M H2SO4 (96%, Suprapur, Merck). The vanadium(II) electrolyte was prepared by charging the vanadium(IV) electrolyte with a VRFB in a redox flow test system (Scribner 857 Redox Flow Cell Test System, Scribner Associates, Inc.).
All chemicals in this study were used as received, and the electrolytes for the modifications and the experiments were diluted with ultrapure water (18.2 MΩ·cm).
2.2. Materials Characterization
SEM and DVS were used to study the morphologies and wettabilities of all samples. SEM images were conducted at different magnifications with an LEO 1550 VP (Carl Zeiss AG) by using the Inlens detector and an acceleration voltage of 3.00 kV. DVS was measured with around 10 mg of the respective sample on a Q5000 sorption analyzer (TA Instruments). The same customized measurement protocol was used for all measurements. At the measurement’s beginning and end, the sample is heated up to 60 °C and held for 240 and 120 min, respectively, to remove water/moisture residues and ensure a stable starting mass. Sorption and desorption isotherms under nitrogen gas flow at 25 °C are measured at 0 to 90% relative humidity (RH) in between these two steps. The RH was changed stepwise by 10% from 0 to 40% RH and in 5% intervals at higher RHs to ensure that there were enough data points in this range. The dwell time was adapted at different RHs to reach mass equilibrium after each sorption/desorption step. At 50% RH and below, the RH was kept constant for 90 min. Between 55 and 75%, the dwell time was increased to 120 min. The RH remained constant for 180 min at 80% and 85% RH and for 240 min at 90% RH. The Supporting Information also displays this procedure (see Figure S.1). The sorption and desorption isotherms display the last point of each RH period versus the RH of a reference sensor located next to an empty reference holder.
2.3. Electrochemical Characterization
CV and EIS assessed the electrochemical performance of the samples. All measurements were performed in a three-electrode setup with an in-house developed flow cell36 and an SP-300 potentiostat (BioLogic Science Instruments). The samples were cut into rectangular pieces (0.9 cm × 1.0 cm) and placed in the WE position of the flow cell. The WE was contacted by a gold foil (0.25 mm, 99.9975+%, Alfa Aesar) and a gold wire (Ø 0.5 mm, 99.9975+%, Alfa Aesar) when measuring in the potential range of the vanadium(IV)/vanadium(V) reaction (positive half-cell setup). The contacts were changed to a titanium foil (1.0 mm, 99.2%, Alfa Aesar) and a titanium wire (Ø 0.28 mm, Alfa Aesar) when studying the vanadium(II)/vanadium(III) reaction (negative half-cell setup) since gold is known to catalyze the HER at negative potentials.45 In all experiments, an in-house developed hydrogen RE was used as the RE, and carbon felt (SIGRACELL GFA 6 EA, SGL Carbon, thermally activated, 2.5 cm × 2.5 cm) was employed as the CE. The CE was contacted with a titanium foil and either a gold wire in the positive half-cell setup or a titanium wire in the negative half-cell setup.
The CVs were conducted at room temperature with a scan rate of 2 mV s–1 while no flow was applied. The potential limits were adapted for each sample to completely cover the peaks from the potential scans in both directions. The vanadium(IV) electrolyte was used for the positive half-cell studies, and the vanadium(II) electrolyte was used for the negative half-cell studies. The peak heights and transferred charge were determined in the positive half-cell using a linear baseline fitted to the linear area before peak onset. A linear baseline fit was not possible in the negative half-cell due to the overlap with the HER. Thus, the peak area and height were determined with respect to the x-axis (y = 0 mA).
EIS further characterized the wettability and processes in the positive half-cell using the positive half-cell setup. The EIS measurements were performed in a frequency range from 100 kHz to 3.5 mHz at room temperature and at a flow rate of 15 mL min–1 to ensure steady-state conditions. The potentiostatic mode was used at an applied potential of 1.05 V vs RHE with a single sinusoidal excitation of 5 mV as the perturbation. The EIS data were further analyzed with a MATLAB-based DRT tool46 based on the Tikhonov regularization. The spectra were fitted with a Gaussian function for the discretization and a regularization parameter of 1 × 10⁻⁹. The inductive data were included in the fitting.
2.4. Synchrotron X-ray Imaging
The X-ray imaging experiments were performed at the Biomedical Imaging and Therapy Bending Magnet (BMIT-ID) 05ID-2 beamline at the Canadian Light Source, Inc. (Saskatoon, Saskatchewan, Canada).47 Thereby, the same imaging settings as in our previous publications were applied.31,35
The measurements were conducted in a three-electrode setup, which was presented in detail previously.35 A simple schematic of the cell setup, the electrolyte flow path, and the imaged area is also presented in the Supporting Information (see Figure S.2). The in-house developed cell housed the investigated WE and the CE, separated by a Nafion N117 membrane (The Fuel Cell Store). The Ag/AgCl RE (3 M NaCl, E = 0.209 V vs RHE at 25 °C) was positioned between the WE and the CE in the flow path. A thermally activated carbon felt (7.4 cm × 0.8 cm) served as the CE in all experiments. Furthermore, interdigitated flow fields for flow-by configuration were employed on both sides, and the carbon felts in the cell were compressed by 25%.
For these experiments, the measurement protocol included three processes: injection, flow, and hydrogen evolution. A detailed description of these processes can be found in a previous publication.35 In short, the electrolyte was injected into the electrode at 0.5 mL min–1 for 5 min during the injection process and at 30 mL min–1 for 1 min during the subsequent flow process. For the hydrogen evolution process, a potential of −0.5 V vs Ag/AgCl (−0.3 V vs RHE) was applied for 5 min. The processes were monitored by radiography.
The recorded radiograms were postprocessed according to previous publications,31,35 considering the beam decay48 during the measurement and the dark-field correction. The images represent an average of the last ten radiograms of the respective process divided by the background. For the injection and flow processes, the background corresponds to the average of the first 10 images (dry electrode) to quantify the absolute electrolyte saturation. For the HER process, the average of the first 10 images of this process was used and the changes in saturation during the process were studied. All images were dark and flat field corrected to account for changes in the beam intensity during the measurement. An adapted Beer–Lambert law was subsequently applied to determine quantitative electrolyte saturation values.35,49 This electrolyte’s mean X-ray attenuation coefficient at the given beam energy was previously calculated from measurements with a calibration device (μ = 0.554 cm–1 with R2 = 0.9999).35 Further, the saturation was locally resolved by dividing the radiograms into 20 vertical slices according to Köble et al. ranging from the flow field side (right, 0% relative thickness) to the membrane side (left, 100% relative thickness).31 The starting point of the injection process was set to the time with the first distinct increase in electrolyte saturation. The images displaying the injection process over time show time stamps, with respect to this starting point. The videos of the injection processes start at the respective point and display only every fourth image with a frame rate of 100 fps. This corresponds to 16 times the real-time speed of the process.
3. Results and Discussion
The three parts within this section show the changes in structure, wetting, electrochemical performance, and tendency toward the HER. Combining SEM, DVS, EIS, and CV with quantitative results from synchrotron X-ray radiography provides valuable insights into the changes caused by modifications and the advantage of combining these techniques for a thorough electrode characterization.
3.1. Electrode Characterization
SEM images were obtained to get a first visual impression of how the modifications alter the carbon felt’s structure. Figure 1 displays one representative fiber of each modified carbon felt and the thermally activated carbon felt for comparison. These fibers are located in the center of the carbon felt to ensure that the modifications reached all of the electrode areas. Since carbon felt materials are rather inhomogeneous, the thermally activated reference sample and the three modified samples also show significant variations throughout the felt. To show these variations, additional SEM images were conducted at other spots within the samples (see Supporting Information, Figure S.3). These include images at different magnifications from the center and the surface of the respective samples. The thermally activated carbon felt shows a fiber consisting of bundled strings, a structure previously observed in the literature.6,13,14,50 The traditional thermal activation process introduces pores of various sizes in the individual strings and strongly roughens the surface, causing an increased surface area.13,50 The amount and size of pores and the roughness vary throughout the felt, as shown by the additional images in the Supporting Information (Figure S.3). The modification with POT strongly alters the original fiber structure by (partially) clogging the pores and wrapping around parts or the whole carbon fiber. However, the deposition varies throughout the material; some fibers are entirely coated with the polymer, whereas uncoated parts remain in other carbon fibers, as highlighted in Figures 1 and S.3 in the Supporting Information. The other modified samples with Fe–N–C + CNT and Vulcan XC 72R were prepared via an impregnation process and thermally activated afterward. The additional material does not coat the surface homogeneously but deposits as agglomerations with no particular shape. The deposits of Fe–N–C + CNT have a fibrous structure due to the CNTs, whereas the Vulcan XC 72R deposits have a porous sponge-like morphology with aggregated spherical particles, as previously observed in the literature.51 These observations imply that the impregnation procedure worked, and the agglomerations also coated the inner part of the carbon felt with the respective material. However, the amount of deposits varies throughout both materials with larger and more deposits on the fibers located at the material’s surface (see Supporting Information, Figure S.3). It should also be noted that the deposits are not perfectly glued to the fibers since black particles were noticed after some time in the respective storage bags.
Figure 1.

Top-down SEM images of carbon fibers from the center of the thermally activated carbon felt without modification and carbon felts modified with POT, Fe–N–C + CNT, and Vulcan XC 72R.
Overall, this section shows that all of the modification processes were successfully performed. The POT wraps around the fibers and covers them partially or entirely, whereas the impregnation method causes randomly distributed agglomerations of Fe–N–C + CNT and Vulcan XC 72R with various sizes on the carbon fibers.
3.2. Analysis of Wetting Behavior
3.2.1. Dynamic Vapor Sorption
In addition to visual impressions, the wettability of the carbon felts was studied by DVS measurements. The wettability of electrodes is crucial for VRFBs since electrolytes are pumped through the electrode during operation. The DVS results help us understand the electrolyte distribution and saturation observed during synchrotron X-ray imaging, which will be discussed in the following section. DVS thereby analyzes the bulk property of the sample and gives information about the samples’ averaged sorption/desorption behavior. Figure 2 displays the sorption and desorption isotherms of the thermally activated and modified samples. The respective measurement data and the applied measurement protocol can be found in the Supporting Information (see Figure S.1).
Figure 2.

(a) Water vapor sorption and desorption isotherms of the thermally activated carbon felt and the modified samples conducted at 25 °C. (b) Zoom in on the data, excluding the POT-modified carbon felt. (c) Schematic display of the carbon fiber surface changes during the electropolymerization of o-toluidine.
Figure 2a shows that the carbon felt modified with POT shows a significantly enhanced water uptake, whereas the samples modified with Fe–N–C + CNT and Vulcan XC 72R seem to adsorb a similar amount of water vapor as the activated carbon felt. However, zooming in on the graph (Figure 2b) shows differences between the remaining three materials. Compared to the unmodified material, which has a maximum water uptake of 0.8 wt % at 90% RH, the samples modified with Fe–N–C + CNT and Vulcan XC 72R adsorb maximally 1.3 and 0.7 wt %, respectively. The increased water uptake with Fe–N–C + CNT might be explained by adding iron and nitrogen into the system, which exhibit good wettability.52−54 Publications on the wettability of Fe–N–C type catalysts show varying results for these materials,55,56 probably stemming from different carbon precursors and synthesis methods. In contrast, carbon powders such as Vulcan XC 72R are known for their hydrophobicity, and the literature shows a rather low sorption capacity and high contact angles.57,58 This explains the slight decrease in water uptake. The sigmoidal shape of all three samples represents a type V sorption isotherm.59 Here, the interaction between the sample and the adsorbent is relatively weak, which causes only a slight water uptake at low RHs and no identifiable monolayer adsorption, as observed for other carbon-based materials.57,60 The water vapor will only interact with the material’s favorable polar sites, causing relatively low water sorption at low RHs due to a shortage of possible interaction sites.57,60−62 At higher RHs, an exponential increase in water uptake is observed, which can be ascribed to interactions between the adsorbed water molecules. The strong hydrogen bonding between the water molecules leads to molecular clustering and pore-filling.57,59−62 Compared to the modification with Vulcan XC 72R, the onset of this exponential increase is shifted to lower RHs for the unmodified carbon felt and the sample modified with Fe–N–C + CNT. Furthermore, the slopes of their sorption curves are steeper, underlining the enhanced sorption ability of these samples. In addition, all three of these samples show a difference between the sorption and desorption curves with a hysteresis loop characteristic of the H2 type. The delayed desorption of the adsorbent is usually caused by strong interactions, capillary condensation in the pore space, and subsequent pore-blocking.59,62 Here, the strong hydrogen bonding between the water molecules and the pore structure impedes desorption and consequently causes a deviation from the sorption behavior. Compared to these three samples, the POT-modified carbon felt has a significantly higher water uptake of 80.9 wt % at 90% RH. This effect must be caused by the sulfuric acid used during the deposition via an electropolymerization process, which is schematically displayed in Figure 2c. Another study from our group also observed that the carbon felt’s water uptake increased significantly after a soaking procedure in sulfuric acid or electrochemical aging in vanadium electrolyte based on sulfuric acid.63 Furthermore, we prepared a reference sample without POT by mimicking the conditions during the electropolymerization process without the o-toluidine monomer in the electrolyte. This reference sample was in contact with the diluted sulfuric acid, and a CV was conducted in the same potential range. As shown in the Supporting Information, the maximum water uptake of 87.9 wt % is even higher than the POT-modified sample (see Figure S.1). Thus, the conditions during the electropolymerization cause higher water uptake, and the POT deposits have no positive influence on the material’s wettability. The SEM images of fibers from the POT-modified carbon felt showed that some fibers are completely coated with POT, whereas other fibers are not or are only partially coated and will therefore behave like the unmodified carbon fiber. The oxidative environment of the acid, in combination with the applied potential during electropolymerization, will introduce oxygen functional groups (see schematic display of changes during electropolymerization in Figure 2c), which are known to improve the water vapor sorption capacity by offering additional polar sites.6,64 Thus, the bulk sorption increases significantly due to sulfuric acid and the applied potential. For this sample, it should also be considered that the sorption and desorption curve did not reach an equilibrium at 80% RH and above due to the short measurement time (see Supporting Information, Figure S.1a). Thus, the water uptake at these RHs would even be higher if the measurement duration had been longer. The same behavior was observed for the reference sample without POT. The ogee curve shape differs from the other samples and is more characteristic of a type II isotherm with a rather gradual curvature at low RHs.59 In this case, water uptake can already be observed at low RHs, which can be explained by an abundance of polar sites for possible hydrogen bonding with water vapor.62,64 This monolayer adsorption then overlaps with the subsequent multilayer adsorption causing no distinctive point of complete monolayer coverage, but a rather gradual curvature.59 The shape at higher RH values is similar to the other samples and caused by the strong hydrogen bonding between water molecules.57,61 The missing hysteresis loop can probably be ascribed to fewer or smaller pores in the material, preventing pore-blocking due to capillary condensation.59,62
3.2.2. Synchrotron X-ray Imaging of Electrolyte Injection and Flow
Using DVS measurements, the average sorption behavior of the thermally activated carbon felt and the influence of different modifications were investigated. We conducted X-ray radiograms during electrolyte injection at a flow velocity of 0.5 mL min–1 to further analyze how the electrolyte invades and distributes in the carbon felt. Figure 3 displays postprocessed X-ray radiograms from the injection process, which show the imbibition of the vanadium electrolyte (bright color) into the carbon felt. The first row corresponds to 10 s after the first increase in electrolyte saturation, whereas the other two images show representative time stamps for each sample. The Supporting Information includes a video displaying the injection process for all four samples (Video V1). The electrolyte inlet of the cell is located outside the imaged area. Thus, the electrolyte invasion herein does not include the inlet but shows the electrolyte propagation in the electrode’s center part.
Figure 3.

Postprocessed X-ray radiograms of the vanadium electrolyte (bright color) imbibition into the unmodified and modified samples at different time stamps during the injection process.
At first glance, it is evident that the injection behavior of the three modified samples differs substantially from that of the unmodified sample. It must be considered that the same cell with the same flow field and membrane, and the same flow velocity and compression ratio were used in all measurements. Thus, differences in the injection related to these components and conditions, which were previously observed in other publications,31,34,35,65,66 can be excluded. A higher compression would hinder the electrolyte invasion since the sample’s porosity and the vanadium ions’ diffusivity are reduced.67 This leads to higher pumping losses since higher delivery pressures are necessary. The type of flow field and material can also impact the electrolyte invasion strongly since they can offer additional pathways for the electrolyte in a flow-by configuration or force the electrolyte directly into the electrode in a flow-through configuration.31,35 Furthermore, higher flow velocities lead to higher pressure drops; thus, impacting the electrolyte distribution.66
The unmodified sample displays two favored paths for the electrolyte close to the center of the carbon felt. This behavior was previously discussed31 and can be attributed to the generation of two so-called ’highway’ channels, filled first by the node-to-node transport of the electrolyte.27 Subsequently, the electrolyte slowly spreads sideways in a fingering manner to fill adjacent smaller pores.5,31 The delayed filling of the center part was explained by a seam in the middle of the carbon felt with smaller pore sizes, which impedes electrolyte spreading. The slight tilt in the lateral spreading is caused by the compression of the carbon felt,31,34,67 which alters the fiber alignment and, consequently, the electrolyte transport along the fibers. The final electrolyte saturation of all samples after the 5 min injection process is depicted in Figure 4, divided into the bulk saturation corresponding to 15 to 85% relative thickness (Figure 4a) and the locally resolved saturation (Figure 4b). It shows that the electrolyte is distributed uniformly for the unmodified sample, with a slight drop in saturation due to the seam mentioned before. The lower saturation on the left can be ascribed to the membrane and the gasket located in the analyzed part, as visible in Figure 4c. The bulk saturation amounts to 90% after the injection period. Contrarily to this sample, the invasion of all modified carbon felts seems to start on the left or right side, which are the areas next to the membrane or the flow field, respectively. These parts represent the respective carbon felt top and bottom. An inhomogeneity within all samples might cause the electrolyte to imbibe preferably into these parts. The modification of the samples is performed in a solvent, via either an electropolymerization (POT) or an impregnation process (Fe–N–C + CNT and Vulcan XC 72R). The solvent must completely penetrate the material in all three cases to produce a homogeneous coating within the carbon felt. However, the outer areas of the carbon felt are more exposed to the respective mixtures, and the samples must be placed on one side during drying. Even though the SEM images showed modified parts in the center, significant material variations were observed and a higher amount of material deposits could be detected at the surface of the samples modified with Fe–N–C + CNT and Vulcan XC 72R (see Figure S.3). The modification processes influence the material deposits’ distribution and lead to different wetting behaviors within the modified carbon felts. Furthermore, the electrolyte invasion in all modified samples seems to proceed more slowly in the beginning compared to the unmodified sample, which reaches a steady electrolyte distribution after 170 s. The POT-modified sample shows nearly no electrolyte invasion even 10 s after the starting point. After a few more seconds, one preferred pathway to the top of the field of view establishes close to the membrane, and simultaneously, the electrolyte spreads out sideways in a fingering manner but does not fill the flow fields. The final electrolyte distribution is only reached after 220 s, and the locally resolved saturation in Figure 4b shows that a large part next to the flow field only reaches 70% electrolyte saturation. The overall saturation remains low, with a bulk saturation of only 82% after the injection. Comparing these results to the sorption behavior determined from DVS measurements shows that both methods elucidate different aspects of the wetting and permeation behavior. The DVS results showed that the POT-modified sample adsorbs the highest amount of water vapor but the injection of the carbon felt proceeds slowly and does not nearly reach 100% electrolyte saturation. The inhomogeneity of the sample and the differences in media of both methods (water vapor vs vanadium electrolyte) might explain the discrepancies. During the injection, the POT deposits might block the electrolyte transport, which slows the invasion and renders parts of the sample less accessible. Even though other parts might be significantly more hydrophilic due to their functional groups from oxidation in sulfuric acid, they cannot be reached by the vanadium electrolyte, since POT deposits block their access. DVS measurements cannot differentiate these effects and only provide averaged information on the water vapor sorption behavior. The other two modified samples with Fe–N–C + CNT and Vulcan XC 72R invade the carbon felt from the bottom left. Like the other samples, they do not use the flow field channels but spread within the material. This observation shows that the interdigitated graphite flow fields are not the preferable pathway in all measurements, which their high hydrophobicity can explain. The wettability of all samples seems to be sufficient to ensure that the electrolyte preferably enters the carbon felt electrodes directly instead of using the small channels within the flow fields, which probably require higher delivery pressures of the electrolyte. The Fe–N–C + CNT-modified carbon felt is invaded quickly via one ‘highway’ channel to the top, and the remaining parts are filled by a sideways fingering which can be observed in the images in Figure 3. However, the sideways movement is significantly impeded, which might be caused by the seam in the sample located at around 40% relative thickness. A steady electrolyte distribution is observed after 170 s. The carbon felt reached a slightly higher bulk saturation of 95% compared to 90% within the unmodified sample. The locally resolved saturation in Figure 4b shows a distinct drop in saturation close to the membrane, which shows that the boundary region is not filled. The sample modified with Vulcan XC 72R also takes 160 s for a steady electrolyte distribution but shows only a saturation of 85% in the bulk and a lower electrolyte saturation on the left side close to the membrane. The electrolyte invasion proceeds via two ‘highway’ channels close to the flow field. The part close to the membrane is filled afterward, and the area at around 40% relative thickness is filled later, which seems to be due to the seam in the carbon felt. All modified samples do not fill up in one of the boundary regions close to the flow field (POT) or the membrane (Fe–N–C + CNT and Vulcan XC 72R) but reach a constant electrolyte saturation at the end of the injection process. This observation implies that these areas require higher entry pressures and therefore higher flow rates. However, higher delivery pressures are detrimental to the overall battery efficiency due to increased pumping losses.
Figure 4.

Calculated (a) bulk saturation and (b) locally resolved saturation of the unmodified carbon felt and the modified samples at the end of the electrolyte injection process. (c) Postprocessed X-ray radiograms of the vanadium electrolyte (bright color) distribution at the end of the injection process.
In a subsequent flow process, we increased the flow velocity to 30 mL min–1 for 1 min to fill these areas with higher entry pressures. The detailed results of the bulk saturation, the locally resolved saturation, and the electrolyte distribution after this process are displayed in the Supporting Information (see Figure S.4). Generally, the unfilled areas of all samples are mostly filled during this process, which can be ascribed to the higher flow velocity, helping to overcome the higher entry pressures of specific areas. In a recent publication, Zhang et al. observed a similar behavior and concluded that higher flow velocities are often necessary to remove bubbles in the electrode volume and fill up the electrode completely.66 Herein, the saturation of the unmodified sample increased from 90 to 93% but showed a significant drop between 90 and 95% relative thickness, ascribed to the membrane and the surrounding gaskets. The POT-modified sample also shows a slight increase in bulk saturation from 82 to 88%. However, the saturation remains relatively low compared to that of the other samples, which might be caused by the polymeric deposits on the carbon fibers hindering the electrolyte transport within the material. The samples modified with Fe–N–C + CNT and Vulcan XC 72R show an increased bulk saturation of 104 and 101%, respectively. These values exceed the optimum saturation of 100% due to several assumptions made for the calculation. These include assuming a homogeneous sample with a uniform porosity, a uniform sample compression, no change in porosity compared to the pristine sample, and a similar beam decay throughout the whole field of view. Still, there is a significant difference compared with the other samples.
In summary, DVS measurements combined with synchrotron X-ray imaging of the electrolyte invasion and distribution in the carbon felt can help to study carbon felts’ wettability and permeation behavior. The rather simple DVS measurements provided an averaged value of the sorption capacity and showed significantly higher wettability of the POT-modified sample, which could be ascribed to the conditions during electropolymerization. On the contrary, the more complex synchrotron imaging revealed that parts of the modified carbon felt are hard to invade and only fill up at higher flow velocities, providing significant insights into the electrolyte distribution and the delivery pressures necessary for successful flow operation. Furthermore, the modification with POT is less beneficial and leads to low electrolyte saturation, whereas Fe–N–C + CNT improves electrolyte filling.
3.3. Electrochemical Performance
3.3.1. Electrochemical Impedance Spectroscopy
In addition to the measurements previously presented, EIS can provide significant insights into the various processes occurring in the system. In this study, we adapt the characterization method from Schilling et al. using DRT analysis to analyze the impedance data further.36 The DRT spectrum of a three-electrode setup in vanadium(IV) electrolyte with carbon electrodes as the WE has three regions: one high-frequency peak corresponding to the electrochemical reaction, the medium-frequency range with resistances caused by the transport through the porous structure of the electrode, and a low-frequency peak assigned to the ion transport.36 Herein, these features can be observed below 35 mHz, from 35 mHz to 400 Hz, and above 400 Hz, respectively.
Figure 5a displays the raw EIS data of all measured samples with an inset zooming in on the high-frequency region. Compared to the unmodified sample, the total impedance of the carbon felts modified with POT, and Vulcan XC 72R is strongly increased. Contrarily, Fe–N–C + CNT slightly improves the performance. All samples display at least two distinct semicircles in the EIS spectra and peaks in the previously assigned ranges of the DRT spectra (see Figure 5b). Without modification, the EIS spectrum shows a total impedance of 10.1 Ω and two superimposed semicircles: one at high frequency and a second tilted one in the medium-frequency range. In addition, impedances at lower frequencies can be measured. In the DRT spectrum, these features are separated into one peak at low frequency (≈20 mHz, 5.8 Ω), four peaks in the medium-frequency range (4.0 Ω), and another peak at high frequency (≈620 Hz, 0.3 Ω). Compared to the other samples, the peak at around 20 mHz is shifted to a higher frequency, indicating unhindered ion transport. In contrast, the peak at a high frequency is shifted to a lower frequency. This implies that the electrochemical reaction is slightly slower for the unmodified sample, indicating the positive impact of the modification on the electrochemical reaction. The sample modified with Fe–N–C + CNT shows minor impedance decreases compared to that of the unmodified sample. The total impedance is slightly lower at 6.7 Ω, especially due to the two semicircles at high and medium frequency, which only cause resistances of 0.1 and 1.5 Ω, respectively. Both semicircles are smaller compared to the unmodified sample, indicating improved transport properties. This observation also correlates with an improved electrolyte invasion, as the bulk saturation is the highest of all samples after the electrolyte injection presented in Figure 4. The intercept of this sample is shifted to the right by about 1.6 Ω. This feature is not observed in the other measurements and must be caused by an increase in the ohmic resistance, which shifts the EIS curve along the x-axis.7,33 Most likely, the electrical contact within the system is worse than in the other measurements. This minor difference might be caused by the cell assembly or the lower conductivity of the sample. The solution resistance should be constant since the same electrolyte was used in all measurements. Vulcan XC 72R and POT increase the impedance of the carbon felt significantly with total impedances of 38.6 and 43.4 Ω, respectively. These values are around four times the impedance of the unmodified sample, implying that both modifications severely and detrimentally change the electrode structure and the processes. The main contributions to the substantial impedance increases are the low- and medium-frequency processes. The second semicircle in the Nyquist plot is significantly enlarged for both samples. A medium-frequency impedance of 20.7 Ω with POT and 20.4 Ω with Vulcan XC 72R shows that transport through the porous electrode structure is strongly hindered. These observations agree with those in the previous section in which both samples showed problematic electrolyte injection behavior. The POT sample exhibited the lowest bulk electrolyte saturation and had the highest medium-frequency impedance, whereas the sample with Vulcan XC 72R has a slightly higher bulk saturation, correlating to a slightly decreased impedance in the respective frequency range. The impedance at high frequency is usually negligibly small, although the semicircle in the POT-modified sample is visibly more prominent, and an impedance of 1.0 Ω was determined from the DRT analysis. Thus, the reaction for this modified felt is hampered most likely by unreactive POT deposits on the fiber surface. In contrast, the high-frequency impedance with Vulcan XC 72R is slightly improved, indicating that the catalytic activity for the vanadium reaction is not the problematic factor for this sample, but the major impedance increase is associated with the transport processes. These results show an impressive correlation to the electrolyte injection experiment imaged via synchrotron X-ray radiography. The second semicircle in the medium-frequency range indicates the ability of the samples to undergo unhindered electrolyte injection. The lower the related impedance, the higher the electrolyte saturation after the monitored injection process.
Figure 5.

(a) Nyquist plot from EIS measurements of the thermally activated carbon felt without modification and the modified samples (inset: zoomed in on high frequencies) and (b) the corresponding DRT spectra. The measurements were conducted in 0.1 M VOSO4 in 2 M H2SO4 at a potential of 1.05 V vs RHE at a flow rate of 15 mL min–1, applying a perturbation of 5 mV.
3.3.2. Cyclic Voltammetry
In addition to the evaluation via EIS coupled with DRT analysis, the electrochemical performance of the samples was assessed by CV. The CVs are displayed in Figure 6. Both the vanadium(IV)/vanadium(V) redox reaction in the positive half-cell and the vanadium(II)/vanadium(III) redox reaction in the negative half-cell were studied to get an impression of how the modifications influence the performance in each half-cell.
Figure 6.
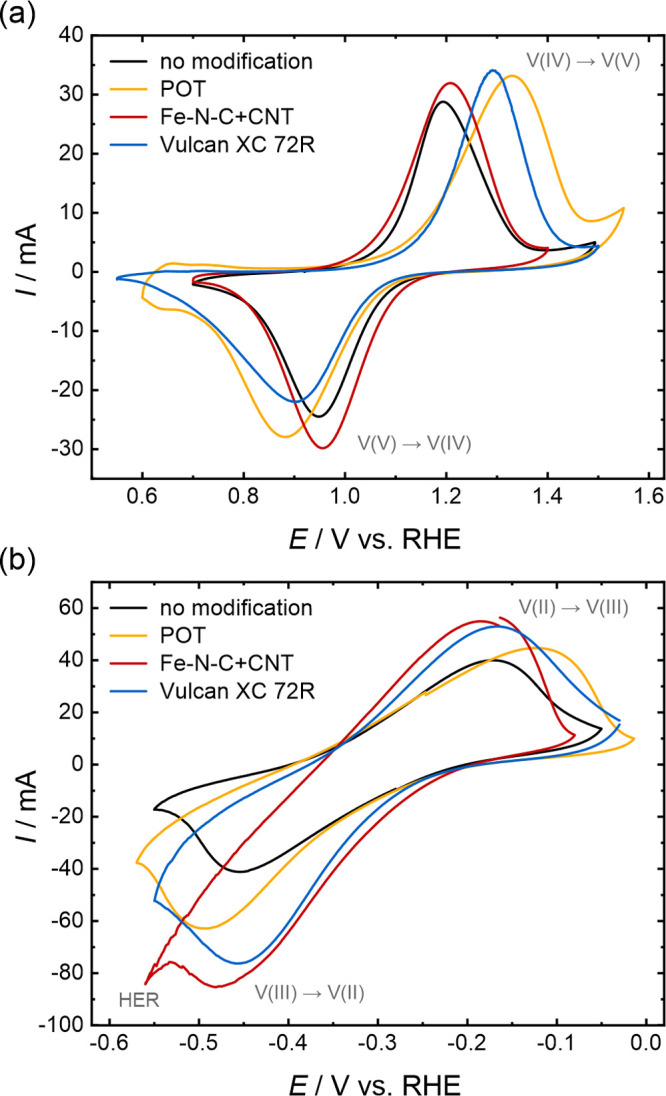
CV measurements of the thermally activated carbon felt without modification and the modified samples conducted in a three-electrode setup in 0.1 M VOSO4 in 2 M H2SO4 at a scan rate of 2 mV s–1 in (a) the positive half-cell (vanadium(IV) electrolyte) and (b) the negative half-cell (vanadium(II) electrolyte).
The CVs in the positive half-cell (Figure 6a) were measured in the same setup as the previous EIS measurements. The peak-to-peak separation, the peak current, and the charge ratio (cathodic over anodic peak) were calculated for the analysis. All samples display peaks for the vanadium(IV) oxidation to vanadium(V) in the positive sweep and the reverse reaction in the negative sweep, implying that both reactions occur. It should be mentioned that the peak currents are not normalized to a specific area or volume. The same sample size was used for all measurements but the amount of material within this volume will differ slightly due to the modifications that influence the measured currents. The peak-to-peak separation increases from 0.24 V for the unmodified sample to 0.45 and 0.39 V after the modification with POT and Vulcan XC 72R, respectively. Additionally, the peak current ratios and the charge ratios decrease, and the onset of the vanadium(IV) oxidation reaction shifts to higher potentials, whereas the onset of the vanadium(V) reduction reaction shifts to lower potentials. This implies a limited redox reaction reversibility and an impeded electron transfer. At low potentials of around 0.65 V vs RHE, the onset of an additional peak can be observed with the POT-modified sample and ascribed to the POT deposits. POT is known to undergo redox reactions between its leucoemeraldine, emeraldine, and pernigraniline forms.15,16,68 Compared with the unmodified carbon felt, Fe–N–C + CNT slightly improves the performance, in agreement with our EIS results. A peak current ratio of 0.89 is higher, and a peak-to-peak separation of 0.25 V is nearly identical to that of the unmodified sample (0.85 and 0.24 V). The slightly lower charge ratio of 0.83, compared to 0.88 for the unmodified sample, suggests that the Fe–N–C + CNT material favors vanadium(IV) oxidation in this redox couple. Furthermore, the peak onset is shifted to lower potentials for vanadium(IV) oxidation and to higher potentials for vanadium(IV) reduction, implying a facilitated electron transfer. Thus, this type of material not only improves the wettability and electrolyte saturation compared to the unmodified sample but also leads to slightly improved electrochemical performance in the positive half-cell reaction and might therefore be a promising candidate for the positive half-cell of VRFBs.
The CVs of the negative half-cell are displayed in Figure 6b. It has to be considered that the potential range of the HER overlaps significantly with the vanadium(II)/vanadium(III) redox reaction, which explains the increased negative currents in the negative sweep compared to the positive scan.42 For this half-cell, the peak current and charge ratios were calculated with the anodic peak over the cathodic peak to underline the share of the HER. The currents of all modified samples are generally slightly higher than with the unmodified carbon felt, especially the cathodic currents in the scan toward more negative potentials, during which the HER and the vanadium(III) reduction occur simultaneously.38,42 However, compared to the unmodified sample (0.28 V), the peak-to-peak separation increases only slightly with the addition of Vulcan XC 72R (0.29 V) and Fe–N–C + CNT (0.30 V) and strongly after POT deposition (0.37 V). Furthermore, the peak current and charge ratios differ significantly from the nearly ideal values of 0.97 and 1.02 determined for the unmodified carbon felt. Thus, the vanadium(II)/vanadium(III) reaction is less reversible after modification. The worst performance is observed for Fe–N–C + CNT with a charge ratio of only 0.65, which indicates significantly increased cathodic currents. Since the curve becomes noisy and drops substantially at low potentials, the difference in charge might mainly be ascribed to the HER, whose bubble formation within the cell will cause fluctuations in the electrical contact. The charge ratio of the POT-modified sample (0.83) is the second best after that of the unmodified sample. It seems that POT causes the reaction to be less reversible but impedes both the vanadium(II)/vanadium(III) redox reactions and the HER. Thus, this material seems less electrochemically active in the VRFB reactions.
3.3.3. Synchrotron X-ray Imaging of the HER
To study the HER in more detail, synchrotron X-ray radiography was performed while a negative potential of −0.3 V vs RHE was applied to the WE in a three-electrode setup. For this analysis, the electrode filled with electrolyte after the flow process (see the previous section) was used as the background image. Thus, the obtained values represent the changes in saturation during the HER process. Analogously to the other X-ray images, Figure 7 shows the saturation changes in the bulk (between 15 and 85% relative thickness) and locally resolved, and the respective background-divided radiograms display the generated bubbles.
Figure 7.

Calculated change in (a) bulk saturation and (b) locally resolved saturation of the unmodified carbon felt and the modified samples during the HER process. (c) Postprocessed X-ray radiograms of the bubbles (bright color) generated during the HER process.
The unmodified carbon felt shows a constant change in saturation over the entire field of view, suggesting that there are no preferred areas for bubble formation. The bulk saturation decreases slightly by −1.1%. The POT modification reduces the bubble formation slightly, with a change of −0.6% in saturation. However, the most significant areas of bubble formation are at the borders next to the membrane and the flow field. Similar to the behavior during the injection, these outer parts of the carbon felt behave differently due to immersion in the respective deposition mixture. In the center of the carbon felt, the changes in saturation are negligibly small, which might be explained by the reduced electrochemical activity of the POT deposits in all electrochemical reactions. Similar behavior was observed for the carbon felts modified with Vulcan XC 72R or Fe–N–C + CNT. Both display the most severe bubble formation at the borders, close to the membrane on the left side. The bulk saturation with Vulcan XC 72R decreased by −1.9%. Since the change in saturation in the center part of this sample is very similar to the unmodified sample, mainly the outer parts contribute to the more significant bubble formation. The most significant change in saturation is observed with Fe–N–C + CNT. A drop in bulk saturation by −5.1% and close to −25% between 90 and 95% relative thickness shows that this sample is prone to the HER. The same trend of more severe bubble formation close to the border region can again be explained by the modification via the immersion procedure. Nonetheless, even the center part of this sample exhibits enhanced HER activity with a −5% change in saturation. This substantial bubble evolution supports the previous observations from CVs in the negative half-cell, which showed a significant drop at low potentials corresponding to the HER and a noisy curve, which we attributed to bubble formation causing fluctuations in the electrical contact. Metallic iron is an excellent catalyst for the HER in acidic media,45 and previous publications on Fe–N–C materials showed that this material could also be used as an HER catalyst.69,70 The results herein agree with these observations and suggest that the Fe–N–C + CNT material is unsuitable for improving the negative half-cell of VRFBs. However, it also demonstrates the strength of the synchrotron X-ray imaging technique to track hydrogen bubble formation in the electrode locally.
This section presents different insights into electrochemical performance and how it can be correlated to other measurements. The impedances from EIS coupled with DRT analysis supported the results from the analysis of the wetting and permeation behaviors with increased transport resistances for POT and Vulcan XC 72R. POT impedes the reactions of both VRFB half-cells, including the parasitic HER. Fe–N–C + CNT showed lower resistances and a slightly improved electrochemical performance than the unmodified material in the positive half-cell but a higher tendency toward the HER in the negative half-cell.
4. Conclusions
The electrolyte permeability, the catalytic activity, and the tendency to parasitic side reactions, particularly the HER, majorly impact the performance of carbon-based electrodes in VRFBs. Herein, we studied the influence of three different modifications: POT, Fe–N–C + CNT, and Vulcan XC 72R, on these crucial properties.
Initial characterization by SEM revealed that both the electropolymerization and the impregnation process successfully led to deposits of POT, Fe–N–C + CNT, and Vulcan XC 72R, even on fibers in the center of the electrode. However, the degree of modifications varies from fiber to fiber and between the center and the surface of the felt since the material is rather inhomogeneous.
POT exhibited the highest wettability in the DVS measurements with about 100 times higher water sorption capacity than the thermally activated sample, which can be ascribed to the conditions during electropolymerization and not to the POT material. However, this averaged wettability does not correlate to the reduced electrolyte saturation and the ∼5 times higher transport impedance determined by X-ray radiograms of the electrolyte distribution and EIS measurements. Vulcan XC 72R showed similar transport problems but also exhibited lower wettability. Both samples performed rather poorly during CV and seemed to impede the VRFB reactions. Thus, modification with these types of carbon-based materials is not beneficial for VRFB application. Fe–N–C + CNT showed promising results, particularly as an electrode in the positive half-cell of VRFBs. Compared to the unmodified sample, it slightly improved the water sorption capacity from 0.8 to 1.3 wt % and the electrolyte saturation after the injection procedure from 90 to 95%. Thus, the wettability and electrolyte permeability are improved. The overall resistance was slightly decreased, and the electrochemical performance in the positive half-cell’s vanadium(IV)/vanadium(V) reaction improved. However, severe HER due to the iron content was observed in the negative half-cell, demonstrating that an iron-based modification is unsuitable for the electrodes in the negative half-cell of VRFBs.
Overall, this study shows that different types of modifications can severely impact the wettability, the electrolyte permeation behavior, the electrochemical performance, and the HER tendency of carbon-based electrodes. The combination of DVS measurements, electrolyte invasion and distribution imaging, and EIS measurements coupled with DRT analysis provides alternative approaches to studying the electrodes’ wettability and electrolyte permeability. DVS can give an impression of the averaged sorption capacity of the samples, whereas EIS provides information on the transport resistance and X-ray imaging can locally resolve the electrolyte invasion and transport through the electrode. The transport processes, in particular, can be nicely followed with the impedances in the medium-frequency range (second semicircle in the Nyquist plot) correlating to the electrolyte saturation after the injection process. Furthermore, combining CV in the negative half-cell and X-ray radiographic imaging of the bubble evolution at negative potentials is an excellent approach to investigate the tendency toward the hydrogen evolution side reaction. This study demonstrates that combining synchrotron X-ray imaging with other physical and electrochemical characterization techniques is needed to investigate the critical properties of the VRFB electrodes. They are an essential tool kit to optimize the electrode design and material selection for developing efficient VRFBs.
Acknowledgments
The authors gratefully acknowledge SGL Carbon for the supply of SIGRACELL carbon felts. K.K. and M.S. gratefully acknowledge financial support through a Kekulé Ph.D. fellowship by the Fonds der Chemischen Industrie (FCI). The authors also gratefully acknowledge funding support from the Natural Sciences and Engineering Research Council of Canada (NSERC) Discovery Grant Program and the Canada Research Chairs Program. This study was further supported by Sergey Gasilov, Denise Miller, Adam Webb, Ning Zhu, and the Biomedical Imaging and Therapy (BMIT) beamline staff. The research described in this paper was performed at the Canadian Light Source, which is supported by the Canada Foundation for Innovation, Natural Sciences and Engineering Research Council of Canada, the University of Saskatchewan, the Government of Saskatchewan, Western Economic Diversification Canada, the National Research Council Canada, and the Canadian Institutes of Health Research. This work contributes to the research performed at CELEST (Center for Electrochemical Energy Storage Ulm-Karlsruhe).
Supporting Information Available
The Supporting Information is available free of charge at https://pubs.acs.org/doi/10.1021/acsami.3c07940.
Time-resolved data of DVS measurements and applied measurement procedure; schematic of synchrotron X-ray imaging setup; additional SEM images of (modified) carbon fibers conducted at other spots within the sample; detailed analysis of synchrotron X-ray imaging of the flow procedure; snapshot from video of the electrolyte injection into all samples (Video V1) (PDF)
Video of the electrolyte injection into all samples (AVI)
Author Contributions
The manuscript was written through contributions of all authors. All authors have given approval to the final version of the manuscript.
The authors declare no competing financial interest.
Supplementary Material
References
- Gallo A. B.; Simões-Moreira J. R.; Costa H. K. M.; Santos M. M.; dos Santos E. M. Energy Storage in the Energy Transition Context: A Technology Review. Renewable Sustainable Energy Rev. 2016, 65, 800–822. 10.1016/j.rser.2016.07.028. [DOI] [Google Scholar]
- Alotto P.; Guarnieri M.; Moro F. Redox Flow Batteries for the Storage of Renewable Energy: A Review. Renewable Sustainable Energy Rev. 2014, 29, 325–335. 10.1016/j.rser.2013.08.001. [DOI] [Google Scholar]
- Lourenssen K.; Williams J.; Ahmadpour F.; Clemmer R.; Tasnim S. Vanadium Redox Flow Batteries: A Comprehensive Review. J. Energy Storage 2019, 25, 100844 10.1016/j.est.2019.100844. [DOI] [Google Scholar]
- Huang Z.; Mu A.; Wu L.; Yang B.; Qian Y.; Wang J. Comprehensive Analysis of Critical Issues in All-Vanadium Redox Flow Battery. ACS Sustainable Chem. Eng. 2022, 10 (24), 7786–7810. 10.1021/acssuschemeng.2c01372. [DOI] [Google Scholar]
- Bevilacqua N.; Eifert L.; Banerjee R.; Köble K.; Faragó T.; Zuber M.; Bazylak A.; Zeis R. Visualization of Electrolyte Flow in Vanadium Redox Flow Batteries Using Synchrotron X-Ray Radiography and Tomography – Impact of Electrolyte Species and Electrode Compression. J. Power Sources 2019, 439, 227071 10.1016/j.jpowsour.2019.227071. [DOI] [Google Scholar]
- Eifert L.; Banerjee R.; Jusys Z.; Zeis R. Characterization of Carbon Felt Electrodes for Vanadium Redox Flow Batteries: Impact of Treatment Methods. J. Electrochem. Soc. 2018, 165 (11), A2577–A2586. 10.1149/2.0531811jes. [DOI] [Google Scholar]
- Ghimire P. C.; Bhattarai A.; Lim T. M.; Wai N.; Skyllas-Kazacos M.; Yan Q. In-Situ Tools Used in Vanadium Redox Flow Battery Research—Review. Batteries 2021, 7 (3), 53 10.3390/batteries7030053. [DOI] [Google Scholar]
- Sun B.; Skyllas-Kazacos M. Modification of Graphite Electrode Materials for Vanadium Redox Flow Battery Application—I. Thermal Treatment. Electrochim. Acta 1992, 37 (7), 1253–1260. 10.1016/0013-4686(92)85064-R. [DOI] [Google Scholar]
- Le T. X. H.; Bechelany M.; Cretin M. Carbon Felt Based-Electrodes for Energy and Environmental Applications: A Review. Carbon 2017, 122, 564–591. 10.1016/j.carbon.2017.06.078. [DOI] [Google Scholar]
- Liu T.; Li X.; Zhang H.; Chen J. Progress on the Electrode Materials towards Vanadium Flow Batteries (VFBs) with Improved Power Density. J. Energy Chem. 2018, 27 (5), 1292–1303. 10.1016/j.jechem.2018.07.003. [DOI] [Google Scholar]
- Su Y.; Chen N.; Ren H.; Li C.; Guo L.; Li Z.; Wang X. Application of Modified Graphite Felt as Electrode Material: A Review. Carbon Lett. 2023, 33 (1), 1–16. 10.1007/s42823-022-00414-x. [DOI] [Google Scholar]
- Chakrabarti M. H.; Brandon N. P.; Hajimolana S. A.; Tariq F.; Yufit V.; Hashim M. A.; Hussain M. A.; Low C. T. J.; Aravind P. V. Application of Carbon Materials in Redox Flow Batteries. J. Power Sources 2014, 253, 150–166. 10.1016/j.jpowsour.2013.12.038. [DOI] [Google Scholar]
- Zhong S.; Padeste C.; Kazacos M.; Skyllas-Kazacos M. Comparison of the Physical, Chemical and Electrochemical Properties of Rayon- and Polyacrylonitrile-Based Graphite Felt Electrodes. J. Power Sources 1993, 45 (1), 29–41. 10.1016/0378-7753(93)80006-B. [DOI] [Google Scholar]
- Köble K.; Jaugstetter M.; Schilling M.; Braig M.; Diemant T.; Tschulik K.; Zeis R. Multimodal Characterization of Carbon Electrodes’ Thermal Activation for Vanadium Redox Flow Batteries. J. Power Sources 2023, 569, 233010 10.1016/j.jpowsour.2023.233010. [DOI] [Google Scholar]
- Sivakumar C.; Nian J.-N.; Teng H. Poly(o-Toluidine) for Carbon Fabric Electrode Modification to Enhance the Electrochemical Capacitance and Conductivity. J. Power Sources 2005, 144 (1), 295–301. 10.1016/j.jpowsour.2004.12.010. [DOI] [Google Scholar]
- Gvozdenović M. M.; Jugović B. Z.; Jokić B. M.; Džunuzović E. S.; Grgur B. N. Electrochemical Synthesis and Characterization of Poly(o-Toluidine) as High Energy Storage Material. Electrochim. Acta 2019, 317, 746–752. 10.1016/j.electacta.2019.06.046. [DOI] [Google Scholar]
- Advances in Electrochemical Sciences and Engineering. In Electrochemistry of Carbon Electrodes, 16th ed.; Alkire R. C.; Bartlett P. N.; Lipkowski J., Eds.; Wiley-VCH: Weinheim, Germany, 2015. [Google Scholar]
- Wan C. T.-C.; Barreiro D. L.; Forner-Cuenca A.; Barotta J.-W.; Hawker M. J.; Han G.; Loh H.-C.; Masic A.; Kaplan D. L.; Chiang Y.-M.; Brushett F. R.; Martin-Martinez F. J.; Buehler M. J. Exploration of Biomass-Derived Activated Carbons for Use in Vanadium Redox Flow Batteries. ACS Sustainable Chem. Eng. 2020, 8 (25), 9472–9482. 10.1021/acssuschemeng.0c02427. [DOI] [Google Scholar]
- Garcia M. J. S.; Santoro C.; Kodali M.; Serov A.; Artyushkova K.; Atanassov P.; Ieropoulos I. Iron-Streptomycin Derived Catalyst for Efficient Oxygen Reduction Reaction in Ceramic Microbial Fuel Cells Operating with Urine. J. Power Sources 2019, 425, 50–59. 10.1016/j.jpowsour.2019.03.052. [DOI] [PMC free article] [PubMed] [Google Scholar]
- Asset T.; Atanassov P. Iron-Nitrogen-Carbon Catalysts for Proton Exchange Membrane Fuel Cells. Joule 2020, 4 (1), 33–44. 10.1016/j.joule.2019.12.002. [DOI] [Google Scholar]
- Bevilacqua N.; Asset T.; Schmid M. A.; Markötter H.; Manke I.; Atanassov P.; Zeis R. Impact of Catalyst Layer Morphology on the Operation of High Temperature PEM Fuel Cells. J. Power Sources Adv. 2021, 7, 100042 10.1016/j.powera.2020.100042. [DOI] [Google Scholar]
- Santoro C.; Serov A.; Gokhale R.; Rojas-Carbonell S.; Stariha L.; Gordon J.; Artyushkova K.; Atanassov P. A Family of Fe-N-C Oxygen Reduction Electrocatalysts for Microbial Fuel Cell (MFC) Application: Relationships between Surface Chemistry and Performances. Appl. Catal., B 2017, 205, 24–33. 10.1016/j.apcatb.2016.12.013. [DOI] [PMC free article] [PubMed] [Google Scholar]
- Serov A.; Artyushkova K.; Atanassov P. Fe-N-C Oxygen Reduction Fuel Cell Catalyst Derived from Carbendazim: Synthesis, Structure, and Reactivity. Adv. Energy Mater. 2014, 4 (10), 1301735 10.1002/aenm.201301735. [DOI] [Google Scholar]
- Greco K. V.; Forner-Cuenca A.; Mularczyk A.; Eller J.; Brushett F. R. Elucidating the Nuanced Effects of Thermal Pretreatment on Carbon Paper Electrodes for Vanadium Redox Flow Batteries. ACS Appl. Mater. Interfaces 2018, 10 (51), 44430–44442. 10.1021/acsami.8b15793. [DOI] [PubMed] [Google Scholar]
- Rabbow T. J.; Trampert M.; Pokorny P.; Binder P.; Whitehead A. H. Variability within a Single Type of Polyacrylonitrile-Based Graphite Felt after Thermal Treatment. Part I: Physical Properties. Electrochim. Acta 2015, 173, 17–23. 10.1016/j.electacta.2015.05.020. [DOI] [Google Scholar]
- Gebhard M.; Schnucklake M.; Hilger A.; Röhe M.; Osenberg M.; Krewer U.; Manke I.; Roth C. X-Ray-Computed Radiography and Tomography Study of Electrolyte Invasion and Distribution inside Pristine and Heat-Treated Carbon Felts for Redox Flow Batteries. Energy Technol. 2020, 8 (3), 1901214 10.1002/ente.201901214. [DOI] [Google Scholar]
- Tariq F.; Rubio-Garcia J.; Yufit V.; Bertei A.; Chakrabarti B. K.; Kucernak A.; Brandon N. Uncovering the Mechanisms of Electrolyte Permeation in Porous Electrodes for Redox Flow Batteries through Real Time in Situ 3D Imaging. Sustain. Energy Fuels 2018, 2 (9), 2068–2080. 10.1039/C8SE00174J. [DOI] [Google Scholar]
- Tan R.; Wang A.; Malpass-Evans R.; Williams R.; Zhao E. W.; Liu T.; Ye C.; Zhou X.; Darwich B. P.; Fan Z.; Turcani L.; Jackson E.; Chen L.; Chong S. Y.; Li T.; Jelfs K. E.; Cooper A. I.; Brandon N. P.; Grey C. P.; McKeown N. B.; Song Q. Hydrophilic Microporous Membranes for Selective Ion Separation and Flow-Battery Energy Storage. Nat. Mater. 2020, 19 (2), 195–202. 10.1038/s41563-019-0536-8. [DOI] [PubMed] [Google Scholar]
- Ye C.; Wang A.; Breakwell C.; Tan R.; Bezzu C. G.; Hunter-Sellars E.; Williams D. R.; Brandon N. P.; Klusener P. A. A.; Kucernak A. R.; Jelfs K. E.; McKeown N. B.; Song Q. Development of Efficient Aqueous Organic Redox Flow Batteries Using Ion-Sieving Sulfonated Polymer Membranes. Nat. Commun. 2022, 13 (1), 3184 10.1038/s41467-022-30943-y. [DOI] [PMC free article] [PubMed] [Google Scholar]
- Melke J.; Martin J.; Bruns M.; Hügenell P.; Schökel A.; Isaza S. M.; Fink F.; Elsässer P.; Fischer A. Investigating the Effect of Microstructure and Surface Functionalization of Mesoporous N-Doped Carbons on V 4+ /V 5+ Kinetics. ACS Appl. Energy Mater. 2020, 3 (12), 11627–11640. 10.1021/acsaem.0c01489. [DOI] [Google Scholar]
- Köble K.; Eifert L.; Bevilacqua N.; Fahy K. F.; Bazylak A.; Zeis R. Synchrotron X-Ray Radiography of Vanadium Redox Flow Batteries – Time and Spatial Resolved Electrolyte Flow in Porous Carbon Electrodes. J. Power Sources 2021, 492, 229660 10.1016/j.jpowsour.2021.229660. [DOI] [Google Scholar]
- Jervis R.; Brown L. D.; Neville T. P.; Millichamp J.; Finegan D. P.; Heenan T. M. M.; Brett D. J. L.; Shearing P. R. Design of a Miniature Flow Cell for in Situ X-Ray Imaging of Redox Flow Batteries. J. Phys. D: Appl. Phys. 2016, 49 (43), 434002 10.1088/0022-3727/49/43/434002. [DOI] [Google Scholar]
- Gandomi Y. A.; Aaron D. S.; Houser J. R.; Daugherty M. C.; Clement J. T.; Pezeshki A. M.; Ertugrul T. Y.; Moseley D. P.; Mench M. M. Critical Review—Experimental Diagnostics and Material Characterization Techniques Used on Redox Flow Batteries. J. Electrochem. Soc. 2018, 165 (5), A970–A1010. 10.1149/2.0601805jes. [DOI] [Google Scholar]
- Jervis R.; Kok M. D. R.; Neville T. P.; Meyer Q.; Brown L. D.; Iacoviello F.; Gostick J. T.; Brett D. J. L.; Shearing P. R. In Situ Compression and X-Ray Computed Tomography of Flow Battery Electrodes. J. Energy Chem. 2018, 27 (5), 1353–1361. 10.1016/j.jechem.2018.03.022. [DOI] [Google Scholar]
- Eifert L.; Bevilacqua N.; Köble K.; Fahy K.; Xiao L.; Li M.; Duan K.; Bazylak A.; Sui P.; Zeis R. Synchrotron X-ray Radiography and Tomography of Vanadium Redox Flow Batteries—Cell Design, Electrolyte Flow Geometry, and Gas Bubble Formation. ChemSusChem 2020, 13 (12), 3154–3165. 10.1002/cssc.202000541. [DOI] [PMC free article] [PubMed] [Google Scholar]
- Schilling M.; Braig M.; Köble K.; Zeis R. Investigating the V(IV)/V(V) Electrode Reaction in a Vanadium Redox Flow Battery – A Distribution of Relaxation Times Analysis. Electrochim. Acta 2022, 430, 141058 10.1016/j.electacta.2022.141058. [DOI] [Google Scholar]
- Nourani M.; Zackin B. I.; Sabarirajan D. C.; Taspinar R.; Artyushkova K.; Liu F.; Zenyuk I. V.; Agar E. Impact of Corrosion Conditions on Carbon Paper Electrode Morphology and the Performance of a Vanadium Redox Flow Battery. J. Electrochem. Soc. 2019, 166 (2), A353–A363. 10.1149/2.1041902jes. [DOI] [Google Scholar]
- Eifert L.; Jusys Z.; Banerjee R.; Behm R. J.; Zeis R. Differential Electrochemical Mass Spectrometry of Carbon Felt Electrodes for Vanadium Redox Flow Batteries. ACS Appl. Energy Mater. 2018, 1 (12), 6714–6718. 10.1021/acsaem.8b01550. [DOI] [Google Scholar]
- Wei L.; Zhao T. S.; Xu Q.; Zhou X. L.; Zhang Z. H. In-Situ Investigation of Hydrogen Evolution Behavior in Vanadium Redox Flow Batteries. Appl. Energy 2017, 190, 1112–1118. 10.1016/j.apenergy.2017.01.039. [DOI] [Google Scholar]
- Chen F.; Liu J.; Chen H.; Yan C. Study on Hydrogen Evolution Reaction at a Graphite Electrode in the All-Vanadium Redox Flow Battery. Int. J. Electrochem. Sci. 2012, 7 (4), 3750–3764. 10.1016/S1452-3981(23)13994-0. [DOI] [Google Scholar]
- Schweiss R.; Pritzl A.; Meiser C. Parasitic Hydrogen Evolution at Different Carbon Fiber Electrodes in Vanadium Redox Flow Batteries. J. Electrochem. Soc. 2016, 163 (9), A2089–A2094. 10.1149/2.1281609jes. [DOI] [Google Scholar]
- Eifert L.; Jusys Z.; Behm R. J.; Zeis R. Side Reactions and Stability of Pre-Treated Carbon Felt Electrodes for Vanadium Redox Flow Batteries: A DEMS Study. Carbon 2020, 158, 580–587. 10.1016/j.carbon.2019.11.029. [DOI] [Google Scholar]
- Fetyan A.; El-Nagar G. A.; Lauermann I.; Schnucklake M.; Schneider J.; Roth C. Detrimental Role of Hydrogen Evolution and Its Temperature-Dependent Impact on the Performance of Vanadium Redox Flow Batteries. J. Energy Chem. 2019, 32, 57–62. 10.1016/j.jechem.2018.06.010. [DOI] [Google Scholar]
- Lee J.; Muya J. T.; Chung H.; Chang J. Unraveling V(V)-V(IV)-V(III)-V(II) Redox Electrochemistry in Highly Concentrated Mixed Acidic Media for a Vanadium Redox Flow Battery: Origin of the Parasitic Hydrogen Evolution Reaction. ACS Appl. Mater. Interfaces 2019, 11 (45), 42066–42077. 10.1021/acsami.9b12676. [DOI] [PubMed] [Google Scholar]
- Trasatti S. Work Function, Electronegativity, and Electrochemical Behaviour of Metals. J. Electroanal. Chem. Interfacial Electrochem. 1972, 39 (1), 163–184. 10.1016/S0022-0728(72)80485-6. [DOI] [Google Scholar]
- Wan T. H.; Saccoccio M.; Chen C.; Ciucci F. Influence of the Discretization Methods on the Distribution of Relaxation Times Deconvolution: Implementing Radial Basis Functions with DRTtools. Electrochim. Acta 2015, 184, 483–499. 10.1016/j.electacta.2015.09.097. [DOI] [Google Scholar]
- Wysokinski T. W.; Chapman D.; Adams G.; Renier M.; Suortti P.; Thomlinson W. Beamlines of the Biomedical Imaging and Therapy Facility at the Canadian Light Source - Part 2. J. Phys.: Conf. Ser. 2013, 425 (7), 072013 10.1088/1742-6596/425/7/072013. [DOI] [Google Scholar]
- Hinebaugh J.; Challa P. R.; Bazylak A. Accounting for Low-Frequency Synchrotron X-Ray Beam Position Fluctuations for Dynamic Visualizations. J. Synchrotron Radiat. 2012, 19 (6), 994–1000. 10.1107/S0909049512039118. [DOI] [PubMed] [Google Scholar]
- Ge N.; Chevalier S.; Hinebaugh J.; Yip R.; Lee J.; Antonacci P.; Kotaka T.; Tabuchi Y.; Bazylak A. Calibrating the X-Ray Attenuation of Liquid Water and Correcting Sample Movement Artefacts during in Operando Synchrotron X-Ray Radiographic Imaging of Polymer Electrolyte Membrane Fuel Cells. J. Synchrotron Radiat. 2016, 23 (2), 590–599. 10.1107/S1600577515023899. [DOI] [PubMed] [Google Scholar]
- Dixon D.; Babu D. J.; Langner J.; Bruns M.; Pfaffmann L.; Bhaskar A.; Schneider J. J.; Scheiba F.; Ehrenberg H. Effect of Oxygen Plasma Treatment on the Electrochemical Performance of the Rayon and Polyacrylonitrile Based Carbon Felt for the Vanadium Redox Flow Battery Application. J. Power Sources 2016, 332, 240–248. 10.1016/j.jpowsour.2016.09.070. [DOI] [Google Scholar]
- Lázaro M. J.; Calvillo L.; Celorrio V.; Pardo J. I.; Perathoner S.; Moliner R.. Study and Application of Carbon Black Vulcan XC-72R in Polymeric Electrolyte Fuel Cells. In Carbon Black: Production, Properties, and Uses; Sanders I. J.; Peeten T. L., Eds.; Nova Science Publishers, Inc., 2011. [Google Scholar]
- Somlyai-Sipos L.; Baumli P. Wettability of Metals by Water. Metals 2022, 12 (8), 1274 10.3390/met12081274. [DOI] [Google Scholar]
- Yang P.; Huang N.; Leng Y. X.; Yao Z. Q.; Zhou H. F.; Maitz M.; Leng Y.; Chu P. K. Wettability and Biocompatibility of Nitrogen-Doped Hydrogenated Amorphous Carbon Films: Effect of Nitrogen. Nucl. Instrum. Methods Phys. Res., Sect. B 2006, 242 (1–2), 22–25. 10.1016/j.nimb.2005.08.081. [DOI] [Google Scholar]
- Lim S. C.; Jang J. H.; Bae D. J.; Han G. H.; Lee S.; Yeo I.-S.; Lee Y. H. Contact Resistance between Metal and Carbon Nanotube Interconnects: Effect of Work Function and Wettability. Appl. Phys. Lett. 2009, 95 (26), 264103 10.1063/1.3255016. [DOI] [Google Scholar]
- Babu S. K.; Spernjak D.; Mukundan R.; Hussey D. S.; Jacobson D. L.; Chung H. T.; Wu G.; Steinbach A. J.; Litster S.; Borup R. L.; Zelenay P. Understanding Water Management in Platinum Group Metal-Free Electrodes Using Neutron Imaging. J. Power Sources 2020, 472, 228442 10.1016/j.jpowsour.2020.228442. [DOI] [PMC free article] [PubMed] [Google Scholar]
- Normile S. J.; Sabarirajan D. C.; Calzada O.; De Andrade V.; Xiao X.; Mandal P.; Parkinson D. Y.; Serov A.; Atanassov P.; Zenyuk I. V. Direct Observations of Liquid Water Formation at Nano- and Micro-Scale in Platinum Group Metal-Free Electrodes by Operando X-Ray Computed Tomography. Mater. Today Energy 2018, 9, 187–197. 10.1016/j.mtener.2018.05.011. [DOI] [Google Scholar]
- Soboleva T.; Malek K.; Xie Z.; Navessin T.; Holdcroft S. PEMFC Catalyst Layers: The Role of Micropores and Mesopores on Water Sorption and Fuel Cell Activity. ACS Appl. Mater. Interfaces 2011, 3 (6), 1827–1837. 10.1021/am200590w. [DOI] [PubMed] [Google Scholar]
- Kinoshita K.Carbon: Electrochemical and Physicochemical Properties; John Wiley & Sons, Inc., 1988. [Google Scholar]
- Thommes M.; Kaneko K.; Neimark A. V.; Olivier J. P.; Rodriguez-Reinoso F.; Rouquerol J.; Sing K. S. W. Physisorption of Gases, with Special Reference to the Evaluation of Surface Area and Pore Size Distribution (IUPAC Technical Report). Pure Appl. Chem. 2015, 87 (9–10), 1051–1069. 10.1515/pac-2014-1117. [DOI] [Google Scholar]
- Alcañiz-Monge J.; Linares-Solano A.; Rand B. Mechanism of Adsorption of Water in Carbon Micropores As Revealed by a Study of Activated Carbon Fibers. J. Phys. Chem. B 2002, 106 (12), 3209–3216. 10.1021/jp014388b. [DOI] [Google Scholar]
- Mahle J. J. An Adsorption Equilibrium Model for Type 5 Isotherms. Carbon 2002, 40 (15), 2753–2759. 10.1016/S0008-6223(02)00201-4. [DOI] [Google Scholar]
- Liu L.; Tan S. J.; Horikawa T.; Do D. D.; Nicholson D.; Liu J. Water Adsorption on Carbon - A Review. Adv. Colloid Interface Sci. 2017, 250, 64–78. 10.1016/j.cis.2017.10.002. [DOI] [PubMed] [Google Scholar]
- Schilling M.; Eifert L.; Köble K.; Jaugstetter M.; Bevilacqua N.; Fahy K. F.; Tschulik K.; Bazylak A.; Zeis R. Investigating the Influence of Treatments on Carbon Felts for Vanadium Redox Flow Batteries. ChemSusChem 2023, e202301063 10.1002/cssc.202301063. [DOI] [PubMed] [Google Scholar]
- Choma J.; Burakiewicz-Mortka W.; Jaroniec M.; Li Z.; Klinik J. Monitoring Changes in Surface and Structural Properties of Porous Carbons Modified by Different Oxidizing Agents. J. Colloid Interface Sci. 1999, 214 (2), 438–446. 10.1006/jcis.1999.6246. [DOI] [PubMed] [Google Scholar]
- Banerjee R.; Bevilacqua N.; Mohseninia A.; Wiedemann B.; Wilhelm F.; Scholta J.; Zeis R. Carbon Felt Electrodes for Redox Flow Battery: Impact of Compression on Transport Properties. J. Energy Storage 2019, 26, 100997 10.1016/j.est.2019.100997. [DOI] [Google Scholar]
- Zhang Y.-J.; Ye Q.; Ni M. The Impact of In-Situ Hydrogen Evolution on the Flow Resistance of Electrolyte Flowing through the Carbon Felt Electrode in a Redox Flow Battery. J. Power Sources 2023, 564, 232837 10.1016/j.jpowsour.2023.232837. [DOI] [Google Scholar]
- Xiao L.; Luo M.; Zhu L.; Duan K.; Bevilacqua N.; Eifert L.; Zeis R.; Sui P. Pore-Scale Characterization and Simulation of Porous Electrode Material for Vanadium Redox Flow Battery: Effects of Compression on Transport Properties. J. Electrochem. Soc. 2020, 167 (11), 110545 10.1149/1945-7111/aba4e3. [DOI] [Google Scholar]
- Gul H.; Shah A.-H. A.; Bilal S. Electrochemical Behavior of POT in Different Electrolytes. J. Sci. Innovative Res. 2016, 5 (5), 187–192. 10.31254/jsir.2016.5507. [DOI] [Google Scholar]
- da Silva Freitas W.; Pico P. P. M.; D’Epifanio A.; Mecheri B. Nanostructured Fe-N-C as Bifunctional Catalysts for Oxygen Reduction and Hydrogen Evolution. Catalysts 2021, 11 (12), 1525 10.3390/catal11121525. [DOI] [Google Scholar]
- Morozan A.; Goellner V.; Nedellec Y.; Hannauer J.; Jaouen F. Effect of the Transition Metal on Metal–Nitrogen–Carbon Catalysts for the Hydrogen Evolution Reaction. J. Electrochem. Soc. 2015, 162 (9), H719–H726. 10.1149/2.0051511jes. [DOI] [Google Scholar]
Associated Data
This section collects any data citations, data availability statements, or supplementary materials included in this article.