

Abstract
Background
Circulating calcium mainly carries out its physiologic function in its ionized form (iCa). Clinically, iCa is usually estimated by multiplying the total calcium (TCa) level by 0.5 in the general population, but this method is not accurate when applied to patients on long-term hemodialysis (CHD). Accordingly, this study aimed to develop a predictive function for iCa in patients on CHD by incorporating TCa and other additional variables.
Material/Methods
This was a retrospective cross-sectional study consisting of 2 cross-sectional datasets: a derivation set including 469 CHD patients in June 2019, and a validation set including 446 CHD patients in September 2019. The derivation set’s data were analyzed using the stepwise model selection of machine learning with 10-fold cross-validation to develop a predictive function for iCa. This predictive function was then applied to the validation set’s data, and the predictive function’s estimated iCa was compared with the actual laboratory iCa by using the paired-samples t test and intraclass correlation coefficient.
Results
After analyzing the routine laboratory data parameters of patients in the derivation set, the following 5 variables were included in the predictive function of iCa: blood urea nitrogen, creatinine, phosphate, TCa, and albumin. This predictive function was applied to the validation set to yield an estimated iCa level that was not significantly different from the laboratory-measured iCa level of the validation dataset (P=0.676) with an excellent ICC of 0.905.
Conclusions
We developed a new predictive function that accurately measures the iCa in patients on CHD by using routine laboratory data.
Keywords: Calcium; Kidney Failure, Chronic; Laboratories; Machine Learning; Renal Dialysis; Taiwan
Background
Calcium is a key element on the cell surface and is crucial for intracellular signaling. In healthy adults, approximately 1–1.3 kg of calcium is stored in the body, with 99% contained within bones and teeth and the remaining 1% distributed in soft-tissue cells and extracellular fluid such as interstitial fluid and blood plasma. Several organs, including the parathyroid gland, kidney, and bone, are involved in sensing and homeostasis of the concentration of extracellular free divalent calcium ions (Ca2+). Ultimately, the serum concentration of calcium results from a balance between its absorption through the gastrointestinal tract and its excretion through urine [1].
In patients with chronic kidney disease (CKD), calcium homeostasis is dysregulated due to disruptions in bone and mineral metabolism, and this can lead to dire consequences [2]. For example, a negative calcium balance increases the risks of osteoporosis and fracture, whereas a positive balance increases the risks of vascular calcification and cardiovascular events [2]. This is particularly true in patients on hemodialysis, in whom both hypercalcemia and hypocalcemia have been shown to be independent predictors of mortality [3]. Therefore, it is vital that patients on hemodialysis are regularly monitored for their calcium levels; consistent with this is Kidney Disease: Improving Global Outcomes (KDIGO)’s 2017 CKD-MBD guideline, which suggests routine monitoring of the calcium levels in patients on hemodialysis every 1–3 months, depending on the presence and magnitude of abnormalities, and the rate of progression [4].
KDIGO also previously stated that ideally, ionized calcium (iCa) measurements should be used. This is because some TCa is bound to multiple organic and inorganic anions, such as sulfate, phosphate, lactate, citrate, and protein (primarily albumin), rendering it inactive [1,5]. In contrast, iCa is tightly regulated by parathyroid hormone and active vitamin D, is not influenced by serum albumin level, acidosis, or hydration status, and is the active form that carries out major physiological activities in myocardial, skeletal, and smooth-muscle contractions, and in neuromuscular transmission [2,6]; therefore, it is a better representation of calcium balance in patients with CKD. However, KDIGO acknowledges that measuring ionized calcium is neither practical nor cost effective [7]. This is compounded by the labor-intensive nature of its transport and storage [8].
To overcome this, clinically, total corrected calcium is frequently calculated as an alternative measurement to reflect the iCa level in HD patients. In 1973, Payne et al corrected calcium for albumin, but the study excluded those from renal medicine [9]. In 2000, Clase et al corrected calcium for albumin in HD patients but stated that it is unreliable and should be abandoned [10]. In 2008, Jain et al also corrected calcium for albumin in HD patients, but its formula did not outperform Clase’s formula or uncorrected total calcium in predicting iCa [11]. In 2009, Ferrari et al corrected calcium for albumin and phosphate, adding an additional parameter, which led to more accurate findings [12]. Since then, many other studies have been conducted that use other non-routine laboratory parameters such as acidity, globulin, citrate, lactate, and hydrogen carbonate to correct total calcium in hemodialysis patients [13–15]. However, none of the data have shown superiority over uncorrected total calcium alone [16].
In our study, we hypothesized that ionized calcium levels can be accurately reflected by simultaneously correcting for more variables. These variables are routine monthly laboratory testing parameters, and effectively circumvent the issue of additional costs.
Material and Methods
Ethics Statement
This study was performed in accordance with the principles of the Declaration of Helsinki and was approved by the Ethics Committee of Shin-Kong Wu Ho-Su Memorial Hospital (Date: 11.06.2020, IRB Number: 20200406R). Informed consent was waived because the study was based on an electronic medical record review and patient information was anonymized and de-identified prior to analysis.
Study Design and Patients
This was a retrospective cross-sectional study conducted at Shin-Kong Wu Ho-Su Memorial Hospital Medical Center. This study was divided into 2 parts: the data collected from hemodialysis patients in June 2019 (derivation set) were used to derive a formula to predict the ionized calcium levels in hemodialysis patients in September 2019 (validation set). Patients were included if they had been undergoing regular hemodialysis for at least 3 months and had had no hospital admission in the month prior to the data collection points in June 2019 and September 2019. Patients were excluded if they had incomplete blood test results. Initially, 486 cases were collected in June 2019 for the derivation set, and 17 cases were subsequently excluded due to incomplete blood test results. After exclusion, a total of 469 cases in June 2019 were included in the derivation set. For the validation set, 446 cases with complete data were collected in September 2019 (Figure 1).
Figure 1.
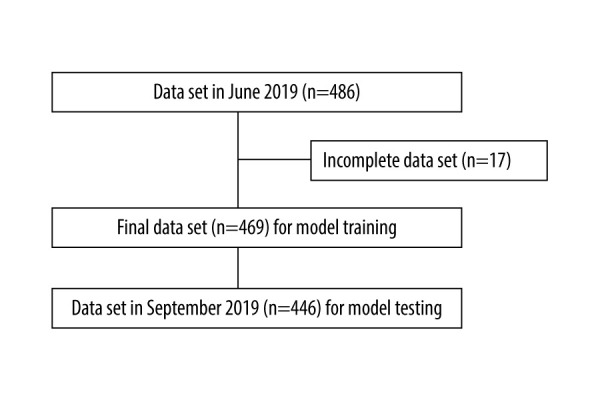
Selection of records of patients on chronic hemodialysis. (Software used for figure creation: Draw.io, version 14.1.8, manufacturer JGraph, Ltd.).
Venipuncture and Sample Handling
Blood samples were collected before and immediately after the dialysis session (following at least 8 h of fasting) for routine biochemical testing. Blood taken from tunneled catheters, arteriovenous fistulas, or grafts were obtained without a tourniquet, and blood taken from heparin-primed catheters had the initial sample discarded. Blood samples were collected into a purple-topped BD Vacutainer (containing K2EDTA), and a yellow-topped Vacutainer (containing thrombin-based medical clotting agent and a polymer gel for serum separation). The BD Vacutainers were then transported anaerobically to the laboratory within 2 h of sampling.
Routine pre-dialysis blood parameters measured included serum blood urea nitrogen (BUN, mg/dL), creatinine (Cr, mg/dL), sodium (Na, mEq/L), potassium (K, mEq/L), albumin (g/dL), total cholesterol (TC, mg/dL), triglyceride (TG, mg/dL), iron profile, hemoglobin (Hb, g/dL) levels, alkaline phosphatase (Alk-P, IU/L), aspartate aminotransferase (AST, mg/dL), alanine aminotransferase (ALT, mg/dL), total calcium (TCa, mg/dL), ionized calcium (iCa, mg/dL), and phosphate (P, mg/dL). Urea kinetics Kt/V was calculated using both pre-dialysis and post-dialysis BUN values [17]. The ion-selective analyzer NOVA-8 was used to measure iCa, Sysmex XN9000 was used to measure Hb, and Hitachi LABOSPECT 008AS was used to measure the remaining blood parameters. BUN was assayed by Urease-GLDH method, creatinine by enzymatic method, Na and K by ISE-indirect method, albumin by an automated bromocresol green (BCG) method, cholesterol by cholesterol oxidase method, triglyceride by free glycerol blanking method, iron profile by nitroso-PSAS method, Hb by colorimetry, Alk-P by IFCC method, AST and ALT by JSCC method, TCa by methylxylenol blue method, iCa by ISE-direct method, and P by molybdate UV method.
Selection of Formulae
Several better-known equations that calculate the TCa corrected for serum albumin or phosphate in patients on hemodialysis were selected from the literature for direct comparison with our equation. The formulae from Payne [9], Clase [10], Jain [11], and Ferrari [12] were included, and the complete formulae are shown in Table 1. Formulae that correct for pH were excluded in our study as pH was not part of the routine biochemistry for patients on HD.
Table 1.
Formulae for the estimated ionized calcium level.
| Source | Formula |
|---|---|
| Our equation | 1.412 + (t[Ca] × 0.487) + (BUN × 0.002) − (Cr × 0.019) − (P × 0.034) − (Albumin × 0.327) |
| Laboratory-measured t[Ca] | t[Ca] × 0.5 |
| Corrected t[Ca] * | |
| Payne [9] | [t[Ca] + 0.8 × (4 - albumin)] × 0.5 |
| Clase [10] | [t[Ca] + 0.72 × (3.5 - albumin)] × 0.5 |
| Jain [11] | [t[Ca] + 0.8 × (3 - albumin)] × 0.5 |
| Ferrari [12] | [t[Ca] + 1.6 × (4 - albumin) + 0.56 × (1.5 − 0.32 × P)] × 0.5 |
The formulae yielding a total corrected calcium will multiply 0.5 to estimate the ionized calcium level.
t[Ca] – total calcium; Cr – creatinine; BUN – blood urea; P – phosphate.
Statistical Analysis
All the data of patients from June 2019 (derivation set), including their age, gender, and blood parameters (excluding iCa), were analyzed with a simple linear regression model to determine the potential effects each independent variable had on the dependent variable (iCa). These independent variables were then analyzed with a multivariate regression analysis by using stepwise approach with 10-fold cross-validation and the stop criterion was determined using the lowest value of cross-validation prediction residual error sum of squares. An equation that predicted the iCa levels was thus established. To assess the accuracy of this new predictive function, the formula was applied to the data of patients from September 2019 (validation set) to estimate their iCa. This estimated iCa was compared with the laboratory-measured iCa using a paired-sample t test. Formulae from the authors Payne, Clase, Jain, and Ferrari that give a total corrected calcium, as well as the laboratory-measured TCa itself, were multiplied by 0.5 to give an estimated iCa, which was then compared with the laboratory-measured iCa using a paired-sample t test. Multiplying the TCa by 0.5 to give an estimated iCa has also been used in other studies [11].
Lastly, the intraclass correlation coefficient (ICC) was used to assess the level of agreement between each of the formulae and laboratory-measured iCa. This is more appropriate than a measure of correlation, which may correlate highly when there is systemic bias. Linear regression analyses and model selection were performed using SAS version 9.4 (SAS Institute, Cary, NC, USA); ICC analyses were performed using SPSS 26.0 software (SPSS, Inc, Chicago, IL, USA).
Results
Patient Characteristics
A total of 469 patients from June 2019 who received hemodialysis at Shin-Kong Wu Ho-Su Memorial Hospital Medical Center and met the eligibility criteria were included in the derivation set. Their baseline characteristics and blood results were as shown in Table 2. The average age in the derivation set was 66.5±12.8 years, with a preponderance of men (53.9%, n=253). Dialysis quality (Kt/V) was 1.39±0.2. The mean values for iCa, total uncorrected calcium, albumin, and hemoglobin are 4.5± 0.5mg/dL, 9.4±1.0 mg/dL, 3.9±0.4 g/dL, and 10.2±1.4 g/dL, respectively.
Table 2.
Characteristics of the study population.
| Characteristics | Values (N=469) |
|---|---|
| Age (years) | 66.5±12.8 |
| Males [N (%)] | 253 (53.9) |
| Kt/V | 1.39±0.20 |
| Blood nitrogen (mg/dL) | 64.0±18.3 |
| Creatinine (mg/dL) | 9.4±2.5 |
| Sodium (mEq/L) | 139±3 |
| Potassium (mEq/L) | 4.5±0.7 |
| Calcium (mg/dL) | 9.4±1.0 |
| Ionized calcium (mg/dL) | 4.5±0.5 |
| Phosphate (mg/dL) | 5.1±1.3 |
| Albumin level (g/dL) | 3.9±0.4 |
| Triglyceride (mg/dL) | 141 (75, 168) |
| Cholesterol level (mg/dL) | 160±41 |
| Hemoglobin (g/dL) | 10.2±1.4 |
| Alk-P (U/L) | 74 (50, 85) |
| ALT (U/L) | 12.3±7.8 |
| AST (U/L) | 16.2±8.2 |
| Iron (g/dL) | 68.3±27.1 |
| Ferritin (g/dL) | 503 (306, 654) |
| Transferrin saturation (%) | 29.1±11.7 |
Kt/V – urea kinetics; ALK-P – alkaline phosphatase; ALT – alanine transaminase; AST – aspartate aminotransferase.
Formulation of the Predictive Equation
Both simple linear regression and multivariate regression by using stepwise approach with 10-fold cross-validation were used to determine which independent variables in Table 2 were able to predict the laboratory-measured ionized calcium level. The results are as shown in Table 3. A simple linear regression analysis showed that female sex, higher Kt/V, TCa, TC and ferritin levels, and lower Cr levels were significantly correlated with higher iCa levels (P<0.05). However, after adjusting for multivariate analysis, the following 5 variables were selected: BUN [β=0.002, 95% confidence interval (CI): 0.001–0.003]; Cr level (β=−0.019, 95% CI: −0.028 to −0.008); P level (β=−0.034, 95% CI: −0.052 to −0.016); TCa level (β=0.487, 95% CI: 0.465–0.509); and albumin level (β=−0.327, 95% CI: −0.386 to −0.268). After identifying the determinants of iCa in patients on CHD, we constructed the following equation with an R2 of 0.81 for the estimation of iCa in the training dataset (Table 1).
Table 3.
Determinants of the serum ionized calcium level in patients on chronic hemodialysis.
| Parameter | Crude | Multivariable | ||
|---|---|---|---|---|
| β (95% CI) | P | β (95% CI) | P | |
| Age (per 1 years) | 0.001 (−0.003, 0.005) | 0.578 | ||
| Males [vs female] | −0.133 (−0.043, −0.223) | 0.004 | ||
| Kt/V (per 1 unit) | 0.484 (0.260, 0.708) | <0.001 | ||
| Blood nitrogen (per 1 mg/dL) | 0.001 (−0.002, 0.003) | 0.784 | 0.002 (0.001, 0.003) | 0.001 |
| Creatinine (per 1 mg/dL) | −0.019 (−0.037, −0.001) | 0.040 | −0.019 (−0.028, −0.008) | <0.001 |
| Sodium (per 1 mEq/L) | 0.014 (−0.001, 0.028) | 0.061 | ||
| Potassium (per 1 mEq/L) | 0.054 (−0.015, 0.123) | 0.125 | ||
| Calcium (per 1 mg/dL) | 0.438 (0.413, 0.464) | <0.001 | 0.487 (0.465, 0.509) | <0.001 |
| Phosphate (per 1 mg/dL) | −0.023 (−0.058, −0.012) | 0.192 | −0.034 (−0.052. −0.016) | <0.001 |
| Albumin level (per 1 g/dL) | −0.044 (−0.157, 0.069) | 0.445 | −0.327 (−0.386, −0.268) | <0.001 |
| Ln (Triglyceride) (per 1 unit) | −0.037 (−0.112, 0.038) | 0.330 | ||
| Total cholesterol (per 1 mg/dL) | 0.001 (0.001, 0.002) | 0.036 | ||
| Hemoglobin (per 1 g/dL) | −0.001 (−0.034, 0.312) | 0.944 | ||
| Alk-P (per 1 U/L) | 0.001 (−0.001, 0.002) | 0.210 | ||
| ALT (per 1 U/L) | −0.002 (−0.007, 0.004) | 0.489 | ||
| AST (per 1 U/L) | 0.001 (−0.005, 0.006) | 0.902 | ||
| Iron (per 1 g/dL) | −0.001 (−0.002, 0.001) | 0.538 | ||
| Ln (Ferritin) (per 1 unit) | 0.086 (0.041, 0.131) | <0.001 | ||
| Transferrin saturation (per 1%) | 0.001 (−0.004, 0.004) | 0.978 | ||
CI – confidence interval; Kt/V – urea kinetics; Ln – natural log transformation; Alk-P – alkaline phosphatase; ALT – alanine aminotransferase; AST – aspartate aminotransferase.
Accuracy of Predictive Equation
Our newly established predictive equation, along with total uncorrected calcium, and total corrected calcium using other authors’ formulae, were applied to the data in the validation set (n=446). The scatter plots between estimated iCa using various equations and laboratory-measured iCa are shown in Figure 2. The estimated iCa using our equation seems unbiased compared to the laboratory-measured iCa (Figure 2A), whereas the estimated iCa using other formulae seems to underestimate (Figure 2E) or overestimate the laboratory-measured iCa (Figure 2B–2D, 2F).
Figure 2.

Scatter plots of estimated Ca by (A) our equation, (B) laboratory-measured total calcium formula, (C) Payne’s formula, (D) Clase’s formula, (E) Jain’s formula, and (F) Ferrari’s formula versus laboratory-measured ionized calcium level in patients on long-term hemodialysis. Reference line indicates the function of Y=X. (Software used for figure creation: SPSS, version 26.0, manufacturer IBM. Further modified with: PowerPoint, version 2306, manufacturer Microsoft).
Table 4 shows paired-sample t test comparisons of the estimated iCa with laboratory-measured iCa. There was no significant difference between our equation’s estimated ionized calcium level and the laboratory-measured ionized calcium level (P=0.676), meaning that the estimated ionized calcium derived from our equation accurately predicts the true, laboratory-derived ionized calcium level. In contrast, the estimated iCa levels using other authors’ formulae are significantly different from the laboratory-measured iCa levels (P<0.001).
Table 4.
Comparison of estimated iCa using various formulae with laboratory-measured iCa.
| Formula | Estimated iCa versus laboratory-measured iCa | ||
|---|---|---|---|
| T value* | P value | ICC | |
| Our equation | −0.418 | 0.676 | 0.905 (0.887–0.920) |
| Laboratory-measured total calcium | −21.234 | <0.001 | 0.770 (0.217–0.904) |
| Payne | −27.401 | <0.001 | 0.767 (0.033–0.917) |
| Clase | −7.821 | <0.001 | 0.897 (0.852–0.926) |
| Jain | 16.557 | <0.001 | 0.858 (0.570–0.933) |
| Ferrari | −16.579 | <0.001 | 0.716 (0.335–0.854) |
Paired t test to compare the difference between estimated iCa and laboratory-measured iCa.
iCa – ionized Ca; ICC – intraclass correlation.
The intraclass correlation coefficients shown in Table 4. Our equation had the highest intraclass correlation coefficient of 0.905, which indicates excellent agreement. Laboratory-measured TCa’s, Payne’s, Clase’s, and Jain’s formulae have good agreement, while Ferrari has moderate agreement.
Discussion
In this study, we successfully developed a predictive equation using multivariate analysis by inputting routine laboratory data from the derivation set. We found that serum levels of TCa, BUN, Cr, albumin, and P were significant determinants in estimating iCa in this population. After constructing the equation with an R2 of 0.81 for the estimation of iCa in the derivation dataset, we further successfully validated its accuracy in the validation dataset. Our predictive equation is superior to the other formulae, as shown in Table 4. Our predictive function of iCa can provide a way to estimate the iCa level in patients on CHD using routine laboratory tests when direct iCa measurements are not available. Furthermore, it can be seamlessly integrated into the electronic reporting system, as the parameters used in this function are already part of the routine laboratory tests performed in the dialysis centers.
Monitoring the iCa level in patients on hemodialysis is important for numerous reasons. Firstly, hemodialysis patients have greater variations of ionized calcium level due to factors such as to dialysis-induced changes, hemoconcentration, vitamin D and calcium intake, as well as PTH-related disorders and bone resistance to PTH [18]. Secondly, both hyper- and hypocalcemia are independent predictors of mortality in hemodialysis patients [13]. For example, a population-based registry in Germany revealed that hypocalcemia was an independent predictor of adverse outcomes in the first 7 years after acute myocardial infarction [14]. Low serum iCa (<4.8 mg/dL) was also found to increase the risk for acute respiratory failure requiring mechanical ventilator support in hospitalized patients [19]. Similarly, mortality was relatively higher in those who had unadjusted calcium concentration of ≥10.2 mg/dL [hazard ratio 1.21, 95% CI: 1.17–1.62) [13]. Moreover, compared with patients in the other groups, those with high dialysate calcium concentration had significantly higher all-cause mortality (HR 2.23; 95% CI: 1.28–3.90) and higher risks for cardiovascular and infection-related hospitalization [15,20]. Therefore, KDIGO recommends correcting both hyper- and hypocalcemia in hemodialysis patients [4]. Nevertheless, even KDIGO acknowledges that ionized calcium measurements are neither practical nor cost effective, and that total corrected calcium offers no superiority over TCa alone [7]. Therefore, it is imperative to develop a more accurate method for predicting the iCa level without incurring additional costs.
Our study builds on previous studies that tried to estimate the iCa level by correcting for other laboratory variables. Correcting the calcium level for other molecules is important because, compared with the TCa level, iCa level better represents the physiologic process at the cellular level and is ideal. Previous studies have shown that unadjusted calcium level can be influenced by albumin, lactate, phosphate, urate, sulfate, and bicarbonate concentrations [10]. The iCa level can be influenced by several factors, such as acid–base status, citrate, heparin, and free fatty acids. For example, the iCa level was found to be lower than the actual concentration in patients on peritoneal dialysis because of the high pH, whereas it was more varied in patients on CHD [21]. Also, in a cross-sectional study, the adjusted anion gap was inversely correlated with the levels of iCa and ionized magnesium [22]. In addition, the measurement of iCa was reported to vary with the levels of TCa, P, albumin, total protein, and pH [1,23,24]. Most importantly, albumin is the major determinant for estimation of iCa level [10,25–28]. However, albumin-adjusted calcium is unsuitable for the diagnosis of hypercalcemia and hypocalcemia in certain situations, such as in critically ill patients [29–31].
Several predictive equations for estimating iCa are currently available, but these were reported to overestimate or underestimate the actual iCa level in patients on CHD, those who are hospitalized, and very elderly patients [16,23,32–34]. One of the most widely used formulae to correct TCa for albumin was devised by Payne in 1973; however, the population studied intentionally excluded those from the renal ward, who may have fluctuating calcium concentration, and the author mentioned that this formula cannot be applied to patients with nephrotic syndrome [9]. In 2000, Clase compared formulae from Marshall and Hodgkinson, Orrell, Berry, and Payne in patients on hemodialysis, but concluded that none of the published formulae performed better than uncorrected TCa [10]. Subsequently, in 2008, Jain conducted the first study with a derivation set and a validation set, and showed that the agreement was greatest with their formula, which outperformed other formulae, including Clase’s, but not significantly [11]. In 2009, Ferrari tried adjusting TCa for both albumin and phosphate, and concluded that phosphate may have relevant clinical implications but did not have a validation set [12]. Another study also showed that addition of serum phosphorus can lead to better results when compared to conventional predictive equations [35]. Although other factors such as measuring the serum bicarbonate and the anion gap may significantly improve the prediction of iCa levels in patients on CHD, these variables, along with parathyroid hormone, calcitonin, and 1,25-dihydroxyvitamin D level are not routinely checked in clinical practice [22]. All of these aforementioned studies led to the conception of this study, which used more parameters that are routinely obtained in order to establish a more accurate formula for predicting estimated ionized calcium.
Our study is consistent with previous studies in that other formulae tested did not significantly outperform total uncorrected calcium; however, our study’s formula outperformed all the other formulae, including total uncorrected calcium. Our study also shows that the 5 variables TCa, Alb, P, BUN, and Cr are significant predictors of iCa. An increase in albumin causes an increased amount of calcium bound to albumin and therefore a decrease in iCa; likewise, an increase in phosphate causes an increased amount of calcium-phosphate complexes and therefore a decrease in iCa [12]. While the effects of TCa, Alb, and P on iCa can be readily explained, the roles of BUN and Cr in the estimation of iCa are less clear and to the best of our knowledge, there have not been any other studies that used BUN and Cr to predict iCa. The authors believe that since creatinine is more of an indicator of muscle mass and nutrition in patients on HD [36], it may indirectly reflect the serum protein status and thus has an effect in predicting iCa. BUN in HD may also correlate with nutritional status; studies have shown that pre-dialysis BUN is positively correlated with creatinine and albumin [37]. However, contrary to our expectations, a higher BUN leads to higher iCa, and this still needs to be elucidated. Another point worth noting in our study is that our equation directly measures the estimated ionized calcium level while the other formulae use corrected TCa multiplied by 0.5 to give an estimated ionized calcium level. This may suggest that methods to directly estimate the iCa level are preferrable to transforming the total corrected calcium to iCa. Our study is also the first to use the paired t test to evaluate our equation’s predictive efficacy, and our formula is the only one that shows no statistical difference.
There are several strengths to our study. For example, the sample size of our study population was significantly larger than in all the aforementioned studies. Our study also included a derivation set and validation set, which allowed us to test the formula’s predictive accuracy. Moreover, all the data collected were from routine laboratory parameters, meaning that this formula is easily transferable clinically and does not incur any additional costs, which would undermine the purpose behind our study. On the other hand, our study also has several limitations. Given the fact that this was a single-center study, there is concern about the generalizability, and this formula needs external validation. Furthermore, the population bases in the derivation set and validation set were similar, although 3 months did elapse, and blood levels of various parameters should be expected to vary. The population base in this study was mainly Asian. In addition, this was a retrospective, cross-sectional study, so the sample collection methods are routine and may not be as rigorous. For example, although efforts were made to transport the samples to be assessed for TCa level to the laboratory, they were not transported in iced water to avoid lactic acid formation, which could have affected the results. Moreover, there is the question of when this formula can be applied to patients on CHD after a hemodialysis session, since serum electrolytes (including calcium and phosphorus), BUN, creatinine, and albumin significantly fluctuate immediately after a hemodialysis session [38]. Further study is needed to determine if the formula can be applied to patients on CHD, both immediately after a hemodialysis session and 1 day after the hemodialysis session. Lastly, the validity of this formula may be compromised in specific patient populations where there may be significant derangements of biochemical profile, such as in-patient populations [39], hypogammaglobinemia [9], malignancy, hyperthyroidism, and jaundice [10], and application of our formula in these populations should be approached with caution.
Conclusions
In conclusion, monitoring the iCa level in patients on hemodialysis is important in patient care; however, direct measurements are often cost-ineffective and impractical clinically. Several formulae have been devised to measure the total corrected calcium level to estimate the iCa level, but none have been shown to be superior to total uncorrected calcium. This study devised a new predictive formula by using multiple variables, which shows great promise. However, further external validation is needed to assess its generalizability to other institutions.
Acknowledgements
We thank the statistics division of artificial intelligence center of Shin Kong Wu Ho-Su Memorial Hospital for providing the support of statistical analysis.
Footnotes
Conflict of interest: None declared
Publisher’s note: All claims expressed in this article are solely those of the authors and do not necessarily represent those of their affiliated organizations, or those of the publisher, the editors and the reviewers. Any product that may be evaluated in this article, or claim that may be made by its manufacturer, is not guaranteed or endorsed by the publisher
Declaration of Figures’ Authenticity
All figures submitted have been created by the authors, who confirm that the images are original with no duplication and have not been previously published in whole or in part.
Financial support: This study was supported by Shin Kong Wu Ho-Su Memorial Hospital (Grant No. 2020SKHADR006)
References
- 1.Evenepoel P, Wolf M. A balanced view of calcium and phosphate homeostasis in chronic kidney disease. Kidney Int. 2013;83(5):789–91. doi: 10.1038/ki.2013.21. [DOI] [PubMed] [Google Scholar]
- 2.Hill Gallant KM, Spiegel DM. Calcium balance in chronic kidney disease. Curr Osteoporos Rep. 2017;15(3):214–21. doi: 10.1007/s11914-017-0368-x. [DOI] [PMC free article] [PubMed] [Google Scholar]
- 3.Lowrie EG, Lew NL. Death risk in hemodialysis patients: The predictive value of commonly measured variables and an evaluation of death rate differences between facilities. Am J Kidney Dis. 1990;15(5):458–82. doi: 10.1016/s0272-6386(12)70364-5. [DOI] [PubMed] [Google Scholar]
- 4.Kidney Disease: Improving Global Outcomes (KDIGO) CKD-MBD Update Work Group. KDIGO 2017 clinical practice guideline update for the diagnosis, evaluation, prevention, and treatment of Chronic Kidney Disease-Mineral and Bone Disorder (CKD-MBD) Kidney Int Suppl (2011) 2017;7(1):1–59. doi: 10.1016/j.kisu.2017.04.001. [DOI] [PMC free article] [PubMed] [Google Scholar]
- 5.Higgins C. Ionized calcium. Medicine. 2007 Corpus ID:10881768. [Google Scholar]
- 6.Kuo IY, Ehrlich BE. Signaling in muscle contraction. Cold Spring Harb Perspect Biol. 2015;7(2):a006023. doi: 10.1101/cshperspect.a006023. [DOI] [PMC free article] [PubMed] [Google Scholar]
- 7.Kidney Disease: Improving Global Outcomes (KDIGO) CKD-MBD Update Work Group. KDIGO clinical practice guideline for the diagnosis, evaluation prevention, and treatment of Chronic Kidney Disease-Mineral and Bone Disorder (CKD-MBD) Kidney Int Suppl. 2009;113:S1–130. doi: 10.1038/ki.2009.188. [DOI] [PubMed] [Google Scholar]
- 8.Boink AB, Buckley BM, Christiansen TF, et al. International Federation of Clinical Chemistry (IFCC) scientific division IFCC recommendation. Recommendation on sampling, transport and storage for the determination of the concentration of ionized calcium in whole blood, plasma and serum. Ann Biol Clin (Paris) 1991;49(8):434–38. [PubMed] [Google Scholar]
- 9.Payne RB, Little AJ, Williams RB, Milner JR. Interpretation of serum calcium in patients with abnormal serum proteins. Br Med J. 1973;4(5893):643–46. doi: 10.1136/bmj.4.5893.643. [DOI] [PMC free article] [PubMed] [Google Scholar]
- 10.Clase CM, Norman GL, Beecroft ML, Churchill DN. Albumin-corrected calcium and ionized calcium in stable haemodialysis patients. Nephrol Dial Transplant. 2000;15(11):1841–46. doi: 10.1093/ndt/15.11.1841. [DOI] [PubMed] [Google Scholar]
- 11.Jain A, Bhayana S, Vlasschaert M, House A. A formula to predict corrected calcium in haemodialysis patients. Nephrol Dial Transplant. 2008;23(9):2884–88. doi: 10.1093/ndt/gfn186. [DOI] [PubMed] [Google Scholar]
- 12.Ferrari P, Singer R, Agarwal A, et al. Serum phosphate is an important determinant of corrected serum calcium in end-stage kidney disease. Nephrology (Carlton) 2009;14(4):383–88. doi: 10.1111/j.1440-1797.2009.01121.x. [DOI] [PubMed] [Google Scholar]
- 13.Rivara MB, Ravel V, Kalantar-Zadeh K, et al. Uncorrected and albumin-corrected calcium, phosphorus, and mortality in patients undergoing maintenance dialysis. J Am Soc Nephrol. 2015;26(7):1671–81. doi: 10.1681/ASN.2014050472. [DOI] [PMC free article] [PubMed] [Google Scholar]
- 14.Schmitz T, Thilo C, Linseisen J, et al. Low serum calcium is associated with higher long-term mortality in myocardial infarction patients from a population-based registry. Sci Rep. 2021;11(1):2476. doi: 10.1038/s41598-021-81929-7. [DOI] [PMC free article] [PubMed] [Google Scholar]
- 15.Kim HW, Kim SH, Kim YO, et al. Impact of dialysate calcium concentration on clinical outcomes in incident hemodialysis patients. Medicine (Baltimore) 2015;94(40):e1694. doi: 10.1097/MD.0000000000001694. [DOI] [PMC free article] [PubMed] [Google Scholar]
- 16.Gauci C, Moranne O, Fouqueray B, et al. NephroTest Study Group. Pitfalls of measuring total blood calcium in patients with CKD. J Am Soc Nephrol. 2008;19(8):1592–98. doi: 10.1681/ASN.2007040449. [DOI] [PMC free article] [PubMed] [Google Scholar]
- 17.Daugirdas JT. Simplified equations for monitoring Kt/V, PCRn, eKt/V, and ePCRn. Adv Ren Replace Ther. 1995;2(4):295–304. doi: 10.1016/s1073-4449(12)80028-8. [DOI] [PubMed] [Google Scholar]
- 18.Jean G, Granjon S, Zaoui E, et al. Usefulness and feasibility of measuring ionized calcium in haemodialysis patients. Clin Kidney J. 2015;8(4):378–87. doi: 10.1093/ckj/sfv039. [DOI] [PMC free article] [PubMed] [Google Scholar]
- 19.Thongprayoon C, Cheungpasitporn W, Chewcharat A, et al. Serum ionised calcium and the risk of acute respiratory failure in hospitalised patients: A single-centre cohort study in the USA. BMJ Open. 2020;10(3):e034325. doi: 10.1136/bmjopen-2019-034325. [DOI] [PMC free article] [PubMed] [Google Scholar]
- 20.Tagawa M, Hamano T, Sueta S, et al. Higher dialysate calcium concentration is associated with incident myocardial infarction among diabetic patients with low bone turnover: A longitudinal study. Sci Rep. 2018;8(1):10060. doi: 10.1038/s41598-018-28422-w. Erratum in: Sci Rep. 2018;8(1):13217. [DOI] [PMC free article] [PubMed] [Google Scholar]
- 21.Morishita M, Maruyama Y, Nakao M, et al. Factors affecting the relationship between ionized and corrected calcium levels in peritoneal dialysis patients: A retrospective cross-sectional study. BMC Nephrol. 2020;21(1):370. doi: 10.1186/s12882-020-02033-y. [DOI] [PMC free article] [PubMed] [Google Scholar]
- 22.Sakaguchi Y, Hamano T, Kubota K, et al. Anion gap as a determinant of ionized fraction of divalent cations in hemodialysis patients. Clin J Am Soc Nephrol. 2018;13(2):274–81. doi: 10.2215/CJN.07930717. [DOI] [PMC free article] [PubMed] [Google Scholar]
- 23.Morton AR, Garland JS, Holden RM. Is the calcium correct? Measuring serum calcium in dialysis patients. Semin Dial. 2010;23(3):283–89. doi: 10.1111/j.1525-139X.2010.00735.x. [DOI] [PubMed] [Google Scholar]
- 24.Ladenson JH, Lewis JW, Boyd JC. Failure of total calcium corrected for protein, albumin, and pH to correctly assess free calcium status. J Clin Endocrinol Metab. 1978;46(6):986–93. doi: 10.1210/jcem-46-6-986. [DOI] [PubMed] [Google Scholar]
- 25.Coley-Grant D, Herbert M, Cornes MP, et al. The impact of change in albumin assay on reference intervals, prevalence of ‘hypoalbuminaemia’ and albumin prescriptions. Ann Clin Biochem. 2016;53(Pt 1):112–16. doi: 10.1177/0004563215599560. [DOI] [PubMed] [Google Scholar]
- 26.Thode J, Juul-Jørgensen B, Bhatia HM, et al. Comparison of serum total calcium, albumin-corrected total calcium, and ionized calcium in 1213 patients with suspected calcium disorders. Scand J Clin Lab Invest. 1989;49(3):217–23. Erratum in: Scand J Clin Lab Invest 1990;50(1):113. [PubMed] [Google Scholar]
- 27.Labriola L, Wallemacq P, Gulbis B, Jadoul M. The impact of the assay for measuring albumin on corrected (‘adjusted’) calcium concentrations. Nephrol Dial Transplant. 2009;24(6):1834–38. doi: 10.1093/ndt/gfn747. [DOI] [PubMed] [Google Scholar]
- 28.Davies SL, Hill C, Bailey LM, et al. The impact of calcium assay change on a local adjusted calcium equation. Ann Clin Biochem. 2016;53(Pt 2):292–94. doi: 10.1177/0004563215583699. [DOI] [PubMed] [Google Scholar]
- 29.Slomp J, van der Voort PH, Gerritsen RT, et al. Albumin-adjusted calcium is not suitable for diagnosis of hyper- and hypocalcemia in the critically ill. Crit Care Med. 2003;31(5):1389–93. doi: 10.1097/01.CCM.0000063044.55669.3C. [DOI] [PubMed] [Google Scholar]
- 30.Smith JD, Wilson S, Schneider HG. Misclassification of calcium status based on albumin-adjusted calcium: Studies in a tertiary hospital setting. Clin Chem. 2018;64(12):1713–22. doi: 10.1373/clinchem.2018.291377. [DOI] [PubMed] [Google Scholar]
- 31.Dickerson RN, Alexander KH, Minard G, et al. Accuracy of methods to estimate ionized and “corrected” serum calcium concentrations in critically ill multiple trauma patients receiving specialized nutrition support. JPEN J Parenter Enteral Nutr. 2004;28(3):133–41. doi: 10.1177/0148607104028003133. [DOI] [PubMed] [Google Scholar]
- 32.Mateu-de Antonio J. New predictive equations for serum ionized calcium in hospitalized patients. Med Princ Pract. 2016;25(3):219–26. doi: 10.1159/000443145. [DOI] [PMC free article] [PubMed] [Google Scholar]
- 33.Pfitzenmeyer P, Martin I, d’Athis P, et al. Club Francophone de Gériatrie et Nutrition. A new formula for correction of total calcium level into ionized serum calcium values in very elderly hospitalized patients. Arch Gerontol Geriatr. 2007;45(2):151–57. doi: 10.1016/j.archger.2006.10.006. [DOI] [PubMed] [Google Scholar]
- 34.Byrnes MC, Huynh K, Helmer SD, et al. A comparison of corrected serum calcium levels to ionized calcium levels among critically ill surgical patients. Am J Surg. 2005;189(3):310–14. doi: 10.1016/j.amjsurg.2004.11.017. [DOI] [PubMed] [Google Scholar]
- 35.Obi Y, Nguyen DV, Streja E, et al. Development and validation of a novel laboratory-specific correction equation for total serum calcium and its association with mortality among hemodialysis patients. J Bone Miner Res. 2017;32(3):549–59. doi: 10.1002/jbmr.3013. [DOI] [PMC free article] [PubMed] [Google Scholar]
- 36.Canaud B, Granger Vallée A, Molinari N, et al. Creatinine index as a surrogate of lean body mass derived from urea Kt/V, pre-dialysis serum levels and anthropometric characteristics of haemodialysis patients. PLoS One. 2014;9(3):e93286. doi: 10.1371/journal.pone.0093286. [DOI] [PMC free article] [PubMed] [Google Scholar]
- 37.Lee SW, Yang YM, Kim HY, et al. Predialysis urea nitrogen is a nutritional marker of hemodialysis patients. Chonnam Med J. 2022;58(2):69–74. doi: 10.4068/cmj.2022.58.2.69. [DOI] [PMC free article] [PubMed] [Google Scholar]
- 38.Correa S, Scovner KM, Tumlin JA, et al. MiD Investigators and Committees; MiD Investigators and Committees. Electrolyte changes in contemporary hemodialysis: A secondary analysis of the Monitoring in Dialysis (MiD) study. Kidney360. 2021;2(4):695–707. doi: 10.34067/KID.0007452020. [DOI] [PMC free article] [PubMed] [Google Scholar]
- 39.Jassam N, Hayden K, Dearman R, et al. Prospective study comparing the outcome of a population-specific adjusted calcium equation to ionized calcium. Ann Clin Biochem. 2020;57(4):316–24. doi: 10.1177/0004563220926542. [DOI] [PubMed] [Google Scholar]