

Abstract
Recent advances in computational psychiatry have identified latent cognitive and perceptual states that predispose to psychotic symptoms. Behavioral data fit to Bayesian models have demonstrated an over-reliance on priors (i.e., prior over-weighting) during perception in select samples of individuals with hallucinations. However, the clinical utility of this observation depends on the extent to which it reflects static symptom risk or current symptom state. To determine whether task performance and estimated prior weighting related to specific elements of symptom expression, a large, heterogeneous, and deeply-phenotyped sample of hallucinators (N = 249) and non-hallucinators (N=209) performed the Conditioned Hallucination (CH) task. We found that CH rates could predict stable measures of hallucination status. However, CH rates were more sensitive to hallucination state, significantly correlating with hallucination severity measures over the two days leading up to task completion and driven by heightened reliance on past experiences (priors). To further test the sensitivity of CH rate and priors to symptom severity, a subset of participants with hallucinations (AH+; N = 40) performed a repeated-measures version of the CH task. Changes in both CH frequency and relative prior weighting varied with changes in AH frequency on follow-up. These results support the use of CH rate and prior over-weighting as state markers of hallucination status, potentially useful in tracking disease development and treatment response.
Keywords: computational psychiatry, hallucinations, perception, psychosis, nosology
Introduction
Progress in medicine requires an understanding of how abnormalities in underlying mechanisms of diseases lead to observable signs and symptoms. If these causes are identified, strategies for prevention and treatment can be designed specifically to arrest the processes leading to disease1. For instance, identifying the biochemical pathways that cause unchecked cellular proliferation in chronic myelogenous leukemia (CML) led to specific interventions arresting these pathways. Since the advent of these interventions, CML has gone from an illness with a survival of 3–5 years after diagnosis to fewer than 1% of patients dying from the disease2.
Understanding underlying disease processes can lead to the identification of biomarkers proximal to symptom expression. These markers may then serve as useful ways of tracking disease trajectory in individuals at elevated risk and those undergoing treatment. For example, in endocrinology, risk for hypothyroidism as well as treatment response may be tracked by thyroid stimulating hormone (TSH). Elevated TSH reflects an under-performing thyroid, and likelihood of symptom expression related to that hypofunction is directly associated with serum TSH levels3. Thus, while TSH is not a directly observable sign or symptom, tracking this biomarker is essential to monitoring a patient’s disease state.
As with CML and hypothyroidism, identifying underlying pathways and monitoring markers of disease states is important for psychiatric disorders. In psychiatry, disease states are thought to arise because of abnormalities in information processing. Like serum TSH levels, these abnormalities may not be directly observed but may be causally related to symptom expression. One promising route toward identifying biomarkers of information processing abnormalities driving psychiatric symptom expression comes from computational psychiatry4–6. Computational psychiatry provides mathematical frameworks for understanding the typical functioning of perceptual and cognitive systems, and how specific disturbances may lead to specific psychiatric symptoms5,6. One such computational framework, predictive processing theory (PPT), has proven useful in proposing mechanisms by which psychotic symptoms and brain states might arise from aberrations in learning and inference7–9. This approach has demonstrated promise as a tool for understanding hallucinations. Within PPT, perception is formally described as the process of inferring one’s surroundings by combining their internal model of (or expectations about) those surroundings (priors) with the available sensory evidence, weighted by the reliability of their priors and sensory evidence10–12. Given this formulation of perception, hallucinations--percepts in the absence of a corresponding stimulus--may arise due to over-weighted priors relative to the weight exerted by incoming sensory evidence9,13.
Empirical support for this idea has mounted over recent years14. Several behavioral tasks sensitive to relative prior-weighting15–18 have demonstrated a relationship to hallucination propensity across clinical and non-clinical populations16,19 as well as neurological and psychiatric disorders17. Critically, an over-weighting of perceptual priors does not appear to be present in individuals with psychosis-spectrum disorders without hallucinations19, suggesting specificity of this abnormality to hallucinations and not psychotic illness writ large.
Though this combination of evidence supports the idea that over-weighing perceptual priors is linked to a susceptibility toward hallucinations, no data currently exist to discern exactly what the relationship between prior over-weighting and hallucination susceptibility might be. For example, does a tendency to over-weight priors represent a static risk factor that is stable over time? Or does this tendency reflect changes in hallucination intensity that vary with current clinical state and treatments? These distinctions could reveal crucial information about the pathophysiological pathways leading directly to symptom expression and whether biomarkers based on this observation could be useful to track susceptibility toward hallucinations or response to treatment.
Here we present data from a large, heterogeneous, extensively phenotypically characterized group of individuals with unusual perceptual experiences, including those with (AH+; N=249) and without (AH-; N=209) auditory hallucinations. Participants completed the Conditioned Hallucinations (CH) task, which has previously been shown to be sensitive to prior over-weighting and propensity toward auditory hallucinations19,20. We replicate the findings that the CH task and estimated relative prior weighting are sensitive to hallucination propensity. We then extend these findings to demonstrate a strong relationship between prior weighting and severity of hallucinatory experiences. Lastly, we show that changes in prior weighting are in fact sensitive to changes in recent hallucination frequency, as demonstrated in a subset of individuals who performed repeat assessment.
Methods and Materials
Participants and Data Collection
Participants aged 18–65 completed a battery of demographic measures, clinical scales, and behavioral tasks as part of the Yale Control Over Perceptual Experiences (COPE) Project (https://www.spirit.research.yale.edu/). The study was coordinated through Yale’s instantiation of Research Electronic Data Capture (REDCap@Yale). REDCap is a HIPAA-secure web-based software platform designed for data capture in research studies21,22.
Recruitment was accomplished via advertising through specific partners (https://www.spirit.research.yale.edu/partners) who work with individuals with unusual perceptual experiences and unusual beliefs, both with and without a need for care, as well as broader posting via Amazon Mechanical Turk and social media platforms. All procedures were approved by the Yale University Institutional Review Board / Human Interest Committee. Participants provided informed consent and received monetary compensation for their participation, contingent on adequate completion of all study procedures. A screening survey excluded those who reported cognitive, neurological, or seizure disorders or endorsed being under the influence of recreational drugs or alcohol at participation.
Phenomenological and Clinical Battery
Participants were screened for the presence of auditory hallucinations (AH) via administration of the screening portion of the Chicago Hallucination Assessment Tool (CHAT) by online self-report23. This tool also provided an estimate of the frequency and recency of hallucinations across modalities. AH+ participants also completed the Computerized Binary Scale for Auditory Speech Hallucinations (cbSASH)24, the Beliefs About Voices Questionnaire-Revised (BAVQ-R)25, the Launay-Slade Hallucination Scale-Revised (LSHS-R)26,27, and the Yale Control Over Perceptual Experiences Scale28. All participants also provided past psychiatric history (including medications) and completed the Peters et al Delusion Inventory (PDI)29, the 9-item version of Raven’s Progressive Matrices30, and the Miller-Forensic Assessment of Symptoms Test (M-FAST)31.
Auditory Conditioned Hallucinations (CH) Task
The CH task is a sensory-detection task using principles of psychometric thresholding and Pavlovian associative learning19,20,32–35 to induce auditory hallucinations19,20. Participants press buttons to indicate their detection of a target stimulus, a 1-kHz pure tone embedded in 70-dB SPL white noise and presented concurrently with a flashed white checkerboard on a black background (Fig. 1a).
Figure 1. Auditory Conditioned Hallucinations (CH) Task Structure.
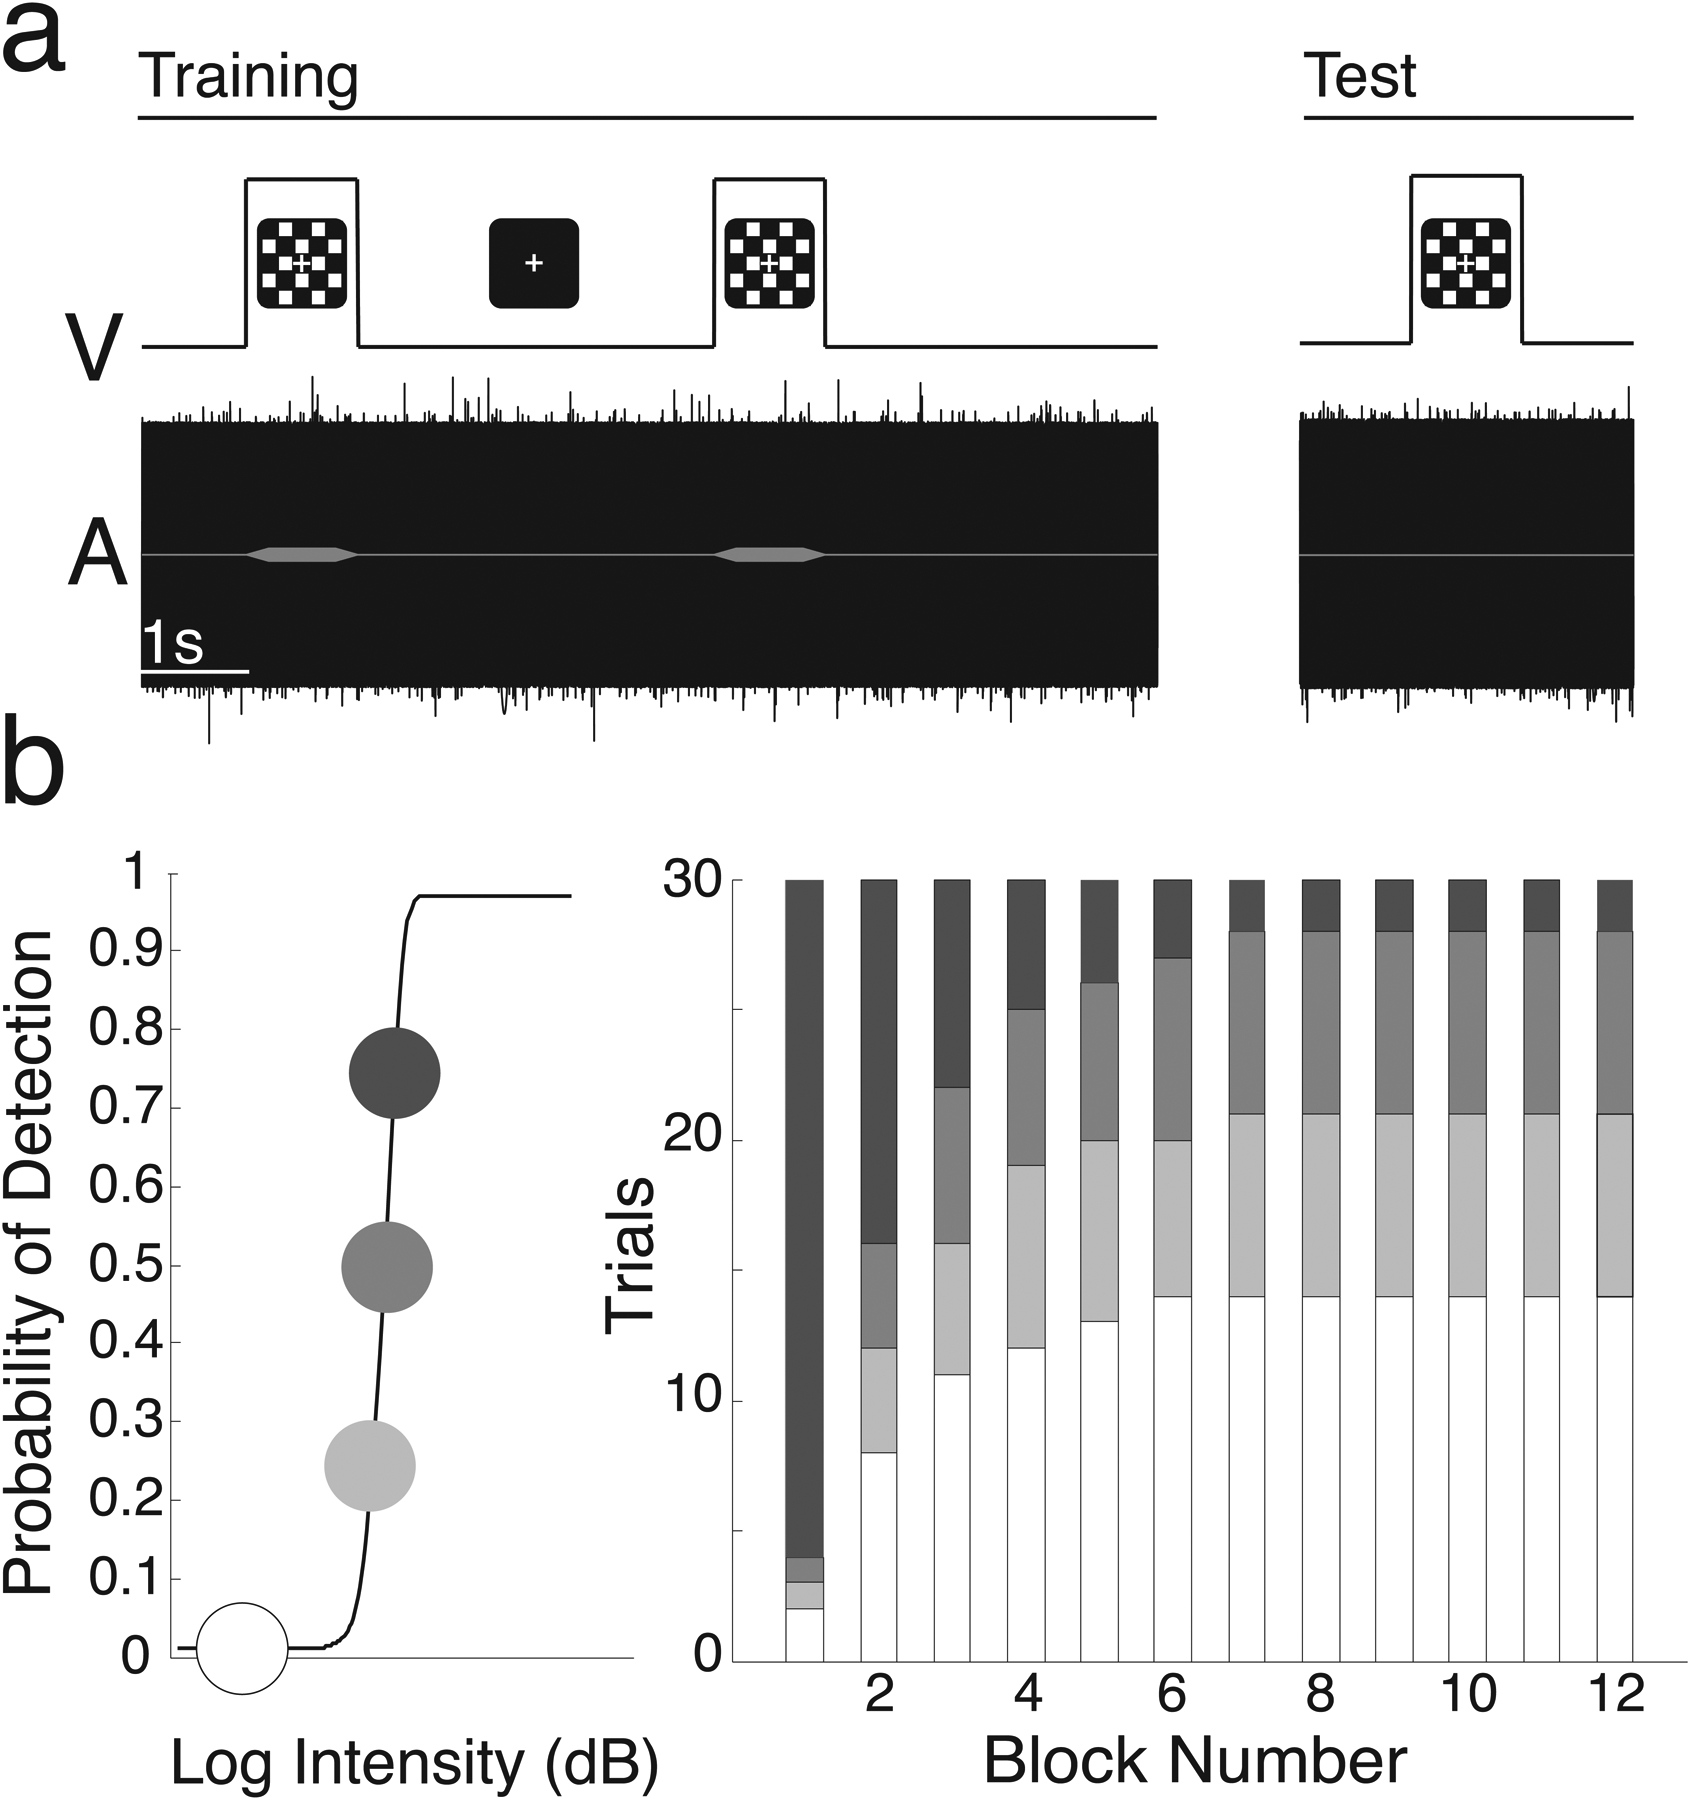
a. Visual and auditory stimuli and task structure. Trials consisted of simultaneous presentation of a 1000-Hz tone embedded in white noise and a visual checkerboard. b. We estimated individual psychometric curves for tone detection (left) and then systematically varied stimulus intensity over 12 blocks of 30 conditioning trials. Threshold tones were more likely early, and absent tones were more likely later (right).
The online CH task was implemented via React (https://reactjs.org/), using the same structure as previous versions. Participants used the q and e keys to indicate ‘yes’ or ‘no’ for detection of the tone, and held these keys down to indicate confidence in their responses using a color visual analog scale from “Unsure” (1) to “Certain” (5). Participant non-response triggered a trial repeat. 80% accuracy on two short practice sessions was required before task initiation. Thresholding was accomplished via two 40-trial interleaved staircases with step sizes computed by QUEST, a maximum-likelihood based procedure adapted to JavaScript from Psychtoolbox 3.019,36. QUEST determined the volume at which participants would detect the tone 75% of the time. A psychometric function was fitted to ascertain based on the 75%-values and used to determine the 25% and 50% thresholds37 (Fig. 1b, left). Over 12 blocks of 30 pseudorandomized trials, the likelihood of tone presentation at previously-computed intensities decreased non-linearly, while the likelihood of sub-threshold target presentation and no-tone trials increased (Fig 1c, right). We calculated detection probability for each trial type as the proportion of all trials for which participants indicated ‘Yes’ for target stimulus detection at that stimulus intensity. Trials in which participants signaled detection despite absence of the target stimulus were reported as conditioned hallucination trials.
Sample Selection
A sample of 458 participants from the Yale COPE Project were selected after quality control procedures and demographic matching (see Supplemental Methods for details). Participants with AH (AH+) and without AH (AH-) were identified by CHAT-AH score. Any endorsement of CHAT-AH items 4 through 8 was considered as AH+ (Table S1)38, as items 1–3 (“Have you ever thought you heard someone call your name, but then realized you must have been mistaken?”; “Have you ever heard your phone ringing, but then realized the phone hadn’t actually rung?”; and “Do you ever hear strange noises when you are falling asleep or waking up in the morning?”) are very commonly endorsed in the general population39–41. A random sample, balanced in age, sex, and total score on the Raven’s progressive matrices between the AH+ and AH− groups, was selected for between-group analyses. The AH+ group was further divided based on the frequency of the hallucinations reported (Daily, Weekly, Monthly or Less), based on the highest frequency endorsed for any CHAT-AH items 4 through 7.
Hierarchical Gaussian Filter (HGF) Analysis
To identify the latent states driving behavior on the CH Task, we fitted parameters of a three-tiered Hierarchical Gaussian Filter (HGF) using trial-wise data on stimulus intensity and responses42,43. Given the heterogeneity of hardware systems utilized in this online sample, empirically-derived grand mean detection rates at each condition were used as stimulus intensity inputs. The HGF is a computational Bayesian hierarchical model of learning and inference in a changing environment44. This model has been adapted for CH data19,20 (Fig. 3a). For this task, inference on the first level (X1) represents trial-wise participant belief in the presence of the target given the visual stimulus, inference on the second level (X2) models the belief that the visual stimulus predicts the target auditory stimulus, and inference on the third level (X3) is the participant’s estimated volatility of the contingency between the visual and target stimuli (i.e., volatility of X2). μ refers to the means of inferred beliefs about X1-X3, v to individual subjects’ relative weighting of priors and sensory input, and ω2 and ω3 to belief evolution rates on levels 2 and 3. Beliefs about the presence of the target on any given trial (mu1) are combined with tone intensity and weighted according to the parameter v to produce posterior beliefs about the presence of the tone on any given trial. Higher v values correspond to a higher weighting of perceptual beliefs relative to sensory evidence. Posterior perceptual beliefs about the presence of the target stimulus given available sensory evidence are fed into a response model, which estimates the likelihood of a response taking into account decision noise (β−1). Additional details of HGF implementation using CH task data, including comparison of multiple models, are included in the Supplement and have been published elsewhere19,20. Relevant model code has been made freely available as part of the TAPAS computational toolbox (github.com/translationalneuromodeling/tapas). As was done in prior work, different HGF models were tested to ensure suitability of the model employed (Fig. S1).
Figure 3. Hierarchical Gaussian Filter (HGF) Analysis.
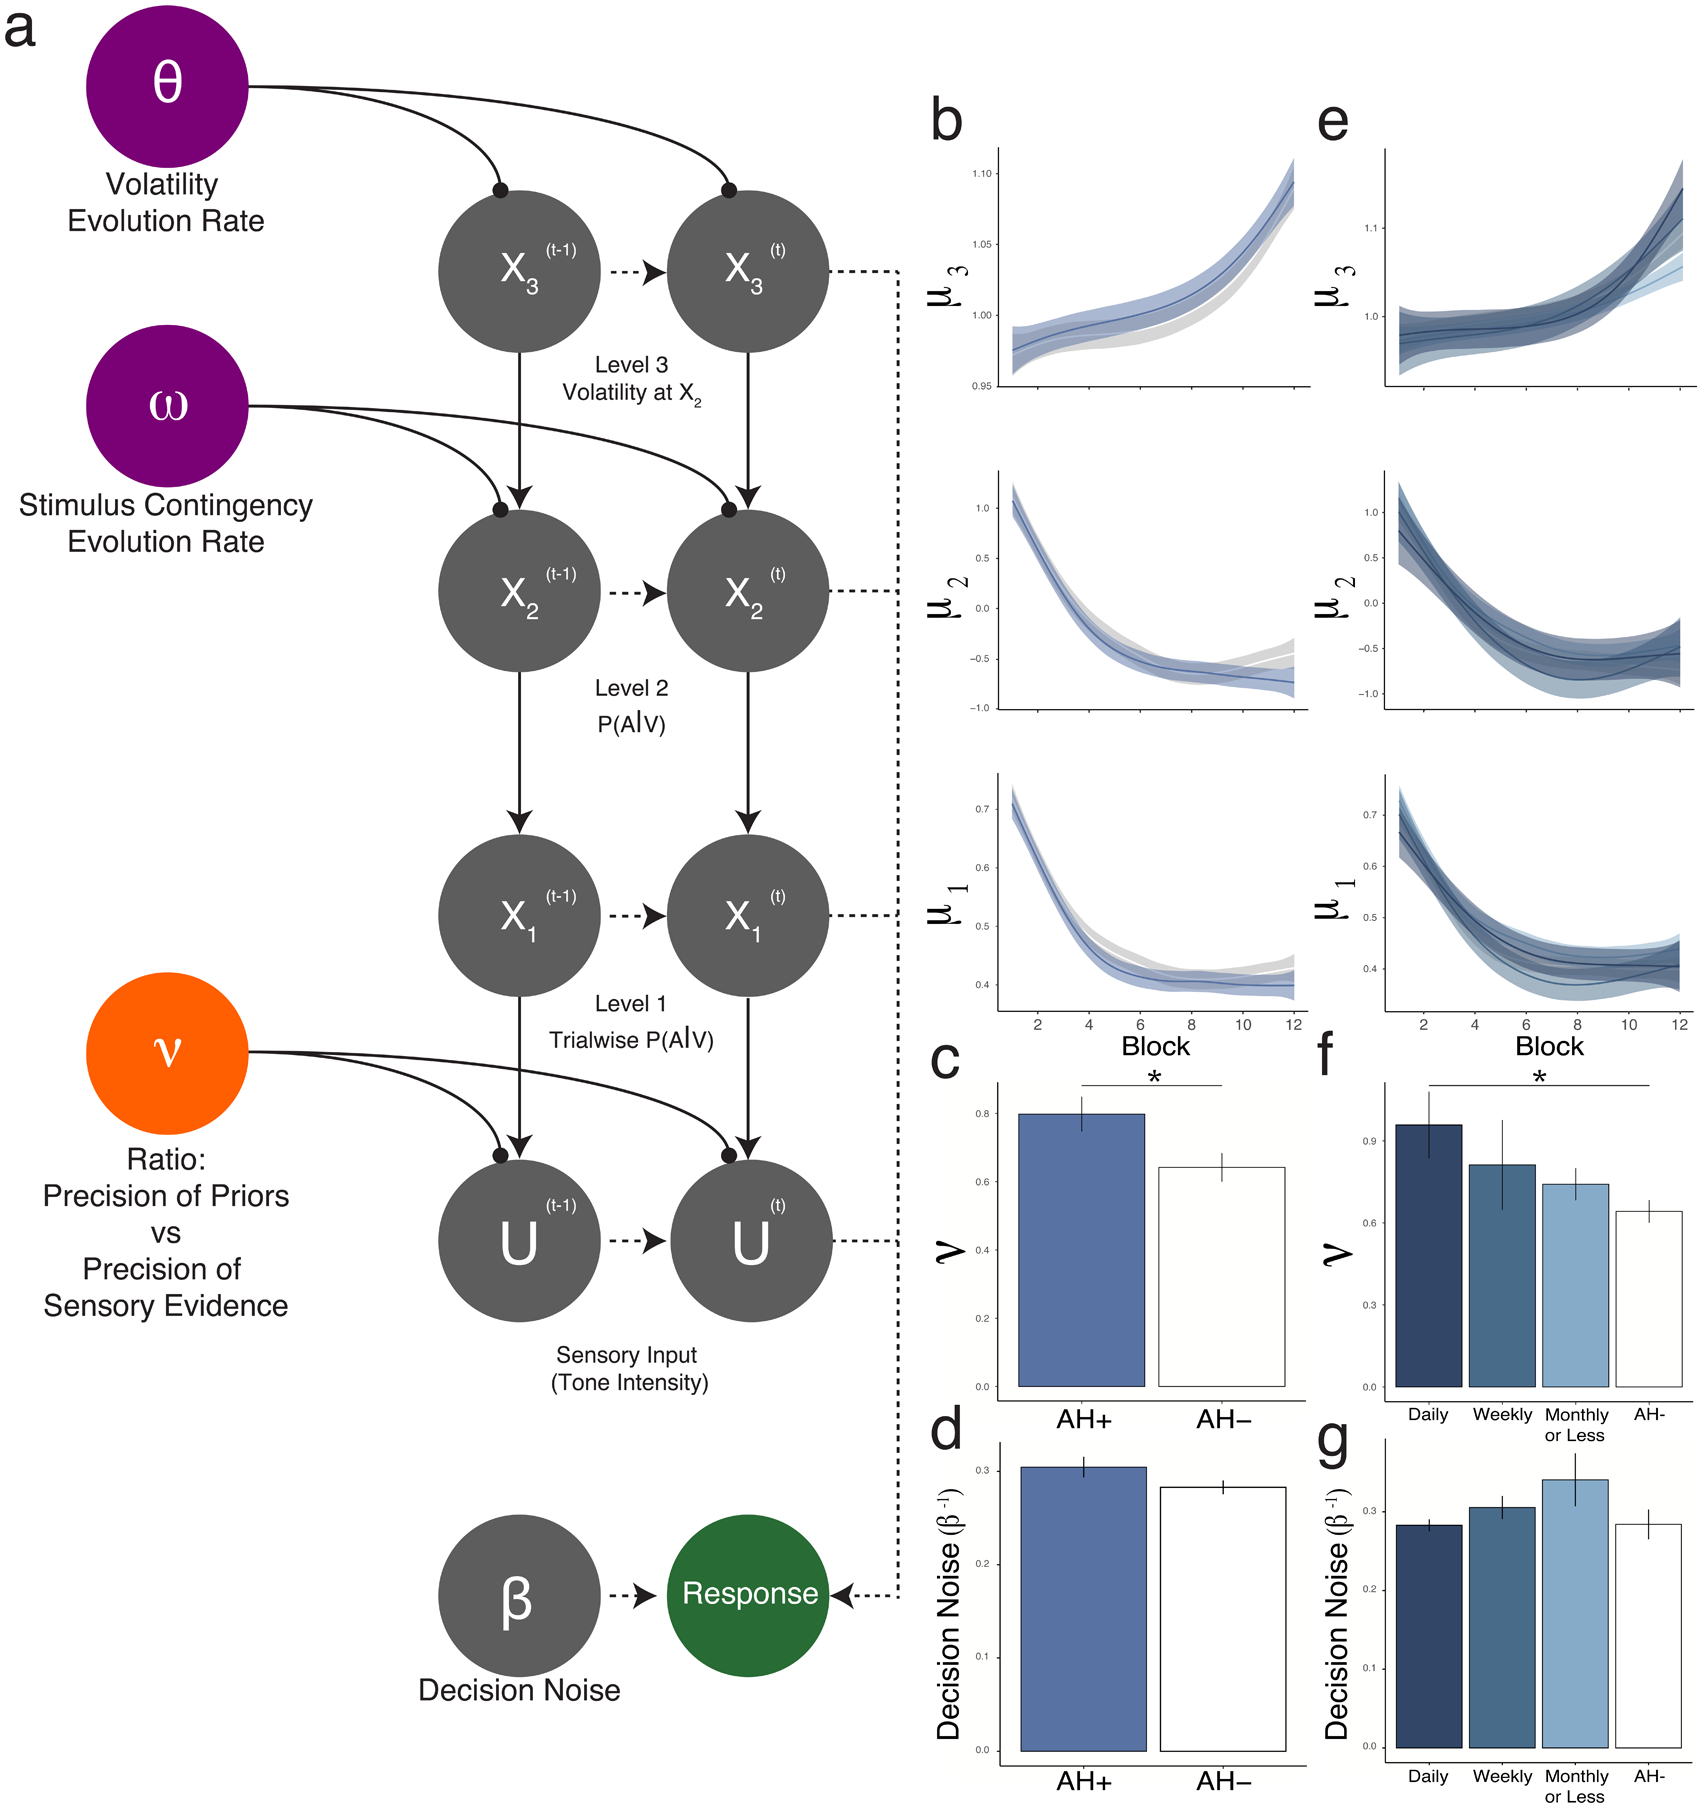
a. HGF model, mapping the combination of latent states (e.g., trajectories X1-X3, relative prior weighting v, inverse decision temperature / decision noise β−1, evolution rates ω and θ) to recorded responses, taking into account trial-wise stimulus strength (U). The first level (X1) represents the target tone’s presence on trial t. The second level (X2) represents the contingency between the visual and auditory stimuli. The third level (X3) represents the volatility of the relationship between the visual and auditory stimuli over the course of the experiment. Critically, responses are modelled allowing for individual variation in weighting between sensory evidence and perceptual beliefs (parameter ν). b-g. Belief trajectories do not differ between AH+ and AH− groups at any level (b), nor did decision noise (d), whereas prior weighting was greater in AH+ than in AH− (c). A similar pattern of results was seen when participants were divided into frequency groups, which did not differ in belief trajectories (e) or decision noise (g). By contrast, relative prior weighting (f) scaled with hallucination frequency.
Re-test sample and procedures
In order to assess for changes in task performance that may relate to changes in clinical status, all COPE participants who completed initial assessments were invited to complete an additional follow-up assessment. Final re-test sample characteristics are outlined in Table S2. Participants repeated CHAT screening questions to assess for changes in hallucination state, in addition to the COPE scale, BAVQ-R, LSHS-R, and the CH task. To minimize transfer of prior learning, follow-up versions of the CH task used novel stimulus pairs, as cross-modal perceptual learning tends not to transfer across stimulus sets45–47. To allow for re-test at multiple time points per participant, stimulus pairs depended on time elapsed since initial assessment, although only one follow-up point was used for analysis: red horizontal stripes were used for individuals at first follow-up (<8 months after initial assessment); 45° blue stripes were used at second follow-up (>8 months after first assessment). Stripes were matched for luminance, complexity, and contrasts compared to the original stimulus set. Similarly, auditory stimuli used tones of 1250 Hz (first follow-up) and 1500 Hz (second follow-up). Otherwise, the structure and procedure of the task was as outlined above in the original task. For purposes of quantifying changes in hallucination frequency on follow-up assessment, hallucination frequency categories (e.g., “Once per week”) were converted to minimum occurrence rates over days (e.g., 1/7). To avoid divide-by-zero errors, relative changes were calculated as log ratios of final rates over initial rates.
Statistical Analysis
Differences between AH- and AH+ groups were computed using two-sample t-tests and Wilcoxon tests as appropriate. For comparisons of means across frequency groups, one-way ANOVA was used. Correlations were computed using Pearson correlations. All statistical analyses were completed using the R packages tableone, plotrix, car, nlme and afex performed with RStudio version 1.4.1717 (http://www.rstudio.com/).
Results
Sample Characteristics
Table 1 reports the summary of the demographic and clinical features of our final balanced sample. The AH+ group (N=249) obtained significantly higher scores in propensity for hallucinations (LSHS) (T135=10.0, p<0.001) and delusions (PDI) (T426=14.5, p<2.2×10⁻¹⁶) than the AH− group (N=209). AH+ also reported a higher frequency of psychosis-spectrum illness (χ12=20.4, p<0.001), mental illness in general (χ12=35.1, p<0.001), and used more psychiatric medication (χ12=29.3, p<0.001) than AH-. The groups did not differ significantly on age, sex, or reported race.
Table 1.
Sample demographic and clinical characteristics of original and follow-up samples.
| AH− | AH+ | P | Follow-up | |
|---|---|---|---|---|
| n | 209 | 249 | 40 | |
| Age (mean (SD)) | 37.78 (10.95) | 38.17 (13.75) | 0.741 | 39.5 (15.81) |
| Total LSHS Score(mean (SD)) | 5.91 (6.12) | 16.28 (9.38) | <0.001 | 11.18 (11.07) |
| Total PDI Score(mean (SD)) | 1.96 (2.65) | 6.63 (4.17) | <0.001 | 6.18 (4.67) |
| Self Report, Mental Illness | ||||
| n(%) | 18 (10.2) | 88 (36.1) | <0.001 | 15 (37.5) |
| Race n(%) | 0.384 | |||
| American Indian/Alaskan Native | 5 (2.4) | 2 (0.8) | 0 (0.0) | |
| Asian | 19 (9.1) | 28 (11.2) | 7 (17.5) | |
| Native Hawaiian or Other Pacific Islander | 1 (0.5) | 2 (0.8) | 0 (0.0) | |
| Black or African American | 6 (2.9) | 8 (3.2) | 0 (0.0) | |
| White | 164 (78.5) | 185 (74.3) | 30 (0.75) | |
| More than one race | 7 (3.3) | 18 (7.2) | 3 (7.5) | |
| Unknown/Prefer not to say | 7 (3.3) | 6 (2.4) | 0 (0.0) | |
| Sex | ||||
| F n(%) | 121 (57.9) | 166 (66.7) | 0.066 | 28 (70.0) |
| Current Medication Use | ||||
| n(%) | 10 (4.8) | 58 (23.3) | <0.001 | 9 (22.5) |
| Self Report, Psychosis Spectrum Illness | ||||
| n(%) | 1 (0.5) | 28 (11.2) | <0.001 | 3 (7.50) |
| Total Raven Score (out of 9) | ||||
| (mean (SD)) | 6.36 (1.69) | 6.07 (1.83) | 0.079 | 5.00 (0.41) |
Conditioned hallucination rates and confidence are higher in AH+
AH+ and AH− groups did not differ on the QUEST-derived threshold (Fig. 2a), but AH+ participants were more likely to report CH (T450=2.71, p=6.9×10⁻³; Fig. 2b). This difference survived after controlling for the presence of self-reported psychotic-spectrum illness (by ANCOVA; F1,455=1, p=6.2×10⁻³) and limiting responses to only those with high confidence (T446 = 2.50, p = 0.013). Similarly, effects survived when the AH+ group was extended to include those who indicated yes on any item 1–8 in the CHAT-AH (N = 360) and those who reported no on all items (N = 98; T161 = 2.549, p = 0.012). Significant differences between AH+ and AH− groups emerged early during the fourth block of the experiment, at the twenty-sixth presentation of a no-tone trial (Fig. 2d). Maximal statistical difference was noted at trial 62 (T455=3.27, p=1.2×10⁻³). Performance did not differ significantly on any other conditions (Fig. S2).
Figure 2. Behavioral Results.
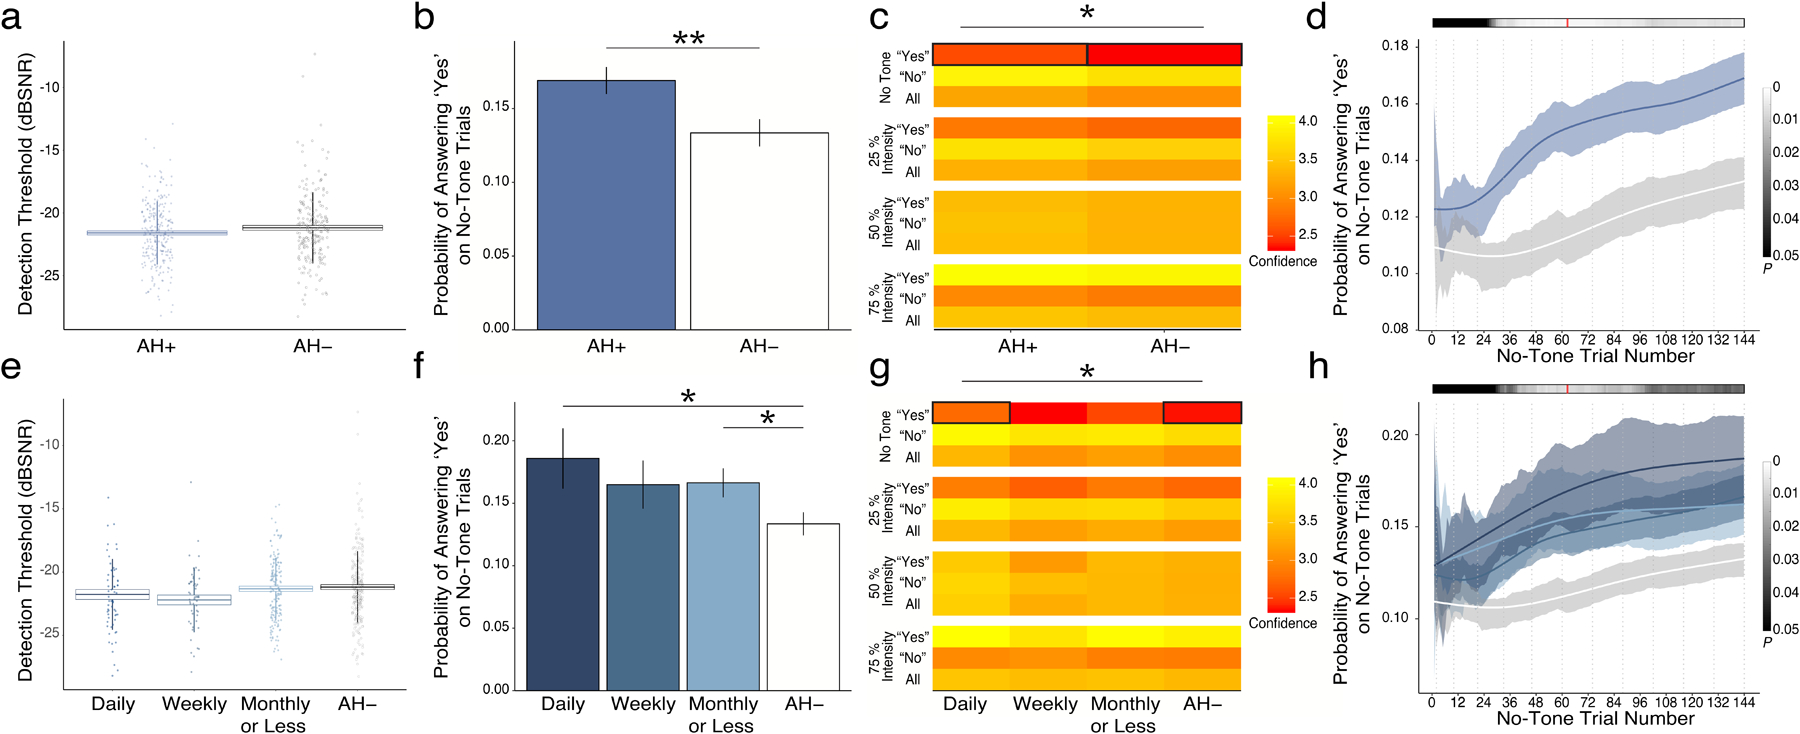
a. Calculated thresholds for tone detection were similar to those previously reported19,20 and did not differ between hallucinating (AH+) and non-hallucinating (AH-) groups. b. Probability of reporting CH was significantly higher in AH+ than in AH− groups. c. Confidence in reporting CH was also higher in AH+ than in AH− groups. d. Trial-wise analysis of the emergence of behavioral effects demonstrated early differences in means that became significant in experimental block 4 and reached their maximum in early block 7 of 12. AH+ was divided into three groups based on reported hallucination frequency: Daily (N=49), Weekly (N=43), and Monthly or Less (N=146). Results parsed by frequency of clinical hallucinations demonstrated similar lack of differences in threshold (e), but showed that probability of (f) and confidence in (g) reporting CH differed significantly by frequency of voice-hearing. h. Emergence of behavioral effects showed a similar profile to group-wise effects in panel d and means effects in panel f.
Pertaining to confidence ratings, there was a significant interaction between the answer choice and condition (F6,4966=529, p=2×10⁻¹⁶): participants were more confident reporting detection and less confident reporting non-detection with increasing target loudness. There was a significant interaction between hallucination status and condition (F3,4966=2.7, p=0.045). Participants with hallucinations had higher confidence in reporting conditioned hallucinations (T427=2.23, p=0.026).
Conditioned hallucination rates and confidence ratings scale with severity of auditory hallucinations
Probability of reporting CH varied significantly according to the frequency of reported hallucinations (Fig. 2f; F3,445=7.68, p=5.0×10⁻³; r445=0.13, p=6.0×10⁻³). Significant differences emerged early (no-tone trial 28) and hit their maximum again at no-tone trial 62 (F3,445 =12.1; p=5.9×10⁻³; Fig. 2h). Post-hoc differences were evident between Daily and AH− (T62=2.14, p=0.036) as well as Monthly and AH− (T304=2.15, p=0.032) groups. Participants also completed the Peters Delusion Inventory to assess delusional ideation. Individuals with higher CH rates reported higher delusional ideation (r456 = 0.004, p = 0.0215). However, this relationship did not persist after accounting for current frequency of hallucinations (F1,448 = 2.599, p = 0.108). Similarly, within the AH+ group who completed the Launay-Slade Hallucination Scale, PDI was no longer a statistically significant predictor of CH rate (F1,210 = 1.492, p = 0.223) after accounting for LSHS total scores (R211 = 0.149, F1,210 = 4.824, p = 0.0292)
We further investigated if the relationship between CH rate and hallucination status reflected current or overall susceptibility to hallucinations within participants who reported having hallucinations and completed detailed phenomenological surveys about their hallucinations (n=220). CH rates significantly correlated with hallucination frequency within the last two days (r218=0.13, p=0.042), and not with the frequency of hallucinations at the ‘worst time’ in their history (r218= 0.12, p=0.12).
Confidence ratings in reporting CH were significantly different between frequency groups (F3,435=4.98, p=0.026). Post-hoc analyses showed that the difference between Daily and AH− was significant (T70=4.98, p=0.021).
Relative prior weighting is higher in those who hallucinate and is associated with frequency of auditory hallucinations
To evaluate latent factors driving performance on the CH task, we fit participants’ behavioral data to a three-tiered model of perception, the Hierarchical Gaussian Filter (HGF)42,43, which we have done in past work19,20 (Fig. 3a). The HGF is particularly useful in its ability to directly model the degree to which participants rely on their priors when making perceptual judgments (relative prior weighting, ν). The AH+ group exhibited higher prior weighting (T451=2.3, p=0.021) (Fig. 3c) but not belief trajectories (X1-X3) (Fig. 3b) or decision noise (β−1) (Fig. 3c).
The relative prior weighting parameter (ν) was found to vary according to frequency of auditory hallucinations (F1,445=7.42, p=6.6×10⁻³; R445=0.13, p =7.0×10⁻³). Conversely, there was no difference in decision noise (β−1) between frequency groups.
The HGF also models the rate at which participants learn to associate the auditory stimulus with the stripes (ω2). This rate of association-building was found to decrease with increases in cognitive functioning, based on Raven’s Progressive Matrices score (R456 = −0.15, p = 1.16 × 10⁻³).
Changes in conditioned hallucinations and prior weighting vary with changes in auditory hallucination frequency.
A subset of participants (N = 40; see Table 1 for sample characteristics) completed a repeated-measures version of the CH task several months (mean±SD = 375.54 ± 113.99 days) after initial performance. Those who did not report auditory hallucinations at baseline or during follow-up assessments(N = 6) were excluded from final analyses. As shown in Figure 4a, those who reported an increase in hallucination frequency during follow-up sessions showed higher rates of conditioned hallucinations relative to their initial CH rate than those with decreased hallucination frequency (p = 0.026, r = 0.377, power = 0.808), while those with no change in frequency exhibited no change in conditioned hallucination rate. Correlation analysis corroborated this relationship: changes in AH frequency were associated with both changes in conditioned hallucination rate (Fig. 4b; r28 = 0.40, p= 0.028,) and changes in relative prior weighting (Fig. 4c; r28 = 0.378, p = 0.039), adjusted for baseline rates. Consistent with Figure 3, changes in conditioned hallucination rate correlated with changes in relative prior weighting (Fig. 4d; r33 = 0.594, p = 1.7 × 10⁻⁴).
Figure 4. Changes in conditioned hallucinations and prior weighting vary with changes in auditory hallucination frequency.
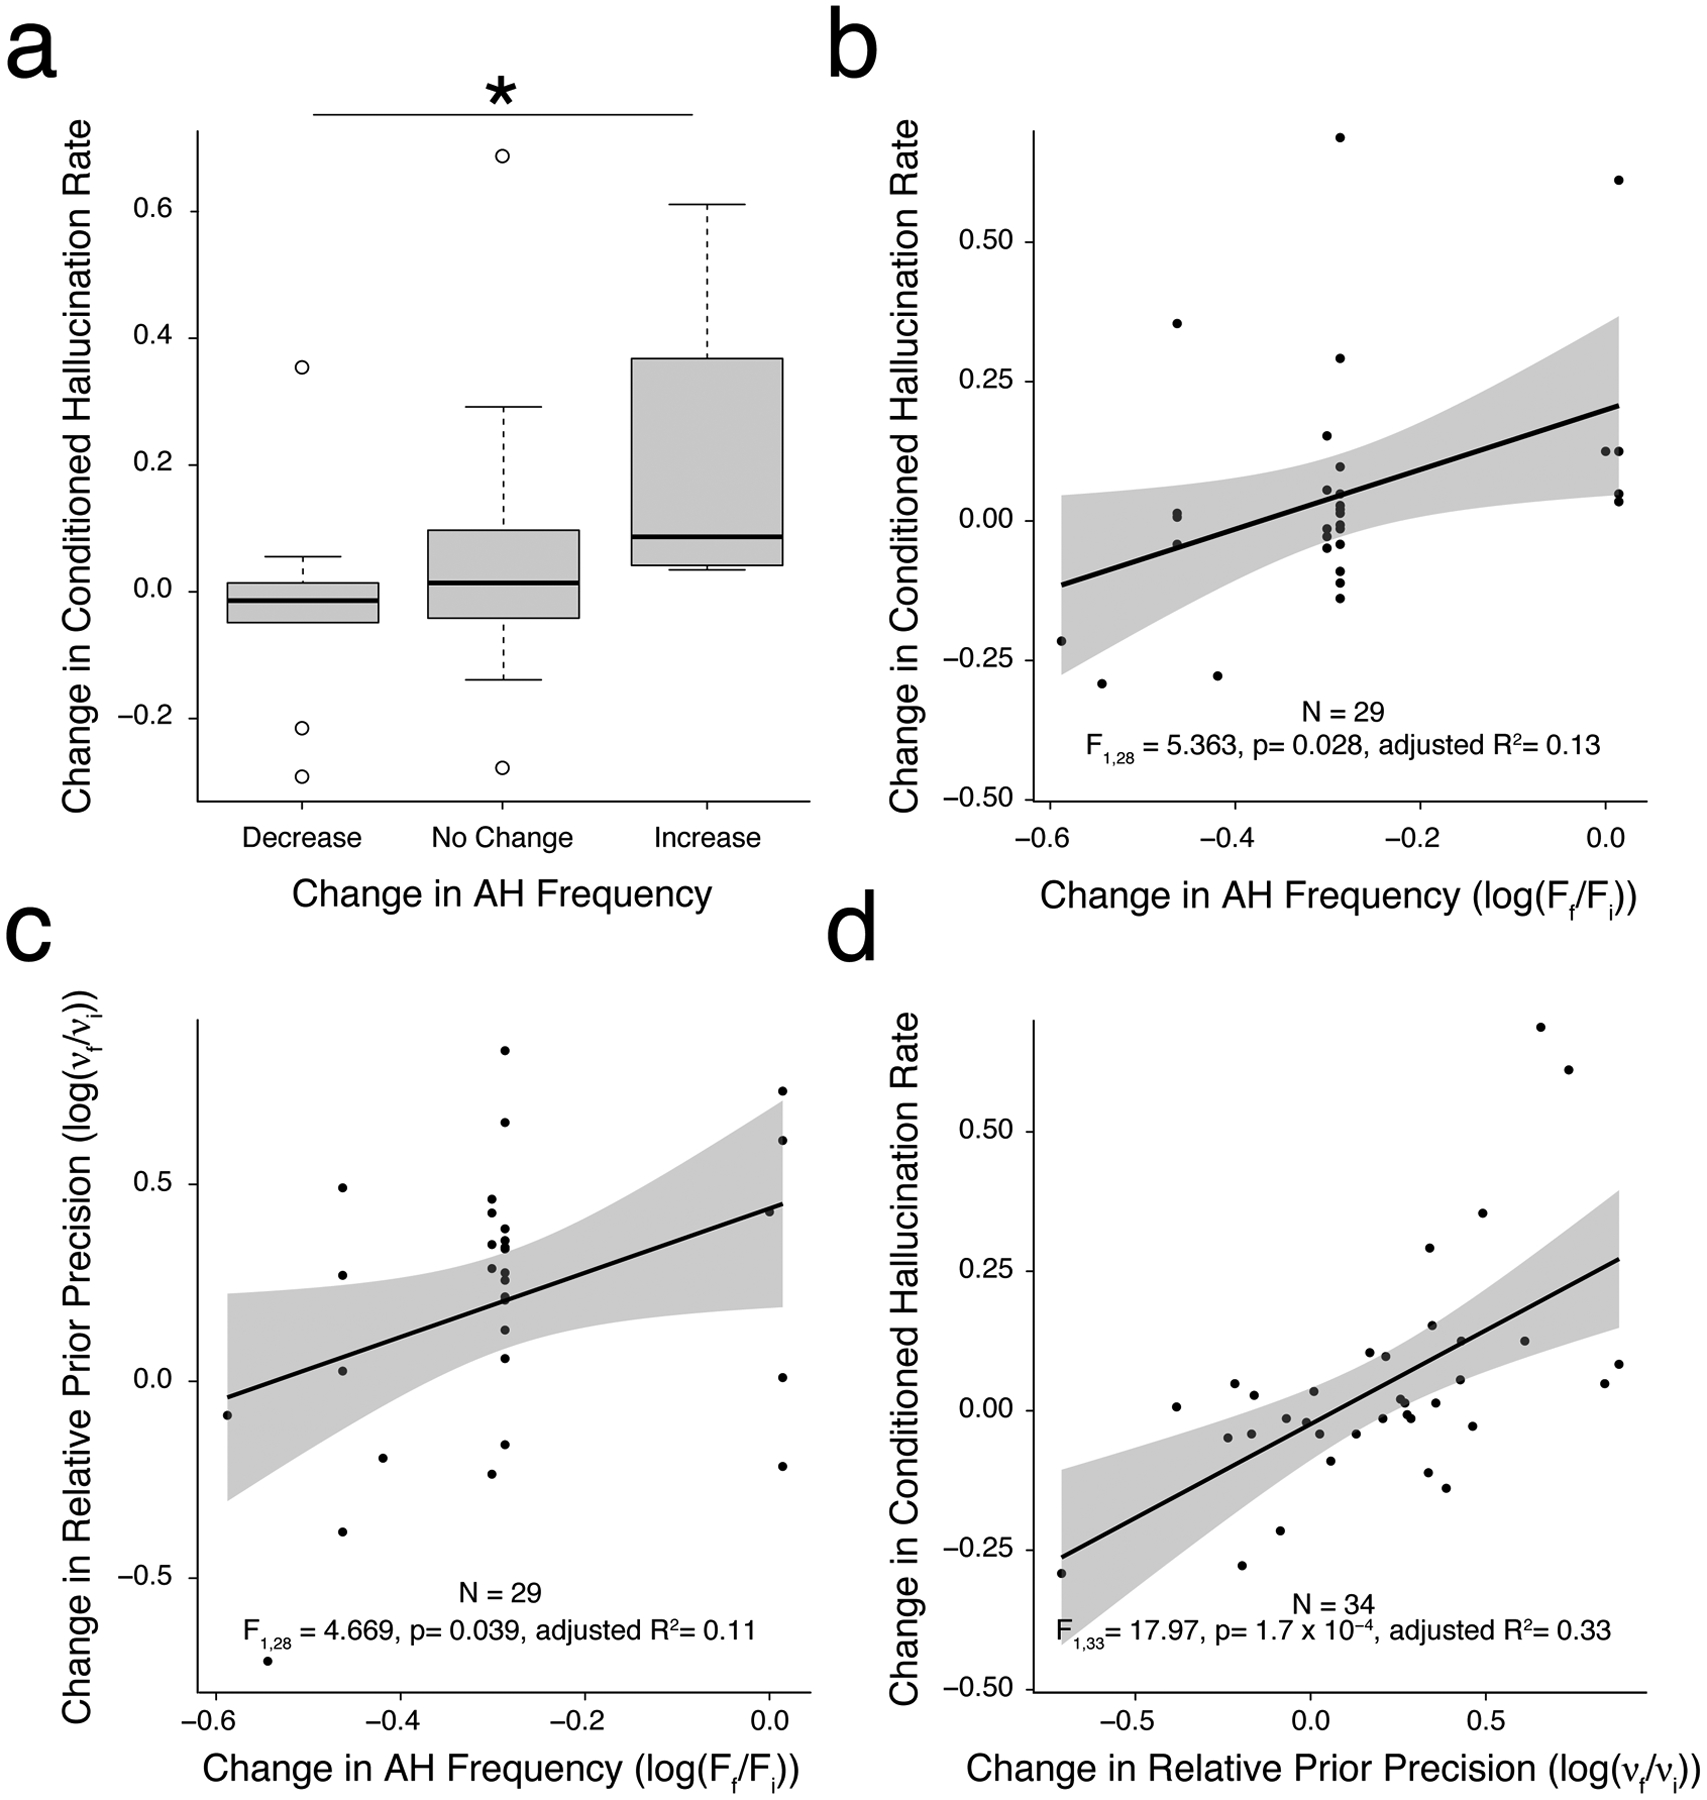
a. In a sub-sample of AH+ participants who performed a repeated-measures version of the CH task again after several months, those with an increase in hallucination frequency showed a higher rate of conditioned hallucinations than those with a decrease, while those without a change in frequency demonstrated no change in conditioned hallucination rate. b-d. Correlations demonstrating both conditioned hallucinations rate (b) and relative prior weighting (c) track with changes in AH frequency on follow-up, and that changes conditioned hallucinations rate are attributable to changes in prior weighting (d). *, p < 0.05.
Discussion
In a large, heterogeneous sample of individuals with hallucinations, we have provided evidence for a link between conditioned hallucinations, relative prior weighting in perception, and recent hallucination frequency. Previous work highlights the relationship between relative prior weighting and auditory hallucinations in small sub-groups of people who frequently heard voices with distinctly clear acoustic qualities16,19. In the data we present here, inclusion of individuals with a broad range of phenomenological characteristics, daily functioning, and clinical needs allowed us to examine the performance data and model parameter estimates for relationships to each of these quantities. As we have done in prior work19, we relate auditory conditioned hallucination rates to a propensity toward hallucinations in our diverse sample, both categorically and dimensionally, as measured by LSHS-R score. Rates of CH were lower in this diverse AH+ sample compared to previous highly-selected samples; however, examining CH rates and estimated relative prior weighting in sub-groups of individuals with daily hallucinations (Figs. 2, 3) yields estimates that closely approximate previously-reported rates19 despite wide variance in software and hardware implementation as well as stimulus set (see Figs. S3–S5).
Relationships between prior weighting, conditioned hallucinations, and frequency of hallucinations are evident throughout the data set. Conditioned hallucination rates and prior weighting are higher in high-frequency hallucinating groups on cross-sectional analysis (Figs. 2 and 3) and track with changes in frequency of hallucinations during follow-up sessions even after adjustment for baseline frequency (Fig. 4). Our findings that the relative weighting of priors is both higher in individuals who hallucinate and sensitive to changes in symptom severity suggests that relative prior weighting captures both static and dynamic elements of hallucinations. If increased prior weighting increases the likelihood of experiencing hallucinatory events, it may represent a latent brain state or mode of functioning that leads proximately to those events. This may be contrasted against other elements that, although increasing lifetime risk of having hallucinations (e.g., a history of trauma), do not translate to symptom severity on a more granular scale. While it is conceivable that these measures could lead directly to clinically useful tests in their current form, they are likely more useful as a means of identifying individuals exhibiting specific vulnerabilities toward hallucinations that may be intervened upon specifically to decrease hallucination severity. However, future interventional studies are required to understand the exact temporal relationships between prior weighting and hallucination expression before hard conclusions can be drawn.
Our results contribute to the growing literature exploring computationally-derived biomarkers in psychiatry6,49,50. Biomarkers with some sensitivity to current symptom severity are able to track dynamic changes in symptomatology, capturing clinical worsening or improvement in response to treatment50,51. Returning to the example provided in the Introduction, psychosis, like hypothyroidism, has been conceptualized as a disease state52 that may be tracked by state-sensitive measure–like TSH–to detect progression toward development of psychotic symptoms like hallucinations as well as response to treatment. We have recently demonstrated that individuals at clinical high risk for psychosis (CHR-P) tend to rely on their priors20,53, which supports the usefulness of this measure in tracking risk for clinical worsening before the onset of frank psychosis. Further work is required to demonstrate an extension of this vulnerability even earlier in the trajectory of psychotic illness, but it opens up the intriguing possibility of using our measures to track symptom susceptibility before the onset of any symptoms whatsoever among those who already exhibit a static risk for disease development54. This latter approach would allow for a more nuanced understanding of pathophysiology, where the interplay between static risk factors (such as gene expression) lead to a worsening of dynamic, state-sensitive markers of symptom susceptibility.
From the perspective of computational neuroscience, the fact that relative prior over-weighting can vary significantly over time yields important clues as to its neural instantiations. Although aberrations in synaptic density55, cortical morphology56–58, and white matter integrity59 increase psychosis risk, it is unlikely that these processes directly drive prior weighting. Rather, these factors may predispose to the development of neural states in which prior weighting is dynamically heightened, either absolutely or relative to degraded and unreliable sensory evidence. Due to the short timescales over which changes in Bayesian inference have been observed, any neural mechanisms underlying these changes (e.g., phasic neuromodulator release) must also be dynamic.7,9,60. This is largely consistent with recent findings that prior weighting is related to dopamine synthesis capacity18, and that cholinergic modulation affects reliance on the weighting afforded to sensory evidence61. Further research is needed to assess the relationship between these processes and other known dynamic factors at play in psychosis, such as glutamatergic neurotransmission and excitation / inhibition balance62. Recent evidence explicitly links disinhibition of pyramidal cells in auditory cortex to perceptual abnormalities in early psychosis63, and there may plausibly be a role for several neuromodulatory systems in the perceptual processes we describe here.
The identification of a computationally-driven method of identifying risk factors in individuals with hallucinations is the first step toward individualized risk and treatment prediction based on distinct etiologies64. The current work extends these efforts by identifying parameters within a specific, formalized model of perception that may lead to hallucination expression. We anticipate that subgroup identification based upon such a formal system may take advantage of emerging knowledge of the neural18,19 and biochemical61 underpinnings of prior weighting to identify biologically-based interventions most likely to alter the pathophysiological processes leading to initial symptom expression.
Supplementary Material
Acknowledgments
ARP is supported by a K23 Career Development Award and R21 from the National Institute of Mental Health (K23 MH115252–01A1; 5R21 MH122940-02), by a Career Award for Medical Scientists from the Burroughs-Wellcome Fund, and by the Yale Department of Psychiatry and the Yale School of Medicine. AMN received support through the Veterans Affairs Office of Academic Achievement postdoctoral fellowship program. The authors would like to thank Drs. Godfrey Pearlson, Scott Woods, Phil Corlett, and Ralph Hoffman for their roles in inspiring the work conducted.
References
- 1.Clementz BA, Sweeney J, Keshavan MS, Pearlson G & Tamminga CA Using biomarker batteries. Biol. Psychiatry 77, 90–92 (2015). [DOI] [PubMed] [Google Scholar]
- 2.Gambacorti-Passerini C et al. Multicenter Independent Assessment of Outcomes in Chronic Myeloid Leukemia Patients Treated With Imatinib. JNCI: Journal of the National Cancer Institute vol. 103 553–561 (2011). [DOI] [PubMed] [Google Scholar]
- 3.Papaleontiou M & Cappola AR Thyroid-Stimulating Hormone in the Evaluation of Subclinical Hypothyroidism. JAMA 316, 1592–1593 (2016). [DOI] [PMC free article] [PubMed] [Google Scholar]
- 4.Stephan KE & Mathys C Computational approaches to psychiatry. Curr. Opin. Neurobiol 25, 85–92 (2014). [DOI] [PubMed] [Google Scholar]
- 5.Wang XJ & Krystal JH Computational psychiatry. Neuron 84, 638–654 (2014). [DOI] [PMC free article] [PubMed] [Google Scholar]
- 6.Browning M et al. Realizing the Clinical Potential of Computational Psychiatry: Report From the Banbury Center Meeting, February 2019. Biol. Psychiatry 88, e5–e10 (2020). [DOI] [PubMed] [Google Scholar]
- 7.Adams RA, Stephan KE, Brown HR, Frith CD & Friston KJ The computational anatomy of psychosis. Front. Psychiatry 4, 47 (2013). [DOI] [PMC free article] [PubMed] [Google Scholar]
- 8.Fletcher PC & Frith CD Perceiving is believing: a Bayesian approach to explaining the positive symptoms of schizophrenia. Nat. Rev. Neurosci 10, 48–58 (2009). [DOI] [PubMed] [Google Scholar]
- 9.Friston KJ Hallucinations and perceptual inference. Behav. Brain Sci 28, 764–+ (2005). [Google Scholar]
- 10.Summerfield C et al. Predictive codes for forthcoming perception in the frontal cortex. Science 314, 1311–1314 (2006). [DOI] [PubMed] [Google Scholar]
- 11.Hohwy J Attention and conscious perception in the hypothesis testing brain. Front. Psychol 3, 96 (2012). [DOI] [PMC free article] [PubMed] [Google Scholar]
- 12.Friston K & Kiebel S Predictive coding under the free-energy principle. Philos. Trans. R. Soc. Lond. B Biol. Sci 364, 1211–1221 (2009). [DOI] [PMC free article] [PubMed] [Google Scholar]
- 13.Powers AR Iii, Kelley M & Corlett PR Hallucinations as Top-Down Effects on Perception. Biological Psychiatry: Cognitive Neuroscience and Neuroimaging 1, 393–400 (2016). [DOI] [PMC free article] [PubMed] [Google Scholar]
- 14.Corlett PR et al. Hallucinations and Strong Priors. Trends Cogn. Sci 23, (2019). [DOI] [PMC free article] [PubMed] [Google Scholar]
- 15.Teufel C et al. Shift toward prior knowledge confers a perceptual advantage in early psychosis and psychosis-prone healthy individuals. Proc. Natl. Acad. Sci. U. S. A (2015) doi: 10.1073/pnas.1503916112. [DOI] [PMC free article] [PubMed] [Google Scholar]
- 16.Alderson-Day B et al. Distinct processing of ambiguous speech in people with non-clinical auditory verbal hallucinations. Brain 140, 2475–2489 (2017). [DOI] [PubMed] [Google Scholar]
- 17.Zarkali A et al. Increased weighting on prior knowledge in Lewy body-associated visual hallucinations. Brain Communications vol. 1 (2019). [DOI] [PMC free article] [PubMed] [Google Scholar]
- 18.Cassidy CM et al. A Perceptual Inference Mechanism for Hallucinations Linked to Striatal Dopamine. Curr. Biol 28, 503–514 e4 (2018). [DOI] [PMC free article] [PubMed] [Google Scholar]
- 19.Powers AR, Mathys C & Corlett PR Pavlovian conditioning-induced hallucinations result from overweighting of perceptual priors. Science 357, 596–600 (2017). [DOI] [PMC free article] [PubMed] [Google Scholar]
- 20.Kafadar E et al. Modeling perception and behavior in individuals at clinical high risk for psychosis: Support for the predictive processing framework. Schizophr. Res (2020) doi: 10.1016/j.schres.2020.04.017. [DOI] [PMC free article] [PubMed] [Google Scholar]
- 21.Harris Paul A., Taylor Robert, Minor Brenda L., Elliott Veida, Fernandez Michelle, O’Neal Lindsay, McLeod Laura, Delacque Giovanni, Delacqua Francesco, Kirby Jacqueline, Duda Stephany N., on behalf of the REDCap Consortium. The REDCap consortium: Building an international community of software platform partners. J. Biomed. Inform 95, 103208 (2019). [DOI] [PMC free article] [PubMed] [Google Scholar]
- 22.Harris Paul A., Taylor Robert, Thielke Robert, Payne Jonathon, Gonzalez Nathaniel, Conde Jose G.. Research electronic data capture (REDCap)—A metadata-driven methodology and workflow process for providing translational research informatics support. J. Biomed. Inform 42, 377–381 (2009). [DOI] [PMC free article] [PubMed] [Google Scholar]
- 23.Barrett Kern PD, Jenna Axelrod MS, Yangfeifei Gao BA & Keedy S Exchange the magnifying glass for a microscope: The Chicago Hallucination Assessment Tool (CHAT). Schizophr. Bull 41, S110 (2015). [Google Scholar]
- 24.Stephane M, Pellizzer G, Roberts S & McClannahan K Computerized binary scale of auditory speech hallucinations (cbSASH). Schizophr. Res 88, 73–81 (2006). [DOI] [PubMed] [Google Scholar]
- 25.Strauss C et al. The Beliefs about Voices Questionnaire - Revised: A factor structure from 450 participants. Psychiatry Res. 259, 95–103 (2018). [DOI] [PMC free article] [PubMed] [Google Scholar]
- 26.Launay G & Slade P The measurement of hallucinatory predisposition in male and female prisoners. Pers. Individ. Dif 2, 221–234 (1981). [Google Scholar]
- 27.Bentall RP & Slade PD Reliability of a scale measuring disposition towards hallucination: a brief report. Pers. Individ. Dif 6, 527–529 (1985). [Google Scholar]
- 28.Mourgues-Codern, Hammer Catalina V., Kafadar Allison, Quagan Eren, Bien Brittany M, Jaeger Claire, Sibarium Hale, Negreira Ely, Sarisik Alyson, Polisetty Elif, Eken Vasishta, Imtiaz Hatice Nur, Niles Ayyub, Sheldon Halsey F., Powers Andrew D., Albert R Measuring Voluntary Control Over Hallucinations:The Yale Control Over Perceptual Experiences (COPE) Scales. None. [DOI] [PMC free article] [PubMed] [Google Scholar]
- 29.Peters E, Joseph S, Day S & Garety P Measuring delusional ideation: the 21-item Peters et al. Delusions Inventory (PDI). Schizophr. Bull 30, 1005–1022 (2004). [DOI] [PubMed] [Google Scholar]
- 30.Bilker WB et al. Development of abbreviated nine-item forms of the Raven’s standard progressive matrices test. Assessment 19, 354–369 (2012). [DOI] [PMC free article] [PubMed] [Google Scholar]
- 31.Miller HA Miller Forensic Assessment of Symptoms Test (M–FAST). Encyclopedia of Psychology and Law doi: 10.4135/9781412959537.n195. [DOI] [Google Scholar]
- 32.Powers AR, Corlett PR & Ross DA Guided by Voices: Hallucinations and the Psychosis Spectrum. Biological Psychiatry vol. 84 e43–e45 (2018). [DOI] [PMC free article] [PubMed] [Google Scholar]
- 33.Seashore CE Measurements of illusions and hallucinations in normal life. (1895).
- 34.Ellson DG Hallucinations produced by sensory conditioning. Journal of Experimental Psychology vol. 28 1 (1941). [Google Scholar]
- 35.Kot T & Serper M Increased susceptibility to auditory conditioning in hallucinating schizophrenic patients: a preliminary investigation. J. Nerv. Ment. Dis 190, 282–288 (2002). [DOI] [PubMed] [Google Scholar]
- 36.Watson AB & Pelli DG QUEST: a Bayesian adaptive psychometric method. Percept. Psychophys 33, 113–120 (1983). [DOI] [PubMed] [Google Scholar]
- 37.Treutwein B & Strasburger H Fitting the psychometric function. Percept. Psychophys 61, 87–106 (1999). [DOI] [PubMed] [Google Scholar]
- 38.Daalman K et al. The same or different? A phenomenological comparison of auditory verbal hallucinations in healthy and psychotic individuals. J. Clin. Psychiatry 72, 320–325 (2011). [DOI] [PubMed] [Google Scholar]
- 39.Ohayon MM Prevalence of hallucinations and their pathological associations in the general population. Psychiatry Res. 97, 153–164 (2000). [DOI] [PubMed] [Google Scholar]
- 40.Choong C, Hunter MD & Woodruff PWR Auditory hallucinations in those populations that do not suffer from schizophrenia. Current Psychiatry Reports vol. 9 206–212 (2007). [DOI] [PubMed] [Google Scholar]
- 41.Beavan V, Read J & Cartwright C The prevalence of voice-hearers in the general population: a literature review. J. Ment. Health 20, 281–292 (2011). [DOI] [PubMed] [Google Scholar]
- 42.Mathys CD et al. Uncertainty in perception and the Hierarchical Gaussian Filter. Front. Hum. Neurosci 8, 825 (2014). [DOI] [PMC free article] [PubMed] [Google Scholar]
- 43.Mathys C, Daunizeau J, Friston KJ & Stephan KE A bayesian foundation for individual learning under uncertainty. Front. Hum. Neurosci 5, 39 (2011). [DOI] [PMC free article] [PubMed] [Google Scholar]
- 44.Frässle S et al. TAPAS: an open-source software package for Translational Neuromodeling and Computational Psychiatry. bioRxiv 2021.03.12.435091 (2021) doi: 10.1101/2021.03.12.435091. [DOI] [PMC free article] [PubMed] [Google Scholar]
- 45.Powers AR, Hillock-Dunn A & Wallace MT Generalization of multisensory perceptual learning. Sci. Rep 6, (2016). [DOI] [PMC free article] [PubMed] [Google Scholar]
- 46.Shams L & Seitz AR Benefits of multisensory learning. Trends Cogn. Sci 12, 411–417 (2008). [DOI] [PubMed] [Google Scholar]
- 47.Kim RS, Seitz AR & Shams L Benefits of stimulus congruency for multisensory facilitation of visual learning. PLoS One 3, e1532 (2008). [DOI] [PMC free article] [PubMed] [Google Scholar]
- 48.Quagan B, Woods SW & Powers AR Navigating the Benefits and Pitfalls of Online Psychiatric Data Collection. JAMA Psychiatry (2021) doi: 10.1001/jamapsychiatry.2021.2315. [DOI] [PMC free article] [PubMed] [Google Scholar]
- 49.Barron DS et al. Decision Models and Technology Can Help Psychiatry Develop Biomarkers. Front. Psychiatry 12, 706655 (2021). [DOI] [PMC free article] [PubMed] [Google Scholar]
- 50.García-Gutiérrez MS et al. Biomarkers in Psychiatry: Concept, Definition, Types and Relevance to the Clinical Reality. Front. Psychiatry 11, 432 (2020). [DOI] [PMC free article] [PubMed] [Google Scholar]
- 51.Lema YY, Gamo NJ, Yang K & Ishizuka K Trait and state biomarkers for psychiatric disorders: Importance of infrastructure to bridge the gap between basic and clinical research and industry. Psychiatry Clin. Neurosci 72, 482–489 (2018). [DOI] [PubMed] [Google Scholar]
- 52.Cannon TD Psychosis, schizophrenia, and states vs. traits. Schizophr. Res (2021) doi: 10.1016/j.schres.2021.12.001. [DOI] [PubMed] [Google Scholar]
- 53.Iii ARP, Powers AR III, McGlashan TH & Woods SW Clinical phenomenology of the prodrome for psychosis. Psychotic Disorders 105–112 (2020) doi: 10.1093/med/9780190653279.003.0013. [DOI] [Google Scholar]
- 54.Singh T, Neale BM & Daly MJ Exome sequencing identifies rare coding variants in 10 genes which confer substantial risk for schizophrenia. medRxiv (2020) doi: 10.1101/2020.09.18.20192815. [DOI] [Google Scholar]
- 55.Onwordi EC et al. Synaptic density marker SV2A is reduced in schizophrenia patients and unaffected by antipsychotics in rats. Nat. Commun 11, 246 (2020). [DOI] [PMC free article] [PubMed] [Google Scholar]
- 56.Velakoulis D et al. Hippocampal volume in first-episode psychoses and chronic schizophrenia: a high-resolution magnetic resonance imaging study. Arch. Gen. Psychiatry 56, 133–141 (1999). [DOI] [PubMed] [Google Scholar]
- 57.Velakoulis D et al. Hippocampal and amygdala volumes according to psychosis stage and diagnosis: a magnetic resonance imaging study of chronic schizophrenia, first-episode psychosis, and ultra-high-risk individuals. Arch. Gen. Psychiatry 63, 139–149 (2006). [DOI] [PubMed] [Google Scholar]
- 58.Kubicki M & Shenton ME Neuroimaging in Schizophrenia. (Springer Nature, 2020). [Google Scholar]
- 59.Davis KL et al. White matter changes in schizophrenia: evidence for myelin-related dysfunction. Arch. Gen. Psychiatry 60, 443–456 (2003). [DOI] [PubMed] [Google Scholar]
- 60.Friston KJ, Stephan KE, Montague R & Dolan RJ Computational psychiatry: the brain as a phantastic organ. Lancet Psychiatry 1, 148–158 (2014). [DOI] [PubMed] [Google Scholar]
- 61.Marshall L et al. Pharmacological Fingerprints of Contextual Uncertainty. PLoS Biol. 14, e1002575 (2016). [DOI] [PMC free article] [PubMed] [Google Scholar]
- 62.Jardri R et al. Are Hallucinations Due to an Imbalance Between Excitatory and Inhibitory Influences on the Brain? Schizophr. Bull 42, 1124–1134 (2016). [DOI] [PMC free article] [PubMed] [Google Scholar]
- 63.Adams RA et al. Computational Modeling of Electroencephalography and Functional Magnetic Resonance Imaging Paradigms Indicates a Consistent Loss of Pyramidal Cell Synaptic Gain in Schizophrenia. Biol. Psychiatry (2021) doi: 10.1016/j.biopsych.2021.07.024. [DOI] [PMC free article] [PubMed] [Google Scholar]
- 64.Hidalgo-Mazzei D, Young AH, Vieta E & Colom F Behavioural biomarkers and mobile mental health: a new paradigm. Int J Bipolar Disord 6, 9 (2018). [DOI] [PMC free article] [PubMed] [Google Scholar]
- 65.Chesterman LP, Paul Chesterman L, Terbeck S & Vaughan F Malingered psychosis. Journal of Forensic Psychiatry & Psychology vol. 19 275–300 (2008). [Google Scholar]
- 66.Resnick PJ THE DETECTION OF MALINGERED PSYCHOSIS. Psychiatric Clinics of North America vol. 22 159–172 (1999). [DOI] [PubMed] [Google Scholar]
- 67.Resnick PJ & Knoll JL IV. Malingered psychosis. (2018).
- 68.Woods KJP, Siegel MH, Traer J & McDermott JH Headphone screening to facilitate web-based auditory experiments. Atten. Percept. Psychophys 79, 2064–2072 (2017). [DOI] [PMC free article] [PubMed] [Google Scholar]
Associated Data
This section collects any data citations, data availability statements, or supplementary materials included in this article.