Abstract
The use of combinations of anti-human immunodeficiency virus (anti-HIV) agents targeted to different molecular targets will most likely result in increased viral suppression and may also delay or prevent the emergence of resistant HIV strains. The purpose of the present study was to develop information on the in vitro anti-HIV activities of combinations of the reverse transcriptase inhibitor 1592U89 and the protease inhibitor 141W94 to help guide the choice of dosages in clinical trials. Triplicate in vitro dose-response matrices were prepared with MT-2 cells infected with HIV type 1 (HIV-1) strain IIIB. In order to account for the effects of protein binding, tissue culture medium with 10% fetal bovine serum was supplemented with the human serum proteins α1 acid glycoprotein (1 mg/ml) and albumin (40 mg/ml). The three-dimensional drug interaction surface for 1592U89 and 141W94 was constructed with the program MacSynergy II. As analyzed relative to a Bliss Independence null reference model, this combination was synergistic, with volumes of synergy exceeding 100 (99% confidence). Analysis of the data set with a fully parametric form of an equation for the quantitation of drug interaction developed by Greco et al. (W. R. Greco, G. Bravo, and J. C. Parsons, Pharmacol. Rev. 47:331–385, 1995) resulted in an interaction term statistically significantly greater than 0.0, indicating true synergy. Both methods concur that this combination is significantly synergistic. These data, with favorable findings from phase I/II trials for each drug alone, suggest that the combination of 1592U89 plus 141W94 should be further evaluated in clinical trials.
1592U89 and 141W94 are potent inhibitors of different molecular targets (reverse transcriptase and the human immunodeficiency virus [HIV] protease, respectively) in the HIV life cycle. Preliminary clinical data for both compounds indicate that, as single agents, each can decrease the baseline HIV RNA level, as determined by PCR, by 1.5 to 2.0 logs, and both compounds are well tolerated by patients (7, 8).
While protease inhibitors have been seen as the first truly potent anti-HIV compounds, early clinical experience with indinavir and ritonavir indicate that therapy with these compounds as single agents leads to the emergence of resistance in more than 40% of treated patients over a 24-week period. Furthermore, follow-on studies of combination chemotherapy indicates that the viral load in greater than 80% of patients will be decreased to less than the sensitivity of the assay, that there is a marked diminution of the level of selection of resistant variants, and that those variants selected occur later in the process. 1592U89 is the first nucleoside analog reverse transcriptase inhibitor which produces drops in HIV RNA levels, as determined by PCR, approximately equivalent to those seen with protease inhibitors.
It would therefore be desirable to have a potent pair of drugs, each targeting a different molecular mechanism in the HIV life cycle, which would be relatively nontoxic, which could be given on a schedule with which compliance is easy, and in which the drug interaction is clearly synergistic.
Determination of drug interaction in a statistical sense can be a challenging problem. A considerable literature regarding this problem has arisen, and this literature has been extensively viewed by Greco et al. (4). The definition of additivity is critical, so that statistical evaluations can differentiate interactions which are significantly greater than additive (synergy) and less than additive (antagonistic).
There are two major competing definitions of additivity, Bliss Independence and Loewe Additivity. Bliss Independence assumes a multiplicative interaction of drugs, as is evident from the equation defining additivity:
 |
where IC50,1 and IC50,2 are the drug concentrations resulting in 50% inhibition for drug 1 and drug 2, respectively; D1 and D2 are the concentrations of experimental drugs 1 and 2, respectively, Econ is the control effect in the absence of either drug, E is the observed (measured) effect, and m1 and m2 are the slope parameters for drug 1 and drug 2, respectively. Loewe Additivity, on the other hand, is defined in a more intuitively pleasing manner. Here, additivity is defined as the effect seen (with a second drug) which is the same as that seen when a drug is added to itself and is the concept most infectious diseases clinicians are familiar with when they consider additive drug interactions.
Somewhat surprisingly, given the considerable academic debate about the appropriate reference model for additivity, both definitions give outcomes which are reasonable and concordant for all but a small number of hyperselected cases.
We did not wish to potentially bias the results of the evaluation of drug interaction between 1592U89 and 141W94 by choosing only one specific null reference model for additivity. Consequently, we evaluated 1592U89 and 141W94 in combination and analyzed the results by two mathematically robust techniques which used both Loewe Additivity and Bliss Independence null reference models of additivity.
MATERIALS AND METHODS
Agents.
Both 1592U89 and 141W94 were kindly provided by GlaxoWellcome, Inc., Research Triangle Park, N.C.
Cells and viruses.
Cell lines (MT-2, H9) and HIV type 1 (HIV-1) strain IIIB (HIV-1IIIB) were obtained from the AIDS Research and Reference Reagent Program, AIDS Program, National Institute of Allergy and Infectious Diseases, Bethesda, Md. Aliquots of cell-free tissue culture medium from persistently HIV-1IIIB-infected H9 cells containing approximately 10,000 infectious units per ml were used for de novo infection experiments as described previously by Drusano et al. (3).
HIV antigen assay.
The HIV p24 protein levels in cell-free culture supernatants were measured by the Coulter p24 enzyme-linked immunosorbent assay according to the manufacturer’s guidelines (Coulter Immunology, Hialeah, Fla.). The absorbance was measured and the data were analyzed with a computer-supported microplate reader (Molecular Devices, Menlo Park, Calif.). The levels of the p24 protein were calculated with RLMP software (Dataworks Development Inc., Mountlake Terrace, Wash.).
Drug interaction modeling.
The definitions of synergy and antagonism are related to the observed effect differing from the defined additive effect in a statistically significant manner. If the observed effect is significantly greater than that predicted from the definition of additivity, synergy is said to be present. If the effect observed is significantly less than that predicted from the definition of an additive interaction, then antagonism is said to be present.
There are currently two competing definitions of additivity, the so-called Loewe Additivity and Bliss Independence null reference models. Each has its adherents and detractors. We will take no position on the best way of analyzing interaction data. Rather, the data were analyzed by using both definitions of additivity.
For Bliss Independence, the MacSynergy II program of Prichard et al. (6) was used. In this analysis, the standard deviations of the observed effect is used to determine statistical difference from the Bliss Independence null reference model. The total interaction surface is displayed, and the Bliss Independence additive surface is mathematically subtracted out, to display the “synergy” surface.
For Loewe Additivity, we have used the interaction model of Greco et al. (4). This model is fully parametric, and point estimates of the model parameters are obtained in a traditional weighted, nonlinear least-squares approach. The model is detailed below:
 |
 |
where α is the synergism-antagonism interaction parameter and the other parameters are as defined earlier. It should be clear by inspection that the dependent variable E cannot be isolated on the left side of the equation.
In this model, there is an underlying definition of Loewe Additivity, in which a sigmoid Emax effect model is used for each drug alone (the first two terms). The sum of the first two terms defines the additive effect. The third term is the drug interaction term. α is the interaction parameter. If the estimate of this parameter is zero, the combination is additive. If it is positive, the interaction is synergistic. If it is negative, the interaction is antagonistic. The estimate of α has an associated 95% confidence interval. If the confidence interval does not overlap zero, this provides the statistical significance for the estimate of the interaction. That is, if the 95% confidence interval crosses zero, the interaction is additive. If it does not and α is positive, the interaction is significantly synergistic. If it does not and α is negative, the interaction is significantly antagonistic.
This model was implemented in the ADAPT II package of programs of D’Argenio and Schumitzky (2). Replications of the experiment (n = 3) provided an estimate of the variance of the effect at different drug concentration combinations. The effect was weighted as the inverse of the observation (effect) variance.
RESULTS
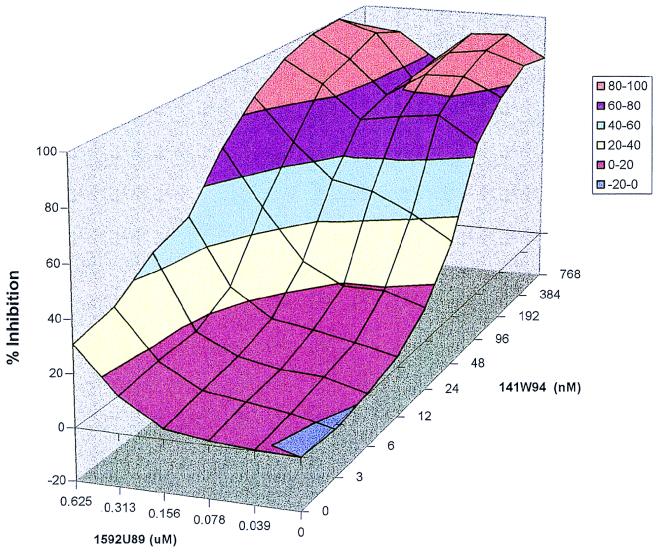
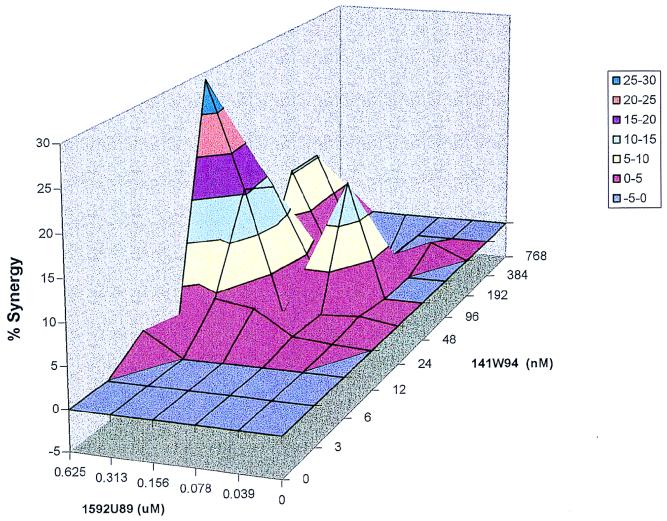
The Bliss Independence analysis demonstrated clear-cut synergistic interaction at both 95% and 99% probability evaluations. The full effect surface and the 95% confidence interval synergy surface for the determination performed without α1 acid glycoprotein and human serum albumin are displayed in Fig. 1 and 2.
FIG. 1.
1592U89 and 141W94 combination study with no plasma protein addition. A three-dimensional response surface of 1592U89 and 141W94 combination matrix is shown. Percent inhibition data are from an 3-(4,5-dimethylthiazol-2-yl)-2,5-diphenyltetrazolium bromide assay with HIV-1IIIB and MT-2 cells. No human serum proteins were added to the media.
FIG. 2.
Synergy plot of 1592U89 and 141W94 with no plasma addition. MacSynergy II analysis of the data from Fig. 1 is shown. The synergy plot is at the 95% confidence level.
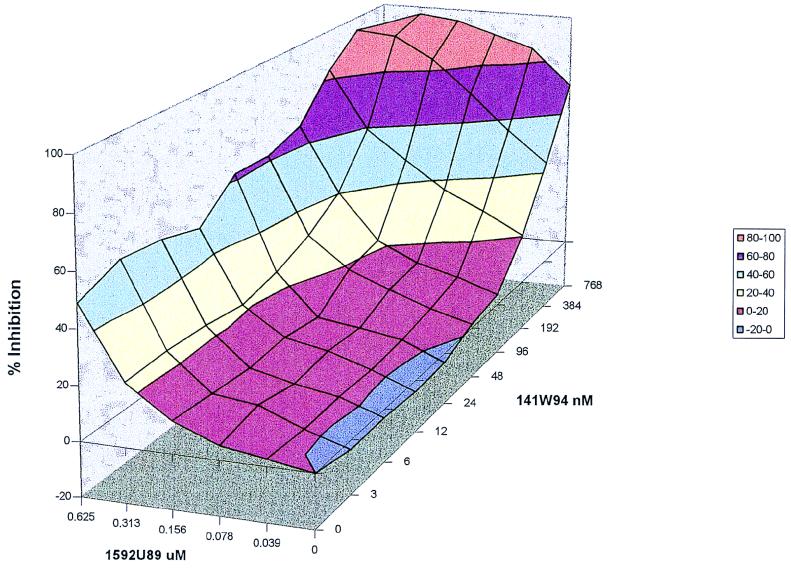
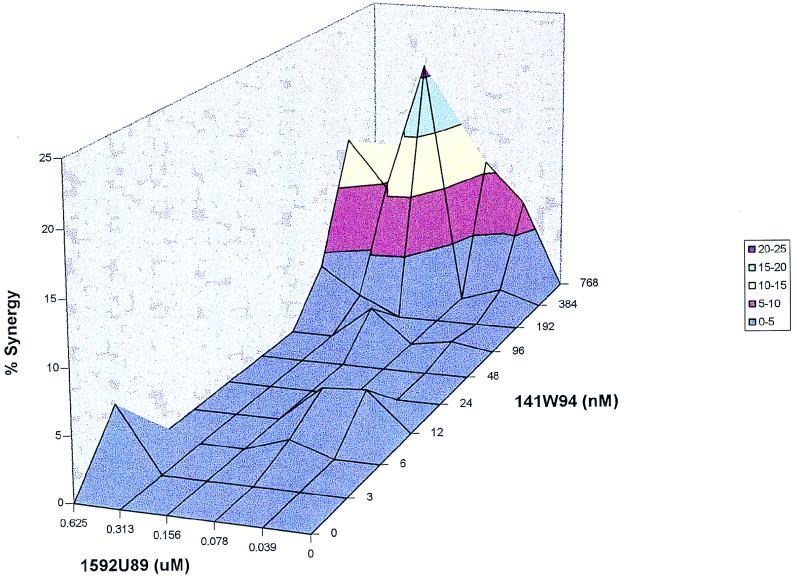
This was repeated in the presence of both α1 acid glycoprotein and human serum albumin. The full effect surface and the 95% confidence interval synergy surface are displayed in Fig. 3 and 4.
FIG. 3.
1592U89 and 141W94 combination study with albumin and α1 acid glycoprotein. A three-dimensional response surface of 1592U89 and 141W94 combination matrix is shown. Percent inhibition data from an 3-(4,5-dimethylthiazol-2-yl)-2,5-diphenyltetrazolium bromide assay with HIV-1IIIB and MT-2 cells. Human serum proteins α1 acid glycoprotein (1 mg/ml) and albumin (40 mg/ml) were added to the media.
FIG. 4.
Synergy plot of 1592U89 and 141W94 with 4% albumin and α1 acid glycoprotein at 1 mg/ml. MacSynergy II analysis of the data from Fig. 3 is shown. Synergy plot is at the 95% confidence level.
The fully parametric analysis with the model of Greco et al. (4) and the Loewe Additivity null reference model also shows clear-cut synergy. This analysis was performed by weighting each observation by the inverse of the observation variance. These parameters and their 95% confidence bounds are displayed in Table 1. The IC50 of 1592U89 was 0.626 μM, while that of 141W94 was 0.394 μM. The interaction parameter α was 1.144, and the 95% confidence bound (0.534 to 1.754) did not overlap zero, indicating that the overall drug interaction was significantly synergistic, as was also seen for the Bliss Independence analysis.
TABLE 1.
Parameter estimates and 95% confidence intervals for the assessment of interaction between 1592U89 and 141W94 by a fully parameteric analysisa
| Value | Econ (%) | IC50,141W94 (μM) | m141W94 | IC50,1592U89 μM | m1592U89 | α |
|---|---|---|---|---|---|---|
| Estimate | 100 | 0.3935 | 2.203 | 0.6255 | 1.595 | 1.144 |
| 95% confidence interval | 99.98–100 | 0.3648–0.4221 | 2.050–2.355 | 0.595–0.656 | 1.514–1.675 | 0.534–1.754 |
Parameter definitions are as indicated in the text.
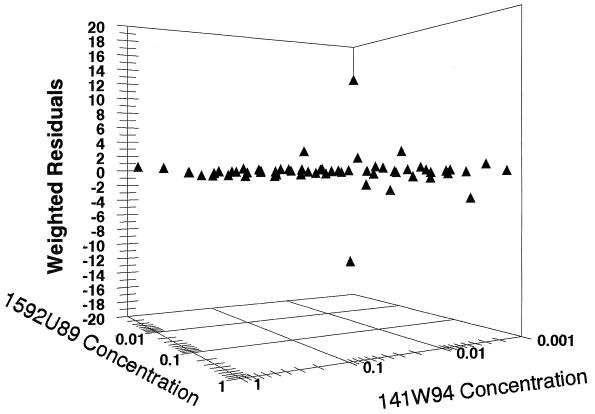
In order to evaluate whether there was a systematic misprediction of the antiviral effect by the fully parametric model, the weighted difference of the model prediction from the observed data was plotted and is presented in Fig. 5. The residuals are scattered about the zero line without bias, and the errors are quite trivial.
FIG. 5.
Weighted residuals in 1592U89-141W94 synergy plot. In order to evaluate whether there was a systematic misprediction of the antiviral effect by the fully parametric model, the weighted difference of the model prediction from the observed data is presented. The residuals are scattered about the zero line without bias, and the errors are quite trivial.
DISCUSSION
Combination chemotherapy may be important for a number of reasons. Combination chemotherapy may allow an effect greater than that attainable from any single-agent regimen. In the HIV arena, such an example would refer to a decrease in HIV RNA load, as determined by PCR, both in plasma and lymphoid tissue. Combinations may also be toxicity sparing. The same effect (decrease in HIV RNA load) may occur at smaller doses of each of the two drugs in the combination than would be necessary to achieve that effect with either of the drugs as single agents. Finally, it is possible that combination chemotherapy can suppress the emergence of resistance of the viral strain to either or both of the drugs in the combination.
Use of drugs in combination may be advantageous, but the design of optimal regimens to attain one or more of the advantages of combination therapy is a difficult problem. Part of the difficulty in selecting a regimen involves the combinatorial nature of the problem. For instance, a modest three dose-by-three dose evaluation requires nine different combination regimens. If each of the single-agent regimens is to be evaluated as a concurrent control, this adds another six regimens. Evaluation of each regimen for efficacy and toxicity with a modest 20 patients per regimen would then require between 180 and 300 patients, which is time-consuming and staggeringly expensive because of the intensity of the resources required for phase I/II studies.
One of the necessary conditions for harnessing many of the advantages of combination chemotherapy is that the drugs in the combination should interact in a positive way. That is, drugs should interact at least additively and, it is hoped, in a synergistic fashion. The determination of drug interaction has generated a large literature (see Greco et al. [4] for a review). One of the critical issues surrounding this determination is the need for some statistical measure of how the actual interaction differs from the definition of additivity.
This problem has been addressed in two very different ways with approaches that use a Bliss Independence definition of additivity (MacSynergy II program of Prichard et al. [6]) and by Greco et al. (4) (the latter approach was used in this evaluation). By the former approach, the replication of experimental data (e.g., data are developed in triplicate, quadruplicate, etc.) allows a robust determination of statistical difference from the Bliss Independence null reference model. The point estimate of the effect has a confidence bound constructed about it. This can be done at any desired level (95% confidence, 99% confidence, etc.). If the confidence bound does not overlap the theoretical additive surface, then the effect is statistically different from additive, either more than expected (synergistic) or less than expected (antagonistic).
The approach of Greco et al. (4) takes a fully parametric modeling approach, in which an explicit equation (see above) has an interaction term with an interaction parameter (α). If this parameter is exactly zero, then the equation defaults to the equation of Loewe Additivity and the interaction is additive. If the α is positive, one is obtaining a greater than expected effect (synergy). If it is negative, a less than expected effect is obtained and the interaction is antagonistic. The interaction parameter can then have a 95% confidence interval generated about it. If this interval does not overlap zero, then the difference in drug interaction from the Loewe Additivity null reference model is statistically significant.
Both approaches have their advantages. The fully parametric approach, however, does not rely specifically upon data replication for the determination of the significance of the difference from additivity. Data replication can be incorporated into the fully parametric approach as a weighting scheme which allows an approximation of the homoscedastic assumption by using an inverse observation variance weighting scheme. However, the regression approach can be used in the clinical circumstance, in which data replication is not possible, while the MacSynergy II approach cannot be used in this circumstance.
The drugs evaluated in this study constitute two potentially important additions to the physician’s armamentarium for the therapy of HIV disease. 1592U89 is a carbocyclic nucleoside analog reverse transcriptase inhibitor which has been evaluated in phase I/II clinical trials. The outcome of this study demonstrated that, in addition to being well tolerated, changes in plasma HIV RNA levels as determined by PCR averaged 1.5 to 2.0 logs (7). This viral load change is greater than that traditionally seen for nucleoside analogs. The reason for the improved maximal effect seen with this agent relative to that seen with older agents has yet to be fully elucidated. Nonetheless, the effect seen, on average, is of the same order as that seen with protease inhibitor therapy. 141W94 (previously VX478) is a promising new HIV protease inhibitor. A phase I/II study for this agent again showed average viral load changes of approximately 2.0 logs with the highest reported dose evaluated (8). Again, the drug was well tolerated during the period of evaluation. In both instances, the drugs were administered on schedules (every 12 h) which would be expected to maximize compliance. Therefore, the use of a combination of two potent drugs of different classes which produce large viral load drops and which are administered on schedules with which patients could comply would be of great interest.
The inclusion of protein binding effects in the evaluation was important because our group has shown that this is potentially clinically important for protease inhibitors (1). Furthermore, we wished to demonstrate that the determination of the type of interaction (additivity, synergy, antagonism) was independent of the definition of the null reference model. Finally, we wished to use a fully parametric approach so that the plasma pharmacokinetic profile could be easily evaluated with regard to the expected effect.
By examining Fig. 1 and 3, it is obvious that the addition of physiologic amounts of α1 acid glycoprotein and human serum albumin had important effects on the 50% effective concentration (EC50) and EC95 of 141W94 but not those of 1592U89. However, it should also be noted that one can achieve EC95 effect levels in the presence of binding proteins which are achievable as trough concentrations and which are tolerable, as demonstrated in the study presented by Schooley et al. (9). Consequently, it is important to take the effect of protein binding into account. Once having done so, it is highly likely that this effect will not play an important clinical role for 141W94, if dose choice takes this into account a priori.
Both evaluations of drug interaction demonstrated clear-cut, statistically significant synergy. Examination of the data in Table 1 shows that the identified EC50s of the two drugs are well within the clinically achievable ranges for both drugs. The interaction parameter (α) is different from zero because the 95% confidence interval has a lower bound of 0.54. The use of a fully parametric approach has many advantages, as will be discussed below. However, as one is fitting a model to data, it is incumbent upon the modeler to show that there is no systematic misprediction by the model. The weighted (inverse of the observation variance) residual plot is shown in Fig. 5. It is clear from Fig. 5 that all but two of the observations had small weighted residuals, and these were relatively small and of opposite signs. This indicates that there was no systematic bias in the model fit.
The synergy surfaces seen in Fig. 2 and 4 demonstrate that the addition of protein changes the location of maximal synergy. In the more physiologic situation in which the evaluation takes place in the presence of plasma binding proteins, the area of maximal synergy occurs in the area of trough concentrations of 141W94. Even more importantly, the synergy occurs across the identified concentration range of 1592U89, so that even small residual concentrations of 1592U89 produce significantly more antiviral effect than would be anticipated. This may be very important clinically for the suppression of the emergence of resistance. Data by Molla and colleagues (5) demonstrated that rates of base pair substitution associated with resistance to the HIV protease inhibitor ritonavir were related to the trough concentrations of the drug. Consequently, the extra antiviral effect seen with synergy between 141W94 and 1592U89, particularly at low concentrations of the former and across the concentration range of the latter, will have the effect of functionally raising the protease inhibitor trough levels (not in a pharmacokinetic sense but in a pharmacodynamic or effect sense). One would hope that this would prevent or delay the emergence of resistance. Such a hypothesis can be validated only by a clinical trial. Nonetheless, the finding of a synergistic interaction at such a critical point bodes well for this combination and should provide added impetus for its rapid evaluation.
The use of the fully parametric approach has other important advantages. Because the effect is a function of the concentrations of the two drugs and all other terms in equation 1 are parameters estimated in the model-fitting process, one can easily form a number of concentration-time triplets over a steady-state dosing interval for the drugs in combination (assuming no pharmacokinetic interaction). These concentrations can then be evaluated for effect once the parameters of equation 2 have been estimated. One can then perform a Monte Carlo simulation for the two drugs in question, so that a whole population of simulated patients can receive the drugs in combination and time-effect curves can be constructed for each patient. The steady-state-interval average effect can then be easily calculated for each patient by taking the area under the concentration-time curve for the effect curve and dividing by the duration of the steady-state interval. If one does this for a Monte Carlo simulation population, one can then statistically test differences between doses and schedules of combinations in a straightforward manner. This would be of great interest in limiting the numbers of regimens to be evaluated for combinations being evaluated in phase I/II trials.
In summary, 1592U89 and 141W94 are drugs of great interest in their own right. However, their use in combination is potentially exciting because very large viral load drops may be achievable. In addition, two different evaluations of drug interaction with two different definitions of additivity show unequivocal evidence of statistically significant synergy. This raises the probability that appropriate doses of these two agents in combination can give the very large viral load drops which would be desirable. Finally, the synergy maximizes in an important area of anticipated trough concentrations of 141W94 and is seen across a broad concentration range of 1592U89. This might well be important for the prevention or delay of emergence of HIV resistance to the protease inhibitor. These drugs should have a high priority for evaluation in clinical trials, with careful tracking of HIV RNA loads in plasma by PCR. Study of the effect of drug concentrations in combination on the time to the emergence of resistance in such trials would also be of great importance.
ACKNOWLEDGMENTS
This investigation was supported by grant 1NO1 AI 15104 015 from the Adult AIDS Cooperative Treatment Group Advanced Technologies Laboratories Program, Pharmacology Research Resource Unit.
REFERENCES
- 1.Bilello J A, Bilello P A, Stellrecht K, Leonard J, Norrbeck D, Kempf D J, Robins T, Drusano G L. Human serum α1-acid glycoprotein reduces uptake, intracellular concentration, and antiviral activity of A-80987, an inhibitor of the human immunodeficiency virus type 1 protease. Antimicrob Agents Chemother. 1996;40:1491–1497. doi: 10.1128/aac.40.6.1491. [DOI] [PMC free article] [PubMed] [Google Scholar]
- 2.D’Argenio D Z, Schumitzky A. User’s manual. University of Southern California: Biomedical Simulations Resource; 1990. ADAPT II: a program package for simulation identification and optimal experimental design. , Los Angeles. [Google Scholar]
- 3.Drusano G L, Prichard M, Bilello P A, Bilello J A. Modeling combinations of antiretroviral agents in vitro with integration of pharmacokinetics: guidance in regimen choice for clinical trial evaluation. Antimicrob Agents Chemother. 1996;40:1143–1147. doi: 10.1128/aac.40.5.1143. [DOI] [PMC free article] [PubMed] [Google Scholar]
- 4.Greco W R, Bravo G, Parsons J C. The search for synergy: a critical review from a response surface perspective. Pharmacol Rev. 1995;47:331–385. [PubMed] [Google Scholar]
- 5.Molla A, Korneyeva M, Gao Q, Vasavasonda S, Schipper P J, Mo H M, Marowitz M, Chernyavskiy T, Niu P, Lyons N, Hsu A, Granneman G R, Ho D D, Boucher C A, Leonard J M, Norbeck D W, Kempf D J. Ordered accumulation of mutations in HIV protease confers resistance to ritonavir. Nat Med. 1996;2:270–276. doi: 10.1038/nm0796-760. [DOI] [PubMed] [Google Scholar]
- 6.Prichard M N, Prichard L E, Shipman C., Jr Strategic design and three-dimensional analysis of antiviral drug combinations. Antimicrob Agents Chemother. 1993;37:540–545. doi: 10.1128/aac.37.3.540. [DOI] [PMC free article] [PubMed] [Google Scholar]
- 7.Saag M, Lancaster D, Sonnerborg A, Mulder J, Torres R, Schooley R, Harrigan R, Kelleher D, Symonds W. Abstracts of the 3rd Conference on Retroviruses and Opportunistic Infections. 1996. A phase I/II study of a novel nucleoside reverse transcriptase inhibitor, 1592U89 monotherapy versus 1592U89 plus zidovudine or placebo in HIV infected patients with CD4 counts 200-500/mm3, abstr. 195. [Google Scholar]
- 8.Schooley R T the 141W94 International Study Group. Program and abstracts of the 36th Interscience Conference on Antimicrobial Agents and Chemotherapy. Washington, D.C: American Society for Microbiology; 1996. Preliminary data on the safety and antiviral efficacy of the novel protease inhibitor 141W94 in HIV-infected patients with 150-400 CD4+ cells/mm3, abstr. LB7a. [Google Scholar]
- 9.Schooley R T the 141W94 International Study Group. Abstracts of the 4th Conference on Retroviruses and Opportunistic Infections. 1997. Preliminary data from a phase I/II study on the safety and antiviral efficacy of the combination of 141W94 plus 1592U89 in HIV-infected patients with 150-400 CD4 + cells/mm3. [Google Scholar]


