

Abstract
Objective:
Cognitive fluctuations are a core clinical feature of dementia with Lewy bodies (DLB), but their contribution to the everyday functioning difficulties evident DLB are not well understood. The current study evaluated whether intraindividual variability across a battery of neurocognitive tests (intraindividual variability-dispersion) and daily cognitive fluctuations as measured by informant report are associated with worse daily functioning in DLB.
Method:
The study sample included 97 participants with consensus-defined DLB from the National Alzheimer’s Coordinating Center (NACC). Intraindividual variability-dispersion was measured using the coefficient of variation, which divides the standard deviation of an individual’s performance scores across 12 normed neurocognitive indices from the NACC neuropsychological battery by that individual’s performance mean. Informants reported on daily cognitive fluctuations using the Mayo Fluctuations Scale (MFS) and on daily functioning using the Functional Activities Questionnaire (FAQ).
Results:
Logistic regression identified a large univariate association of intraindividual variability-dispersion and presence of daily cognitive fluctuations on the MFS (Odds Ratio = 73.27, 95% Confidence Interval = 1.38, 3,895.05). Multiple linear regression demonstrated that higher intraindividual variability-dispersion and presence of daily cognitive fluctuations as assessed by the MFS were significantly and independently related to worse daily functioning (FAQ scores).
Conclusions:
Among those with DLB, informant-rated daily cognitive fluctuations and cognitive fluctuations measured in the clinic (as indexed by intraindividual variability-dispersion across a battery of tests) were independently associated with poorer everyday functioning. These data demonstrate ecological validity in measures of cognitive fluctuations in DLB.
Keywords: Activities of Daily Living, Fluctuations, Dispersion, Dementia, Lewy Bodies
Introduction
Cognitive fluctuations are a transdiagnostic phenomenon (Walker et al., 2000a) that are useful for differentiating dementia with Lewy bodies (DLB) from similarly presenting dementias (Ferman et al., 2004; Galvin et al., 2021; McKeith et al., 2017). Cognitive fluctuations in DLB are characterized by impairment in attention and spontaneous alterations in arousal (Ballard, Walker, O’Brien, Rowan, & McKeith, 2001). They best differentiate DLB from non-DLB dementias when identified earlier in the disease process (Hansen et al., 1990), making them an important prodromal phenotype (Belden, Kahlon, Malek-Ahmadi, Tsai, & Sabbagh, 2015; Hamilton et al., 2021). Although clinically recognizable as prolonged waxing/waning episodes of delirium-like disorientation (McKeith et al., 2017), cognitive fluctuations in DLB can be subtle and occur on a second-to-second basis (Walker et al., 2000a). As such, DLB cognitive fluctuations are difficult to assess, contributing to diagnostic inaccuracy that occurs in up to 20% of DLB cases (Chin, Teodorczuk, & Watson, 2019; Rizzo et al., 2018).
Qualitative features derived via clinical interview are recommended to identify DLB cognitive fluctuations (Bradshaw, Saling, Hopwood, Anderson, & Brodtmann, 2004), but such expert-derived ratings are subject to substandard reliability (Litvan et al., 1998; Mega et al., 1996). Standardized instruments have been published, but in many cases (Ferman et al., 2004; Walker et al., 2000b) rely on subjective reports from a non-clinician observer (e.g., caregiver, family member). Such sources of information may not always be available, and may lack sufficient evidence of reliability and validity to be widely applied in practice (Lee, Taylor, & Thomas, 2012). The Mayo Fluctuations Scale (MFS) (Ferman et al., 2004) may be the most widely-cited (Lee, McKeith, Mosimann, Ghosh-Nodyal, & Thomas, 2013) standardized report-based measure of cognitive fluctuations. A shortened 4-item version of the MFS asks informants to report on cognitive fluctuations in daily life and can reliably differentiate DLB from other similarly presenting causes of dementia (Ferman et al., 2004; Galvin et al., 2021).
In addition to report-based measures of daily cognitive fluctuations, cognitive fluctuations can be measured in the laboratory or clinic by calculating indices of intraindividual variability from the results of performance-based tests (Bunce, Warr, & Cochrane, 1993). Intraindividual variability can be generated across trials or sessions on the same test (intraindividual variability-inconsistency) or across different indicators for a battery of neurocognitive tests measured at one time point (intraindividual variability-dispersion)(Costa, Dogan, Schulz, & Reetz, 2019). Indeed, some variability in neurocognitive test performances within a comprehensive battery is normal (Kiselica, Webber, & Benge, 2020b) and increases with age (LaPlume, Anderson, McKetton, Levine, & Troyer, 2022). However, higher intraindividual variability reflects attention/executive dysfunction-mediated cognitive performance fluctuations in the laboratory or clinic that are conceptually similar to the waxing/waning of attention that is characteristic of daily DLB cognitive fluctuations (McKeith et al., 2017; Stuss, Murphy, Binns, & Alexander, 2003). Despite obvious relevance to DLB, little is known about intraindividual variability-indexed cognitive fluctuations in DLB.
In one of the few studies to examine intraindividual variability-inconsistency in DLB, Walker et al. (2000a) showed that participants with DLB exhibited greater intraindividual variability-inconsistency than either participants with Alzheimer’s disease (AD) or vascular dementia (VaD). Furthermore, the authors reported correlations of large effect size magnitude between intraindividual variability-inconsistency and “semi-quantified” clinical interview severity ratings of fluctuating cognition for the DLB group (rs = .49 to .61). In contrast, associations were of relatively more modest effect size magnitude within the VaD (rs = .11 to .33) and AD groups (rs = .09 to .18). Other studies have also shown that intraindividual variability-inconsistency is elevated in DLB compared to individuals with healthy cognition (Ballard, O’Brien, et al., 2001) and Parkinson’s disease (Bliwise, Scullin, & Trotti, 2014). Further, intraindividual variability-inconsistency and has been shown to predict clinical severity ratings of cognitive fluctuations in a mixed sample that included patients with DLB, AD, and healthy cognition (Ballard, Walker, et al., 2001).
Only one study known to these authors has examined intraindividual variability-dispersion in DLB. In this study, intraindividual variability-dispersion derived from a battery of 12 neurocognitive tasks was consistently higher in both AD and DLB than in individuals with healthy cognition (Webber et al., 2022). Further, intraindividual variability-dispersion was associated with clinician-rated cognitive fluctuations at a large effect size magnitude (d = .79). Finally, intraindividual variability-dispersion was associated with informant-reported daily cognitive fluctuations as measured by the MFS at a large effect size magnitude (rs = .60 to .63), though this finding was based on a small subsample (n = 29) with either DLB (86%) or healthy cognition (14%), emphasizing the need for additional studies on the ecological validity of intraindividual variability-dispersion in DLB.
Indeed, DLB cognitive fluctuations increase risk for errors while managing activities of daily living by virtue of their impact on sustained attention (e.g., leaving on the oven after use or missing a turn/exit while driving). This is supported by previous research showing that clinical ratings of the cognitive fluctuations characteristic of DLB are associated with greater impairment of daily functioning at a large effect size magnitude (rs = .62 to .87) in mixed clinical sample (Ballard, Walker, et al., 2001). Similarly, given that higher intraindividual variability (both intraindividual variability-inconsistency or intraindividual variability-dispersion) reflects pathological executive dysregulation of attention/cognitive control (Costa et al., 2019), higher intraindividual variability-dispersion in DLB may confer risk for impairment in activities of daily living. The cognitive fluctuations measured by intraindividual variability-dispersion have been associated with a variety of real-world problems in other clinical groups (Fellows & Schmitter-Edgecombe, 2015; Morgan, Woods, & Grant, 2012), though no study has tested the association of intraindividual variability-dispersion and daily functioning in individuals with DLB.
To this end, the goals of this study were to 1) test the association of intraindividual variability-dispersion and informant-rated daily cognitive fluctuations in DLB, 2) examine the relationship between intraindividual variability-dispersion and daily functioning in DLB, and 3) test the incremental utility of clinician-rated cognitive fluctuations, informant-rated daily cognitive fluctuations, and intraindividual variability-dispersion for predicting daily functioning. Consistent with previous research (Webber, Kiselica, Mikula, & Woods, 2022), a positive relationship between intraindividual variability-dispersion and probability of informant-rated daily cognitive fluctuations was expected. Given evidence for substandard reliability of clinical interviews for detecting cognitive fluctuations in DLB (Litvan et al., 1998; Mega et al., 1996), we expected informant-ratings on the MFS to incrementally predict daily functioning over-and-above clinician-ratings of cognitive fluctuations. We also expected intraindividual variability-dispersion to exhibit incremental utility for predicting daily functioning, given that such standardized/objective metrics may be less sensitive to bias than either interview or report-based measures of cognitive fluctuations (Lee et al., 2012).
Methods
Sample
All available Uniform Data Set (UDS) and “Lewy Body Dementia module” (Galvin et al., 2021) data were requested via the National Alzheimer’s Coordinating Center (NACC) portal on 9/17/2022. Informed consent was obtained from all participants as part of their participation in the institutional review board-approved data collection process, and all human data included in this manuscript was obtained in compliance with institutional review board regulations and the Helsinki Declaration. Observations were provided from the outset of data collection through the June 2022 data freeze and included 167 participants from 6 Alzheimer’s Disease Research Centers across the United States of America who completed the MFS at their initial visit. Notably, we excluded participants with moderate to severe dementia using the Clinical Dementia Rating® (CDR) Dementia Staging Instrument Global Score (Fillenbaum, Peterson, & Morris, 1996; Morris, 1993) given evidence that significant cognitive impairments often preclude meaningful participation in neurocognitive testing and may contribute to floor-effects for the intraindividual variability-dispersion metrics (Kiselica & Benge, 2019; Kiselica, Johnson, & Benge, 2021; Salmon & Bondi, 2009). Additional exclusion criteria and the resulting final sample of 97 participants are depicted via STROBE (Strengthening the Reporting of OBservational studies in Epidemiology) diagram in Figure 1. Of note, 35 participants (36% of the current sample) were included in recent work on intraindividual variability-dispersion in DLB (Webber et al., 2022), though relationships between some variables in this study (i.e., intraindividual variability-dispersion and MFS) were previously reported for only 26 participants (27% of the current sample) due to differing inclusion/exclusion criteria and regular data entry updates.
Figure 1.
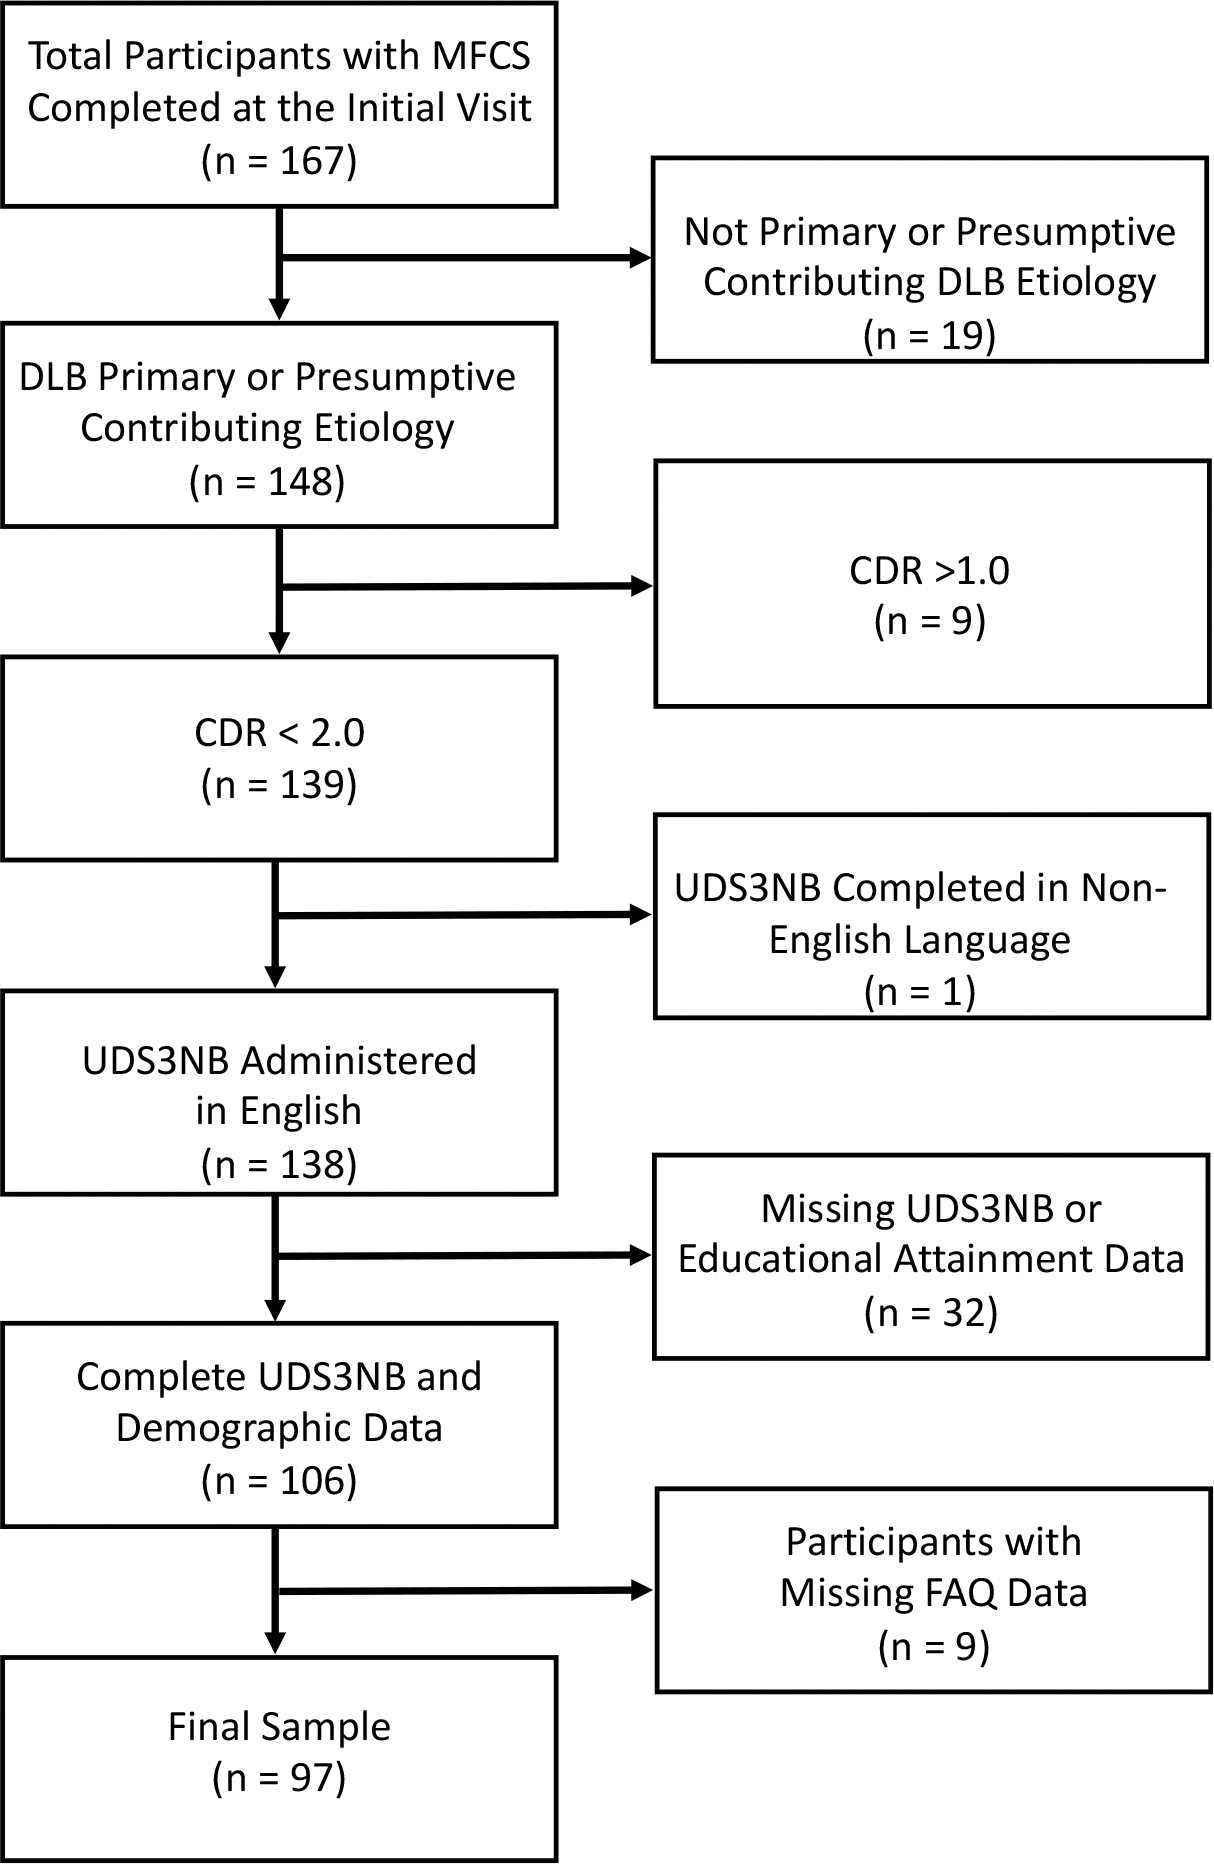
STROBE diagram detailing study exclusion criteria. Note: Participants with missing UDS3NB data were removed if identified as having missing data due to a physical problem, verbal refusal, or an unspecified “other” reason. STROBE = Strengthening the Reporting of OBservational studies in Epidemiology; MFS = Mayo Fluctuations Scale; DLB = Dementia with Lewy Bodies; CDR = Clinical Dementia Rating; UDS3NB = Uniform Dataset 3.0 Neuropsychological Battery; FAQ = Functional Activities Questionnaire.
Cognitive Impairment/DLB Diagnosis
In the UDS, cognitive impairment and etiological diagnoses were made either by the examining clinician or by a consensus team (Besser et al., 2018). Diagnoses were based on available interview, cognitive, behavioral, biomarker, imaging, and genetic data. Based on these data, diagnoses were made following a three-step process. First, the clinician(s) determined whether the subject had healthy cognition. Second, if cognition was determined to be impaired, a diagnosis of all cause dementia, mild cognitive impairment (MCI), or “impaired-not-MCI” was made based on NACC consensus clinical criteria. Finally, a presumptive etiologic diagnosis for dementia with Lewy bodies was decided upon using current consensus guidelines (McKeith et al., 2017). Based on UDS consensus criteria, 37 (38%) participants met criteria for dementia and were categorized as DLB. Per UDS consensus criteria, the remaining 60 (62%) participants were either diagnosed with MCI (n = 58; 60%) or “impaired-not-MCI” (n = 2; 2%). Per the NACC UDS Researchers Data Dictionary (Version 3.0), participants diagnosed as “impaired-not-MCI” were cognitively impaired but did not meet formal criteria for MCI. Given that the impaired-not-MCI” participants were identified as cognitively impaired and received a presumptive etiologic diagnosis per McKeith et al. (2017) criteria, these participants were retained in the study and combined with the MCI group to form a group that we refer to as MCI-LB (n = 60; 62%).1
Intraindividual Variability-Dispersion
Performances across measures in the Uniform Data Set 3.0 Neuropsychological Battery (UDS3NB) were used to calculate intraindividual variability-dispersion. These measures are described in detail elsewhere (Besser et al., 2018; Weintraub et al., 2018). Briefly, the UDS3NB includes 12 neurocognitive indicators from the following 6 categories: 1) the Craft Story (Craft et al., 1996), a measure of immediate (Craft Story Immediate) and delayed recall (Craft Story Delayed) of orally presented story information; 2) the Benson Figure, which includes a figure copy trial and a delayed figure recall trial (Possin, Laluz, Alcantar, Miller, & Kramer, 2011); 3) Number Span Forwards and Backwards, simple and reverse digit repetition tasks; 4) the Multilingual Naming Test (MINT), a confrontation naming test (Gollan, Weissberger, Runnqvist, Montoya, & Cera, 2012; Ivanova, Salmon, & Gollan, 2013); 5) letter (F- and L-words) and semantic fluency tasks (animals and vegetables treated as separate indicators in the available norms); and 6) Trail Making Test parts A (TMT A) and B (TMT B), which evaluate simple number sequencing and letter-number sequencing, respectively (Partington & Leiter, 1949).
The UDS3NB has a validated factors structure in cognitively intact older adults (Kiselica, Webber, & Benge, 2020a) and exhibits convergent and ecological validity in samples of individuals with neurological-compromise (e.g., Parkinson’s disease) (Lea et al., 2021). To maximize sample size and external validity for individuals that are too cognitively/behaviorally impaired to complete all measures within a comprehensive neuropsychological battery, missing UDS3NB data points due to cognitive/behavioral issues were recoded using established methods (Heaton, 2004). In particular, missing data points due to cognitive/behavioral issues were recoded as the minimum possible score for tests in which higher values reflect better functioning (e.g., 0 for digit span forward) or the maximum possible score for tests in which lower scores reflect better functioning (e.g., 300 seconds for Trail Making Test Part B).
The current study utilized the coefficient of variation (CoV) to index intraindividual variability-dispersion within the UDS3NB as a means of measuring dispersion while simultaneously controlling for global cognitive functioning (Tractenberg & Pietrzak, 2011). To this end, all raw scores on the 12 aforementioned UDS3NB indicators were transformed into demographically adjusted (i.e., age, sex, and education) z-scores using published UDS normative data (Weintraub et al., 2018). These norms were created using 3,602 predominantly Caucasian (83%) individuals that completed the UDS3NB on their first NACC UDS visit. All participants were clinically determined to be cognitively healthy by the NACC UDS study team and had a CDR score of 0. Regression-based norms (which were used in the current study) that allow for demographic correction for age, sex, and education were derived by the authors and provided in a user-friendly spreadsheet calculator.
To maximize the interpretability of the CoV, the normed z-scores were then transformed into T-scores using the following formula: (10*z-score) + 50. Extreme scores (T-score < 10) were observed on Trails A, Trails B, MINT, and Benson Copy, which were winsorized (Wilcox, 2005) using a floor of T-score = 9 to enhance interpretability and statistical conclusion validity. The resulting T-scores were then used to compute the mean T-score across the 12 UDS3NB indicators. Of note, we elected to use all 12 indicators within the UDS3NB battery rather than a subset of UDS3NB tests that may be more sensitive to DLB given that shorter batteries may produce inflated variability scores and previous research on intraindividual variability-dispersion has typically utilized more broad neurocognitive batteries to index intraindividual variability-dispersion (Costa et al., 2019; Stuss et al., 2003). The intraindividual standard deviation was calculated by computing the square root of the average squared deviation of each T-score from the individual’s UDS3NB T-score mean. The intraindividual standard deviation was then divided by the UDS3NB T-score mean to compute the CoV, which exhibited a distribution approaching normality (skewness = .078, kurtosis −.834). For the purpose of this manuscript, CoV will be used to reference intraindividual variability-dispersion in the methods and results sections, with higher CoV values reflecting greater intraindividual variability-dispersion.
Clinician-rated Cognitive Fluctuations
Clinicians determined the presence/absence of current cognitive fluctuations, as defined by the following question: “Does the subject exhibit pronounced variation in attention and alertness, noticeably over hours or days - for example, long lapses or periods of staring into space, or times when his/her ideas have a disorganized flow.”
Informant-reported Daily Cognitive Fluctuations
Partners of study participants completed the 4-item MFS as part of the UDS “Lewy body dementia” module (Galvin et al., 2021), which assessed the presence/absence of the following symptoms within the past month: frequent drowsiness/lethargy during the day despite sleeping well the night before, sleeping > 2 hours before 7:00 p.m., disorganized/unclear/illogical flow of ideas, and long periods of staring into space. Informants responded “yes/present,” “no/absent,” or “unknown” to these four items. Only one participant had an “unknown” response, which was recorded on the item assessing sleeping > 2 hours before 7:00p.m. This response was recoded to “no/absent” to maximize sample size. The MFS items were summed to provide a continuous index of cognitive fluctuations and converted into a dichotomous (present/absent) indicator of cognitive fluctuations using the previously published cut-score of greater than or equal to three symptoms present (Ferman et al., 2004).
Daily Functioning
The functional activities questionnaire (FAQ) is a 10-item, informant-report questionnaire assessing instrumental and advanced activities of daily living across several domains, including management of finances, completing household tasks (e.g., shopping, cleaning, cooking), engagement in hobbies, tracking current events, traveling, and remembering appointments or medications (Pfeffer, Kurosaki, Harrah, Chance, & Filos, 1982). Items are rated on a 4-point ordinal scale (0 to 3) and summed to create a total score (ranging from 0 to 30), with higher FAQ item and total scores suggesting greater impairment in activities of daily living. Prior literature supports the reliability and validity of the FAQ as a measure of daily functioning in the UDS sample and in non-UDS, demographically diverse samples (González, Clark, Gonzales, & Benge, 2022; González, Gonzales, Resch, Sullivan, & Soble, 2022; Tappen, Rosselli, & Engstrom, 2010). Further, the FAQ demonstrates strong classification accuracy when differentiating normal cognition, mild cognitive impairment, and dementia (González, Gonzales, et al., 2022; Teng et al., 2010; Yin et al., 2020).
Given that some participants had a partially completed FAQ (i.e., some items were marked as either “not applicable”/never did or “unknown” but others were completed using the Likert-type scale above), previously established methods (Farias et al., 2020, 2008) were used on the available data to create a ratio index that divided the sum of the total score from available items by the number of available items. As such, the FAQ ratio variable ranged from 0 (normal function across all available items) to 3 (dependence across all available items), with values exhibiting a largely normal distribution (skewness = .947, .075). Using this operationalization, a higher FAQ ratio score is suggestive of greater impairment in daily functioning while a lower FAQ ratio score is suggestive of less impairment in daily functioning. Internal consistency reliability for the FAQ in the current sample was excellent (Cronbach’s α = .93).
Potential Non-Demographic Covariates
The current study examined current depressive symptoms and overall physical health as potential non-demographic covariates. To index current depressive symptoms, the 15-item Geriatric Depression Scale-Short Form (GDS-SF)(Sheikh & Yesavage, 1986) was utilized in a subset of participants with available GDS-SF data (n = 91). The total GDS-SF score was calculated by summing the 15 dichotomously answered items after reverse coding relevant items. Per UDS protocol, total scores were calculated for any participant with ≤ 3 missing items on the GDS-SF. Using this approach, internal consistency reliability of the GDS-SF in this subsample was acceptable (Cronbach’s α = .79).
A modified Charlson Comorbidity Index (Modified CCI)(Charlson et al., 2008), which purports to measure overall physical health by sampling health conditions impacting a wide array of bodily systems (e.g., vascular, pulmonary, autoimmune), was also considered as a potential covariate. To this end, the following 12 self-reported and clinician-assessed health conditions (recent/active or remote/inactive) were used: arthritis (rheumatoid or osteo), human immunodeficiency virus, congestive heart failure, heart attack/myocardial infarction, atrial fibrillation, other cardiovascular condition (e.g., aortic aneurysm), diabetes (type I or type II), sleep apnea, cancer, hypertension, hypercholesterolemia, and thyroid disease. These conditions were considered present (and scored as “1”) if either self-reported or identified by the clinical assessment (when both were available). In contrast, these conditions were considered absent (and scored as “0”) if neither self-reported nor identified by the clinical assessment (when both were available).2 The resulting variables summed to create a modified CCI, with possible values ranging from 0 to 12.
Data Analytic Strategy
Binary logistic regression was used to test the association of the continuous CoV variable with the binary indicator of informant-rated daily cognitive fluctuations. To test the incremental utility of the cognitive fluctuations indicators for predicting informant-rated daily functioning, the predictors were entered into blocks of a multiple linear regression with the FAQ ratio score as the dependent variable. In these multiple linear regression models, clinician-rated cognitive fluctuations and informant-rated daily cognitive fluctuations were treated as binary independent variables, while the CoV was treated as a continuous independent variable. A clinical interpretive process was simulated by first entering clinician-rated cognitive fluctuations and next entering the CoV. Given that not all individuals with DLB present with informants to neurocognitive evaluations, the dichotomous indicator of informant-rated daily cognitive fluctuations was entered last to identify whether such additional information has incremental utility beyond clinician-rated cognitive fluctuations and the CoV. Consistent with recommended practices (Field-Fote, 2019), covariates (i.e., age, sex, educational attainment, dementia status, GDS-SF, Modified CCI) were identified if they were significantly related to both the dependent variable and any of the independent variables measuring cognitive fluctuations. All identified covariates were included in a separate, final block of the aforementioned multiple linear regression model. Collinearity was assessed in the multiple linear regression models using variance inflation factor (VIF), with VIF > 4 indicative of multicollinearity (O’brien, 2007).
Results
See Table 1 for the demographic characteristics of the sample. Participants were predominantly male, relatively highly educated (on average >16 years education), and almost entirely White/Non-Hispanic.3 As shown, presence of dementia (versus MCI-LB) was significantly associated with a higher frequency of informant-rated daily cognitive fluctuations and clinician-rated cognitive fluctuations. Additionally, participants with dementia had higher FAQ ratio scores (greater impairment) and higher CoV (greater intraindividual variability-dispersion) than those in the MCI-LB group. Given these findings, dementia status was identified as a statistical covariate of the primary dependent and independent variables.
Table 1.
Sample Characteristics for Demographics, Current Mood, Medical Comorbidities, Daily Functioning, and Cognitive Fluctuations, subdivided by dementia status.
| MCI-LB | DLB | ||||
|---|---|---|---|---|---|
| (n = 60) | (n = 37) | ||||
|
| |||||
| Variable | M (SD) | Min. - Max. | M (SD) | Min. - Max. | t (Cohen’s d) |
|
| |||||
| Age | 68.88 (9.48) | 36.00 – 90.00 | 69.95 (7.30) | 57.00 – 85.00 | −.58 (−.12) |
| Education | 17.20 (2.48) | 12.00 – 20.00 | 16.41 (2.77) | 12.00 – 20.00 | 1.47 (.31) |
| GDS-SF Total | 3.77 (2.90) | 0.00 – 15.00 | 4.29 (3.29) | 0.00 – 14.00 | −.79 (−.17) |
| Modified CCI | 2.92 (1.62) | 0.00 – 7.00 | 2.73 (1.84) | 0.00 – 9.00 | .53 (.11) |
| Coefficient of Variation (CoV) | 0.29 (0.11) | 0.14 – 0.52 | 0.40 (0.10) | 0.21 – 0.60 | −5.33 (−1.11)*** |
| FAQ Ratio Score | 0.52 (0.54) | 0.00 – 2.89 | 1.40 (0.80) | 0.00 – 3.00 | −6.45 (−1.35)*** |
|
| |||||
| Variable | n (%) | Min. - Max. | n (%) | Min. - Max. | X2 (Cramer’s V) |
|
| |||||
| Sex (#/% Female) | 9 (15%) | ––– | 9 (24%) | ––– | 1.32 (.12) |
| Race/Ethnicity (#/% White/Non-Hispanic) 1 |
57 (95%) | ––– | 37 (100%) | ––– | 1.91 (.14) |
| Clinician-Rated Cognitive Fluctuations (#/% Present) |
18 (30%) | ––– | 21 (57%) | ––– | 6.82 (.27)** |
| Informant-Rated Daily Cognitive Fluctuations (#/% Present)2 |
12 (20%) | ––– | 16 (43%) | ––– | 6.02 (.25)* |
Note: Race/ethnicity is operationalized as either White/Non-Hispanic or “Other.”
Defined as Mayo Fluctuations Scale ≥ 3. MCI-LB = Mild cognitive impairment or “impaired-not-MCI” due to dementia with Lewy bodies; DLB = Dementia due to dementia with Lewy bodies; Modified CCI = Modified Charlson Comorbidity Index; M = Mean; SD = Standard Deviation; Min. = Minimum observed value; Max = Maximum observed value; GDS-SF = Geriatric Depression Inventory-Short Form; FAQ = Functional Activities Questionnaire ratio score; MFS = Mayo Fluctuations Scale;
p <.05
p <.01
p <.001.
Table 2 presents descriptive statistics for the UDS3NB indicators and indicators of global cognition, subdivided by dementia status (MCI-LB versus DLB). Included in the note of this table are data on the number of observations for each UDS3NB indicator that were missing/imputed due to cognitive/behavioral issues.
Table 2.
Descriptive statistics for UDS3NB indicators and indicators of global cognition, subdivided by dementia status.
| MCI-LB | DLB | |||||
|---|---|---|---|---|---|---|
| (n = 60) | (n = 37) | |||||
|
| ||||||
| M | (SD) | Min. - Max. | M | (SD) | Min. - Max. | |
|
| ||||||
| Craft Story Immediate1 | 41.34 | 10.72 | 17.36 – 65.89 | 32.98 | 10.23 | 13.48 – 52.60 |
| Craft Story Delayed1 | 40.56 | 8.62 | 22.03 – 59.19 | 30.92 | 9.62 | 14.64 – 51.06 |
| Benson Copy1 | 39.64 | 15.02 | 9.00 – 63.15 | 27.97 | 17.36 | 9.00 – 61.67 |
| Benson Recall1 | 38.73 | 9.50 | 12.43 – 57.11 | 29.28 | 14.46 | 10.12 – 60.83 |
| NSF1 | 46.56 | 8.66 | 21.44 – 65.95 | 42.61 | 10.31 | 16.28 – 62.54 |
| NSB1 | 41.38 | 8.34 | 27.69 – 62.97 | 34.81 | 8.41 | 20.16 – 52.06 |
| MINT1 | 43.86 | 13.14 | 9.00 – 61.98 | 38.56 | 14.20 | 9.00 – 61.85 |
| Letter Fluency1 | 43.44 | 9.20 | 28.29 – 69.73 | 35.67 | 10.74 | 16.69 – 58.22 |
| Animal Fluency1 | 41.14 | 10.63 | 12.82 – 75.12 | 29.81 | 10.29 | 13.76 – 56.21 |
| Vegetable Fluency1 | 39.69 | 8.96 | 20.99 – 69.02 | 31.69 | 8.68 | 17.17 – 51.73 |
| TMT Part A1 | 29.99 | 15.81 | 9.00 – 55.15 | 17.67 | 11.69 | 9.00 – 49.41 |
| TMT Part B1 | 27.60 | 16.37 | 9.00 – 54.43 | 14.37 | 11.05 | 9.00 – 45.71 |
|
| ||||||
| Mean UDS3NB Score1 | 39.49 | 5.84 | 24.14 – 55.00 | 30.53 | 7.12 | 18.28 – 44.52 |
| MoCA2 | 23.47 | 3.73 | 14.00 – 29.00 | 18.09 | 5.34 | 6.00 – 27.00 |
| CDR Global Score | .46 | .14 | 0.0 – 0.5 | .84 | .24 | 0.5 – 1.0 |
Note:
Demographically-corrected T-scores.
Two total participants had missing MoCA scores due to unspecified reasons. T-score means and standard deviations listed above are based on scores that were recoded due to cognitive/behavioral issues, with 1 (1%) missing on Craft Story Immediate, 3 (3%) missing on Craft Story Delayed, 1 (1%) missing on Benson Copy, 1 (1%) missing on Benson Recall, 1 (1%) missing on NSF, 1 (1%) missing on NSB, 1 (1%) missing on MINT, 0 (0%) missing on Letter Fluency, 0 (0%) missing on Animal Fluency, 0 (0%) missing on Vegetable Fluency, 4 (4%) missing on TMT Part A, and 18 (19%) missing on TMT Part B. UDS3NB = Uniform Dataset 3.0 Neuropsychological Battery; MCI-LB = Mild cognitive impairment or “impaired-not-MCI” due to dementia with Lewy bodies; DLB = Dementia due to dementia with Lewy bodies; M = Mean; SD = Standard Deviation; Min. = Minimum observed value; Max = Maximum observed value; NSF = Number Span Forward; NSB = Number Span Backward; MINT = Multilingual Naming Test; TMT = Trailmaking Test; MoCA = Montreal Cognitive Assessment; CDR = Clinical Dementia Rating.
As shown in Table 3, the FAQ ratio score exhibited a significant positive association with age and the CoV. Female sex was associated with higher FAQ ratio scores. Presence of clinician-rated cognitive fluctuations and presence of informant-rated daily cognitive fluctuations were significantly associated with higher FAQ ratio scores. The CoV exhibited a significant positive correlation with age. Presence of both informant-rated daily cognitive fluctuations and clinician-rated cognitive fluctuations were significantly associated with higher CoV. Presence of informant-rated daily cognitive fluctuations was significantly associated with female sex. Presence of clinician-rated cognitive fluctuations exhibited a significant correlation with presence of informant-rated daily cognitive fluctuations. Education, the modified CCI, and the GDS-SF were not significantly associated with the study’s primary dependent variables or any of the independent variables measuring cognitive fluctuations.4
Table 3.
Correlations between daily functioning, clinician-rated cognitive fluctuations, informant-rated daily cognitive fluctuations, CoV, and potential covariates (other than dementia status).
| Variable | Age | Education | Sex | GDS-SF | Modified CCI |
MFSa | CRCFa | FAQ | CoV |
|---|---|---|---|---|---|---|---|---|---|
|
| |||||||||
| 1. Age | –– | –– | –– | –– | –– | –– | –– | –– | –– |
| 2. Education | −0.059 | –– | –– | –– | –– | –– | –– | –– | –– |
| 3. Sex | 0.088 | −0.001 | –– | –– | –– | –– | –– | –– | –– |
| 4. GDS-SF | 0.077 | −0.110 | −0.083 | –– | –– | –– | –– | –– | –– |
| 5. Modified CCI | 0.400*** | −0.098 | 0.138 | 0.046 | –– | –– | –– | –– | –– |
| 6. MFSa | 0.092 | −0.054 | 0.281** | −0.117 | 0.111 | –– | –– | –– | –– |
| 7. CRCFa | 0.184 | −0.040 | 0.149 | 0.134 | 0.100 | 0.406*** | –– | –– | –– |
| 8. FAQ | 0.271** | 0.074 | 0.266** | −0.096 | −0.018 | 0.416*** | 0.371*** | –– | –– |
| 9. CoV | 0.298** | 0.027 | 0.174 | 0.125 | 0.054 | 0.220* | 0.247* | 0.591*** | –– |
Note: GDS-SF = Geriatric Depression Inventory-Short Form; Modified CCI = Modified Charlson Comorbidity Index; FAQ = Functional Activities Questionnaire ratio score; CoV = Coefficient of Variance; MFS = Mayo Fluctuations Scale; CRCF = Clinician-rated Cognitive Fluctuations.
Dichotomous indicator, with absence equal to 1 and presence equal to 2.
p < .05, p < .01, p < .001.
Intraindividual Variability-Dispersion and Informant-rated Daily Cognitive Fluctuations
Per Field-Fote (2019) criteria, there were no identified covariates of the CoV and informant-rated daily cognitive fluctuations given that no variable was significantly related to both the CoV and informant-rated daily cognitive fluctuations (see Table 3). Binary logistic regression predicting the presence/absence of informant-rated daily cognitive fluctuations indicated that higher CoV (greater intraindividual variability-dispersion) was significantly associated (b = 2.03, p = .034) with an increased probability of the presence of informant-rated daily cognitive fluctuations (see Figure 2). The binary logistic regression model yielded an odds ratio of 73.27 (95% Confidence Interval = 1.379, 3,895.046), which reflects a large effect size based on previously published interpretive guidelines (Chen, Cohen, & Chen, 2010).
Figure 2.

Results of the binary logistic regression model. Probability of informant-rated daily cognitive fluctuations present (as indexed by Mayo Fluctuations Scale score ≥ 3) is shown on the y-axis, while CoV scores are shown on the x-axis. Shading around the regression line represents 95% confidence intervals. Note: CoV = Coefficient of Variation.
Cognitive Fluctuations and Daily Functioning
As shown in Table 4, the multiple linear regression model predicting daily functioning using only clinician-rated cognitive fluctuations found that the presence of clinician-rated cognitive fluctuations significantly predicted greater problems with daily functioning (r2 = .138). Adding the CoV to this model significantly improved model fit (F = 41.89, p < .001, Δr2 = .266), with both higher CoV (greater intraindividual variability-dispersion) and presence of clinician-rated cognitive fluctuations significantly associated with increased problems with daily functioning (see Table 4). The VIF value from this model was not suggestive of multicollinearity (VIF = 1.07). A significant improvement in model fit also occurred when the dichotomous indicator of informant-rated daily cognitive fluctuations was added to the model (F = 8.45, p = .005, Δr2 = .050). VIF values from this model were not suggestive of multicollinearity (VIF = 1.09 to 1.24). This model indicated that higher CoV (greater intraindividual variability-dispersion) and presence of informant-rated daily cognitive fluctuations significantly predicted higher problems with daily functioning, while presence/absence of clinician-rated cognitive fluctuations were not significantly associated with daily functioning (see Table 4).
Table 4.
Results from Linear Regression Models Predicting FAQ Ratio Scores.
| Step | r 2 | Variable | Beta (SE) | Standardized Beta | p-value |
|
| |||||
| 1 | .138 | CRCFa | .59 (.15) | .37 | < .001 |
|
| |||||
| Step | △r2 | Variable | Beta (SE) | Standardized Beta | p-value |
|
| |||||
| 2 | .266 | CRCFa | .38 (.13) | .24 | .004 |
| CoV | 3.51 (.54) | .53 | < .001 | ||
|
| |||||
| 3 | .050 | CRCFa | .23 (.13) | .15 | .087 |
| CoV | 3.30 (.53) | .50 | < .001 | ||
| MFSa | .42 (.15) | .25 | .005 | ||
|
| |||||
| 4 | .080 | CRCFa | .15 (.13) | .10 | .24 |
| CoV | 2.18 (.58) | .33 | <.001 | ||
| MFSa | .33 (.14) | .19 | .02 | ||
| Sex | .19 (.15) | .10 | .21 | ||
| Age | .01 (.01) | .11 | .15 | ||
| Dementiaa | .48 (.14) | .30 | <.001 | ||
Note: FAQ = Functional Activities Questionnaire; SE = Standard Error; CRCF = Clinician-rated Cognitive Fluctuations; CoV = Coefficient of Variance; MFS = Mayo Fluctuations Scale; Diagnosis = Presence or absence of dementia due to dementia with Lewy bodies.
Dichotomous indicator, with absence equal to 1 and presence equal to 2.
Per Field-Fote (2019) criteria, age and sex were identified covariates of the relationship of the FAQ ratio score with the CoV and informant-rated daily cognitive fluctuations, respectively, though no other statistical covariates were identified. When these covariates were added in a fourth block, there was a significant improvement in model fit (F = 5.15, p = .002, Δr2 = .080). VIF values from this model were not suggestive of multicollinearity (VIF = 1.10 to 1.47). In this final model, higher CoV (greater intraindividual variability-dispersion) and presence of informant-rated daily cognitive fluctuations remained significantly related to more problems with daily functioning. Presence of dementia (versus MCI-LB) was also significantly related to more problems with daily functioning. In contrast, clinician-rated cognitive fluctuations, age, and sex were non-statistically significant predictors (see Table 4). Figure 3 presents the relationships between FAQ scores and CoV (see Figure 3a), FAQ scores and clinician-rated cognitive fluctuations (see Figure 3b), and FAQ scores and informant-rated daily cognitive fluctuations (see Figure 3c) derived from the final regression model.5
Figure 3.

Results of the final multiple linear regression model. Estimated marginal means for daily functioning and indicators of cognitive fluctuations are presented on the y-axis and x-axis, respectively. Shading around the regression lines represent 95% confidence intervals. (A) Relationship between FAQ and CoV derived from the final regression model. (B) Relationship between FAQ and clinician-rated cognitive fluctuations derived from the final regression model. (C) Relationship between FAQ and informant-rated daily cognitive fluctuations (as indexed by Mayo Fluctuations Scale score ≥ 3) derived from the final regression model. Note: FAQ = Functional Activities Questionnaire ratio score; CoV = Coefficient of Variation.
Discussion
The current study tested the ecological validity of cognitive performance fluctuations across a battery of neurocognitive tests for predicting informant-rated daily cognitive fluctuations and everyday functioning for individuals with DLB. Results indicated that greater performance fluctuations (i.e., intraindividual variability-dispersion) across a battery of neurocognitive tasks completed in the clinic/laboratory accurately classified those with and without informant-reported daily cognitive fluctuations. Additionally, higher intraindividual variability-dispersion and presence of informant-rated daily cognitive fluctuations were incrementally associated with greater impairment of daily functioning. In contrast, clinician-rated cognitive fluctuations were not incrementally associated with greater impairment of daily functioning. Results provide evidence for the ecological validity of intraindividual variability-dispersion in DLB.
This represents the first study to link intraindividual variability-dispersion with daily functioning in DLB and provides evidence that the MFS and intraindividual variability-dispersion are incrementally associated with problems with daily functioning in DLB. Medium to large univariate correlations (rs = .37 to .59) were observed between daily functioning and the three measures of cognitive fluctuations (i.e., MFS, clinician-ratings, and intraindividual variability-dispersion). Additionally, the presence of both informant-rated daily cognitive fluctuations and cognitive fluctuations across a standardized neurocognitive battery (as measured by intraindividual variability-dispersion) were incrementally associated with daily functioning in DLB. Consistent with previous research (Kiselica, Kaser, & Benge, 2021), these data show that subjective reports of daily cognitive fluctuations derived from informants and objective measures of performance fluctuations on neurocognitive testing overlap but also provide uniquely useful information for predicting the daily functioning problems common in DLB. Consistent with previous research on the relevance of executive functions for successful management of daily functioning (Chaytor, Schmitter-Edgecombe, & Burr, 2006), these data show that cognitive fluctuations – which are thought to reflect attention/executive dysfunction (Costa et al., 2019; Matar, Shine, Halliday, & Lewis, 2020; Stuss et al., 2003) – predict daily functioning problems in DLB. As such, these data indicate that intraindividual variability-dispersion and informant-rated daily cognitive fluctuations have incremental ecological validity in DLB.
Consistent with previous research (Webber et al., 2022), the current study also provides evidence that intraindividual variability-dispersion in the laboratory or clinic predicts the presence of daily cognitive fluctuations in DLB at a large effect size (Odds Ratio = 73.27). However, the current study builds on this work by controlling for global cognition while testing the association of intraindividual variability-dispersion and daily cognitive fluctuations in a larger and strictly DLB sample. This association is consistent with evidence suggesting there is neuroanatomical overlap in intraindividual variability-dispersion and MFS-indexed daily cognitive fluctuations. Indeed, executive dysregulation of attention as measured by intraindividual variability-dispersion is related to decreased connectivity in the superior longitudinal fasciculus (Jones et al., 2018), decreased gay and white matter volume (Hines et al., 2016), and dysfunction of the frontal, parietal, and connecting subcortical regions that make up the default mode brain network (Costa et al., 2019). Similarly, the daily cognitive fluctuations as measured by the MFS have been associated with disruptions of the default mode brain network (Matar et al., 2020; Raichle, 2015).
In turn, intraindividual variability-dispersion may be a useful standardized behavioral measure of cognitive fluctuations for several reasons. First, individuals with DLB often exhibit anosognosia (Calil et al., 2021) and may not present with the collateral necessary to complete informant-report measures of daily cognitive fluctuations. Second, intraindividual variability-dispersion can be calculated from an individual’s performance across the neurocognitive test batteries recommended for (McKeith et al., 2017) and commonly used by professionals for diagnosing DLB (Rabin et al., 2014; Sullivan & Bowden, 1997). Therefore, intraindividual variability-dispersion can capture cognitive fluctuations in DLB with little additional cost of time or resources. Third, given that cognitive fluctuations emerge earlier than other core DLB symptoms (Belden et al., 2015; Hamilton et al., 2021) and best differentiate DLB from non-DLB dementias when they are identified earlier (Hansen et al., 1990), intraindividual variability-dispersion can perhaps be used to detect preclinical DLB. This is supported by research showing that intraindividual variability-dispersion is a sensitive pre-clinical indicator of future cognitive and functional impairment (Bangen et al., 2019; Gleason et al., 2018; Koscik et al., 2016). Future research would benefit from testing whether intraindividual variability-dispersion can accurately classify those with and without DLB pathology before the clinical manifestation of symptoms. The deliverables of such future research may provide important insights into underlying disease mechanisms as individuals with DLB pathology transition from initial central nervous system dysfunction to the first manifestation of clinical symptoms. Additionally, intraindividual variability-dispersion may be a useful outcome measure in the clinical trials that have begun to selectively target cognitive fluctuations (Blanc, n.d.).
Several limitations should be considered in the interpretation of these findings. First, the relationship between clinician-rated cognitive fluctuations and activities of daily living was not statistically significant in our study when considering the other measures of cognitive fluctuations. This may reflect the previously cited substandard reliability of clinician-rated cognitive fluctuations (Litvan et al., 1998; Mega et al., 1996), particularly considering that our measure of this construct was based on a single item. As such, clinician-ratings of cognitive fluctuations may exhibit incremental utility for daily functioning using more rigorous, semiquantified measures (Bradshaw et al., 2004; Walker et al., 2000b), necessitating further studies on the ecological validity of different measures of DLB cognitive fluctuations.
Relatedly, the frequency of MFS-indexed (n = 28; 29%) and clinician-rated cognitive fluctuations (n = 39; 40%) in this sample were also somewhat low. As such, these findings may not generalize to samples with a higher frequency of cognitive fluctuations. Notably, our results suggest that cognitive fluctuations are more common in dementia due to DLB than MCI-LB. Given that a minority of this sample included participants with dementia (n = 37; 38%), future research would benefit from testing these associations in a sample with more significant cognitive and functional impairment. Similarly, the somewhat modest sample size may have contributed to reduced power to detect a significant association of clinician-rated cognitive fluctuations and daily functioning in the final regression model that included covariates.
An additional limitation concerns the method of operationalizing intraindividual variability-dispersion. We elected to use the full UDS3NB battery rather than a subset of UDS3NB tests that may be more sensitive to DLB given that previous research on intraindividual variability-dispersion has typically utilized more broad neurocognitive batteries to index this phenomenon (Costa et al., 2019; Stuss et al., 2003). However, future research would benefit from testing whether operationalizing intraindividual variability-dispersion using the tests with the largest effect size for identifying DLB (e.g., attention, visuospatial measures)(McKeith et al., 2017) may be a more sensitive index of cognitive performance fluctuations. A final limitation is that the sample included predominantly male, relatively highly educated, and predominantly White/non-Hispanic participants, suggesting that the external validity of these findings to individuals with other demographics is relatively limited. This emphasizes the need for future research that replicates these findings in a larger sample of individuals with more diverse demographic characteristics. Nevertheless, this study provides initial evidence for the ecological validity of intraindividual variability-dispersion in DLB and further supports the clinical relevance of this measure of cognitive fluctuations.
Supplementary Material
Acknowledgements/Funding Sources
Conflicts of Interest/Competing Interests: The authors declare no conflicts of interest or competing interests. The NACC database is funded by NIA/NIH Grant U24 AG072122. NACC data are contributed by the NIA-funded ADCs: P50 AG005131 (PI James Brewer, MD, PhD), P50 AG005133 (PI Oscar Lopez, MD), P50 AG005134 (PI Bradley Hyman, MD, PhD), P50 AG005136 (PI Thomas Grabowski, MD), P50 AG005138 (PI Mary Sano, PhD), P50 AG005142 (PI Helena Chui, MD), P50 AG005146 (PI Marilyn Albert, PhD), P50 AG005681 (PI John Morris, MD), P30 AG008017 (PI Jeffrey Kaye, MD), P30 AG008051 (PI Thomas Wisniewski, MD), P50 AG008702 (PI Scott Small, MD), P30 AG010124 (PI John Trojanowski, MD, PhD), P30 AG010129 (PI Charles DeCarli, MD), P30 AG010133 (PI Andrew Saykin, PsyD), P30 AG010161 (PI David Bennett, MD), P30 AG012300 (PI Roger Rosenberg, MD), P30 AG013846 (PI Neil Kowall, MD), P30 AG013854 (PI Robert Vassar, PhD), P50 AG016573 (PI Frank LaFerla, PhD), P50 AG016574 (PI Ronald Petersen, MD, PhD), P30 AG019610 (PI Eric Reiman, MD), P50 AG023501 (PI Bruce Miller, MD), P50 AG025688 (PI Allan Levey, MD, PhD), P30 AG028383 (PI Linda Van Eldik, PhD), P50 AG033514 (PI Sanjay Asthana, MD, FRCP), P30 AG035982 (PI Russell Swerdlow, MD), P50 AG047266 (PI Todd Golde, MD, PhD), P50 AG047270 (PI Stephen Strittmatter, MD, PhD), P50 AG047366 (PI Victor Henderson, MD, MS), P30 AG049638 (PI Suzanne Craft, PhD), P30 AG053760 (PI Henry Paulson, MD, PhD), P30 AG066546 (PI Sudha Seshadri, MD), P20 AG068024 (PI Erik Roberson, MD, PhD), P20 AG068053 (PI Marwan Sabbagh, MD), P20 AG068077 (PI Gary Rosenberg, MD), P20 AG068082 (PI Angela Jefferson, PhD), P30 AG072958 (PI Heather Whitson, MD), P30 AG072959 (PI James Leverenz, MD).
Footnotes
A presumptive etiologic co-occurring Alzheimer’s disease (AD) diagnosis was also observed for 6 (6%) of participants, with 4 (4%) participants in the MCI-LB group exhibiting a mixed DLB and AD diagnosis and 2 (2%) participants in the DLB group exhibiting a mixed DLB and AD diagnosis. Dementia status was not significantly associated with presence/absence of mixed DLB and AD (X2 = .06, p-value = .80, Cramer’s V = .03).
For the modified CCI, 52 (54%) of participants had arthritis (rheumatoid or osteo), 0 (0%) had human immunodeficiency virus, 3 (3%) had congestive heart failure, 9 (9%) had heart attack/myocardial infarction, 12 (12%) had atrial fibrillation, 6 (6%) had other cardiovascular condition (e.g., aortic aneurysm), 13 (13%) had diabetes (type I or type II), 41 (42%) had sleep apnea, 13 (13%) had cancer, 50 (52%) had hypertension, 59 (61%) had hypercholesterolemia, and 18 (19%) had thyroid disease.
The three participants that were not White/Non-Hispanic were either White/Hispanic (n = 2) or of an unspecified “Other”/Non-Hispanic race/ethnicity (n = 1).
As shown in the Supplemental Materials, a diagnosis of mixed DLB and AD was also not a statistical covariate of the study’s primary dependent variables or any of the independent variables measuring cognitive fluctuations.
Using the standard FAQ scoring procedure (scores of 0 to 30), results were largely consistent with those that utilized the FAQ ratio score (see Supplemental Materials), though informant-rated daily cognitive fluctuations were not significantly associated with the standard FAQ score in the model that included covariates. Additionally, dementia status was not identified as a moderator of the relationship between the CoV and daily functioning as measured by either the FAQ ratio score or the standard FAQ score (see Supplemental Materials).
References
- Ballard C, O’Brien J, Gray A, Cormack F, Ayre G, Rowan E, … Tovee M (2001). Attention and fluctuating attention in patients with dementia with lewy bodies and alzheimer disease. Archives of Neurology, 58(6), 977–982. 10.1001/archneur.58.6.977 [DOI] [PubMed] [Google Scholar]
- Ballard C, Walker M, O’Brien J, Rowan E, & McKeith I (2001). The characterisation and impact of ‘fluctuating’ cognition in dementia with Lewy bodies and Alzheimer’s disease. International Journal of Geriatric Psychiatry, 16(5), 494–498. 10.1002/GPS.368 [DOI] [PubMed] [Google Scholar]
- Bangen KJ, Weigand AJ, Thomas KR, Delano-Wood L, Clark LR, Eppig J, … Bondi MW (2019). Cognitive dispersion is a sensitive marker for early neurodegenerative changes and functional decline in nondemented older adults. Neuropsychology, 33(5), 599–608. 10.1037/neu0000532 [DOI] [PMC free article] [PubMed] [Google Scholar]
- Belden CM, Kahlon V, Malek-Ahmadi M, Tsai A, & Sabbagh MN (2015). Clinical characterization of mild cognitive impairment as a prodrome to dementia with lewy bodies. American Journal of Alzheimer’s Disease and Other Dementias, 30(2), 173–177. 10.1177/1533317514542642 [DOI] [PMC free article] [PubMed] [Google Scholar]
- Besser L, Kukull W, Knopman DS, Chui H, Galasko D, Weintraub S, … Morris JC (2018). Version 3 of the national Alzheimer’s coordinating center’s uniform data set. Alzheimer Disease and Associated Disorders, Vol. 32, pp. 351–358. 10.1097/WAD.0000000000000279 [DOI] [PMC free article] [PubMed] [Google Scholar]
- Blanc F (n.d.). Personalized Repetitive Transcranial Magnetic Stimulation (rTMS) in Cognitive Fluctuations of Dementia With Lewy Bodies (DLB): Proof of Concept. Retrieved December 10, 2021, from https://clinicaltrials.gov/ct2/show/NCT05138588?term=cognitive+fluctuations&cond=Dementia+with+Lewy+Bodies&draw=2&rank=1
- Bliwise DL, Scullin MK, & Trotti LM (2014). Fluctuations in cognition and alertness vary independently in dementia with Lewy bodies. Movement Disorders, 29(1), 83–89. 10.1002/mds.25707 [DOI] [PMC free article] [PubMed] [Google Scholar]
- Bradshaw J, Saling M, Hopwood M, Anderson V, & Brodtmann A (2004). Fluctuating cognition in dementia with Lewy bodies and Alzheimer’s disease is qualitatively distinct. Journal of Neurology, Neurosurgery and Psychiatry, 75(3), 382–387. 10.1136/jnnp.2002.002576 [DOI] [PMC free article] [PubMed] [Google Scholar]
- Bunce DJ, Warr PB, & Cochrane T (1993). Blocks in Choice Responding as a Function of Age and Physical Fitness. Psychology and Aging, 8(1), 26–33. 10.1037/0882-7974.8.1.26 [DOI] [PubMed] [Google Scholar]
- Calil V, Silveira de Souza A, Sudo FK, Santiago-Bravo G, Assunção N, Drummond C, … Mattos P (2021). Anosognosia for memory in dementia with Lewy bodies compared with Alzheimer’s disease. International Journal of Geriatric Psychiatry, 36(7), 1059–1064. 10.1002/GPS.5521 [DOI] [PubMed] [Google Scholar]
- Charlson ME, Charlson RE, Peterson JC, Marinopoulos SS, Briggs WM, & Hollenberg JP (2008). The Charlson comorbidity index is adapted to predict costs of chronic disease in primary care patients. Journal of Clinical Epidemiology, 61(12), 1234–1240. 10.1016/j.jclinepi.2008.01.006 [DOI] [PubMed] [Google Scholar]
- Chaytor N, Schmitter-Edgecombe M, & Burr R (2006). Improving the ecological validity of executive functioning assessment. Archives of Clinical Neuropsychology, 21(3), 217–227. 10.1016/j.acn.2005.12.002 [DOI] [PubMed] [Google Scholar]
- Chen H, Cohen P, & Chen S (2010). How big is a big odds ratio? Interpreting the magnitudes of odds ratios in epidemiological studies. Communications in Statistics: Simulation and Computation, 39(4), 860–864. 10.1080/03610911003650383 [DOI] [Google Scholar]
- Chin KS, Teodorczuk A, & Watson R (2019, April 1). Dementia with Lewy bodies: Challenges in the diagnosis and management. Australian and New Zealand Journal of Psychiatry, Vol. 53, pp. 291–303. SAGE Publications Inc. 10.1177/0004867419835029 [DOI] [PubMed] [Google Scholar]
- Costa AS, Dogan I, Schulz JB, & Reetz K (2019). Going beyond the mean: Intraindividual variability of cognitive performance in prodromal and early neurodegenerative disorders. Clinical Neuropsychologist, 33(2), 369–389. 10.1080/13854046.2018.1533587 [DOI] [PubMed] [Google Scholar]
- Craft S, Newcomer J, Kanne S, Dagogo-Jack S, Cryer P, Sheline Y, … Alderson A (1996). Memory improvement following induced hyperinsulinemia in Alzheimer’s disease. Neurobiology of Aging, 17(1), 123–130. 10.1016/0197-4580(95)02002-0 [DOI] [PubMed] [Google Scholar]
- Farias ST, Gravano J, Weakley A, Schmitter-Edgecombe M, Harvey D, Mungas D, … Giovannetti T (2020). The Everyday Compensation (EComp) Questionnaire: Construct Validity and Associations with Diagnosis and Longitudinal Change in Cognition and Everyday Function in Older Adults. Journal of the International Neuropsychological Society, 26(3), 303–313. 10.1017/S135561771900119X [DOI] [PubMed] [Google Scholar]
- Farias ST, Mungas D, Reed BR, Cahn-Weiner D, Jagust W, Baynes K, & DeCarli C (2008). The Measurement of Everyday Cognition (ECog): Scale Development and Psychometric Properties. Neuropsychology, 22(4), 531–544. 10.1037/0894-4105.22.4.531 [DOI] [PMC free article] [PubMed] [Google Scholar]
- Fellows RP, & Schmitter-Edgecombe M (2015). Between-domain cognitive dispersion and functional abilities in older adults. Journal of Clinical and Experimental Neuropsychology, 37(10), 1013–1023. 10.1080/13803395.2015.1050360 [DOI] [PMC free article] [PubMed] [Google Scholar]
- Ferman TJ, Smith GE, Boeve BF, Ivnik RJ, Petersen RC, Knopman D, … Dickson DW (2004). Specific features that reliably differentiate DLB from AD and normal aging. Neurology, 62(2), 181–187. 10.1212/WNL.62.2.181 [DOI] [PubMed] [Google Scholar]
- Field-Fote EE (2019). Mediators and Moderators, Confounders and Covariates: Exploring the Variables That Illuminate or Obscure the “Active Ingredients” in Neurorehabilitation. Journal of Neurologic Physical Therapy : JNPT, 43(2), 83–84. 10.1097/NPT.0000000000000275 [DOI] [PubMed] [Google Scholar]
- Fillenbaum GG, Peterson B, & Morris JC (1996). Estimating the validity of the Clinical Dementia Rating scale: The CERAD experience. Aging, 8(6), 379–385. 10.1007/bf03339599 [DOI] [PubMed] [Google Scholar]
- Galvin JE, Chrisphonte S, Cohen I, Greenfield KK, Kleiman MJ, Moore C, … Tolea MI (2021). Characterization of dementia with Lewy bodies (DLB) and mild cognitive impairment using the Lewy body dementia module (LBD-MOD). Alzheimer’s & Dementia. 10.1002/alz.12334 [DOI] [PMC free article] [PubMed] [Google Scholar]
- Gleason CE, Norton D, Anderson ED, Wahoske M, Washington DT, Umucu E, … Asthana S (2018). Cognitive Variability Predicts Incident Alzheimer’s Disease and Mild Cognitive Impairment Comparable to a Cerebrospinal Fluid Biomarker. Journal of Alzheimer’s Disease, 61(1), 79–89. 10.3233/JAD-170498 [DOI] [PMC free article] [PubMed] [Google Scholar]
- Gollan TH, Weissberger GH, Runnqvist E, Montoya RI, & Cera CM (2012). Self-ratings of spoken language dominance: A Multilingual Naming Test (MINT) and preliminary norms for young and aging Spanish-English bilinguals. Bilingualism, 15(3), 594–615. 10.1017/S1366728911000332 [DOI] [PMC free article] [PubMed] [Google Scholar]
- González DA, Clark MJ, Gonzales MM, & Benge J (2022). Brief Report: An Evaluation of Item Bias on the Functional Activities Questionnaire. Archives of Clinical Neuropsychology. 10.1093/arclin/acac071 [DOI] [PMC free article] [PubMed] [Google Scholar]
- González DA, Gonzales MM, Resch ZJ, Sullivan AC, & Soble JR (2022). Comprehensive Evaluation of the Functional Activities Questionnaire (FAQ) and Its Reliability and Validity. Assessment, 29(4), 748–763. 10.1177/1073191121991215 [DOI] [PMC free article] [PubMed] [Google Scholar]
- Hamilton CA, Matthews FE, Donaghy PC, Taylor J-P, O’Brien JT, Barnett N, … Thomas AJ (2021). Progression to Dementia in Mild Cognitive Impairment With Lewy Bodies or Alzheimer Disease. Neurology, 10.1212/WNL.0000000000012024. [DOI] [PMC free article] [PubMed] [Google Scholar]
- Hansen L, Salmon D, Galasko D, Masliah E, Katzman R, Deteresa R, … Alford M (1990). The lewy body variant of alzheimer’s disease: A clinical and pathologic entity. Neurology, 40(1), 1–8. 10.1212/wnl.40.1.1 [DOI] [PubMed] [Google Scholar]
- Heaton RK (2004). Revised comprehensive norms for an expanded Halstead-Reitan Battery: Demographically adjusted neuropsychological norms for African American and Caucasian adults, professional manual. Psychological Assessment Resources. [Google Scholar]
- Hines LJ, Miller EN, Hinkin CH, Alger JR, Barker P, Goodkin K, … for the Multicenter AIDS Cohort Study. (2016). Cortical brain atrophy and intra-individual variability in neuropsychological test performance in HIV disease. Brain Imaging and Behavior, 10(3), 640–651. 10.1007/s11682-015-9441-1 [DOI] [PMC free article] [PubMed] [Google Scholar]
- Ivanova I, Salmon DP, & Gollan TH (2013). Multilingual naming test in alzheimer’s disease: Clues to the origin of naming impairments. Journal of the International Neuropsychological Society, 19(3), 272–283. 10.1017/S1355617712001282 [DOI] [PMC free article] [PubMed] [Google Scholar]
- Jones JD, Kuhn T, Mahmood Z, Singer EJ, Hinkin CH, & Thames AD (2018). Longitudinal intra-individual variability in Neuropsychological performance relates to white matter changes in HIV. Neuropsychology, 32(2), 206–212. 10.1037/neu0000390 [DOI] [PMC free article] [PubMed] [Google Scholar]
- Kiselica AM, & Benge JF (2019). Quantitative and qualitative features of executive dysfunction in frontotemporal and Alzheimer’s dementia. 10.1080/23279095.2019.1652175, 28(4), 449–463. 10.1080/23279095.2019.1652175 [DOI] [PMC free article] [PubMed] [Google Scholar]
- Kiselica AM, Johnson E, & Benge JF (2021). How impaired is too impaired? Exploring futile neuropsychological test patterns as a function of dementia severity and cognitive screening scores. Journal of Neuropsychology, 15(3), 410–427. 10.1111/jnp.12243 [DOI] [PMC free article] [PubMed] [Google Scholar]
- Kiselica AM, Kaser AN, & Benge JF (2021). An initial empirical operationalization of the earliest stages of the Alzheimer’s continuum. Alzheimer Disease and Associated Disorders, 35(1), 62–67. 10.1097/WAD.0000000000000408 [DOI] [PMC free article] [PubMed] [Google Scholar]
- Kiselica AM, Webber TA, & Benge JF (2020a). The uniform dataset 3.0 neuropsychological battery: Factor structure, invariance testing, and demographically adjusted factor score calculation. Journal of the International Neuropsychological Society, 26(6), 576–586. 10.1017/S135561772000003X [DOI] [PMC free article] [PubMed] [Google Scholar]
- Kiselica AM, Webber TA, & Benge JF (2020b). Using multivariate base rates of low scores to understand early cognitive declines on the uniform data set 3.0 neuropsychological battery. Neuropsychology, 34(6), 629–640. 10.1037/NEU0000640 [DOI] [PMC free article] [PubMed] [Google Scholar]
- Koscik RL, Berman SE, Clark LR, Mueller KD, Okonkwo OC, Gleason CE, … Johnson SC (2016). Intraindividual Cognitive Variability in Middle Age Predicts Cognitive Impairment 8–10 Years Later: Results from the Wisconsin Registry for Alzheimer’s Prevention. Journal of the International Neuropsychological Society, 22(10), 1016–1025. 10.1017/S135561771600093X [DOI] [PMC free article] [PubMed] [Google Scholar]
- LaPlume AA, Anderson ND, McKetton L, Levine B, & Troyer AK (2022). When I’m 64: Age-Related Variability in over 40,000 Online Cognitive Test Takers. Journals of Gerontology - Series B Psychological Sciences and Social Sciences, 77(1), 104–117. 10.1093/geronb/gbab143 [DOI] [PMC free article] [PubMed] [Google Scholar]
- Lea RS, Benge JF, Adler CH, Beach TG, Belden CM, Zhang N, … Atri A (2021). An initial exploration of the convergent and ecological validity of the UDS 3.0 neuropsychological battery in Parkinson’s Disease. Journal of Clinical and Experimental Neuropsychology, 43(9), 918–925. 10.1080/13803395.2022.2034753 [DOI] [PMC free article] [PubMed] [Google Scholar]
- Lee DR, McKeith I, Mosimann U, Ghosh-Nodyal A, & Thomas AJ (2013). Examining carer stress in dementia: The role of subtype diagnosis and neuropsychiatric symptoms. International Journal of Geriatric Psychiatry, 28(2), 135–141. 10.1002/gps.3799 [DOI] [PubMed] [Google Scholar]
- Lee DR, Taylor JP, & Thomas AJ (2012, October 1). Assessment of cognitive fluctuation in dementia: A systematic review of the literature. International Journal of Geriatric Psychiatry, Vol. 27, pp. 989–998. John Wiley & Sons, Ltd. 10.1002/gps.2823 [DOI] [PubMed] [Google Scholar]
- Litvan I, MacIntyre A, Goetz CG, Wenning GK, Jellinger K, Verny M, … Agid Y (1998). Accuracy of the clinical diagnoses of Lewy body disease, Parkinson disease, and dementia with Lewy bodies: A clinicopathologic study. Archives of Neurology, 55(7), 969–978. 10.1001/archneur.55.7.969 [DOI] [PubMed] [Google Scholar]
- Matar E, Shine JM, Halliday GM, & Lewis SJG (2020, January 1). Cognitive fluctuations in Lewy body dementia: Towards a pathophysiological framework. Brain, Vol. 143, pp. 31–46. Oxford University Press. 10.1093/brain/awz311 [DOI] [PubMed] [Google Scholar]
- McKeith IG, Boeve BF, DIckson DW, Halliday G, Taylor JP, Weintraub D, … Kosaka K (2017, July 4). Diagnosis and management of dementia with Lewy bodies. Neurology, Vol. 89, pp. 88–100. Lippincott Williams and Wilkins. 10.1212/WNL.0000000000004058 [DOI] [PMC free article] [PubMed] [Google Scholar]
- Mega MS, Masterman DL, Benson DF, Vinters HV, Tomiyasu U, Craig AH, … Cummings JL (1996). Dementia with Lewy bodies. Neurology, 47(6), 1403–1409. 10.1212/WNL.47.6.1403 [DOI] [PubMed] [Google Scholar]
- Morgan EE, Woods SP, & Grant I (2012). Intra-individual neurocognitive variability confers risk of dependence in activities of daily living among HIV-seropositive individuals without HIV-associated neurocognitive disorders. Archives of Clinical Neuropsychology, 27(3), 293–303. 10.1093/arclin/acs003 [DOI] [PMC free article] [PubMed] [Google Scholar]
- Morris JC (1993). The clinical dementia rating (cdr): Current version and scoring rules. Neurology, 43(11), 2412–2414. 10.1212/wnl.43.11.2412-a [DOI] [PubMed] [Google Scholar]
- O’brien RM (2007). A Caution Regarding Rules of Thumb for Variance Inflation Factors. Quality & Quantity, 41, 673–690. [Google Scholar]
- Partington JE, & Leiter GR (1949). Partington’s Pathways Test. Psychological Service Center Journal, 1, 11–20. [Google Scholar]
- Pfeffer RI, Kurosaki TT, Harrah CH, Chance JM, & Filos S (1982). Measurement of functional activities in older adults in the community. Journals of Gerontology, 37(3), 323–329. 10.1093/geronj/37.3.323 [DOI] [PubMed] [Google Scholar]
- Possin KL, Laluz VR, Alcantar OZ, Miller BL, & Kramer JH (2011). Distinct neuroanatomical substrates and cognitive mechanisms of figure copy performance in Alzheimer’s disease and behavioral variant frontotemporal dementia. Neuropsychologia, 49(1), 43–48. 10.1016/j.neuropsychologia.2010.10.026 [DOI] [PMC free article] [PubMed] [Google Scholar]
- Rabin LA, Spadaccini AT, Brodale DL, Grant KS, Elbulok-Charcape MM, & Barr WB (2014). Utilization rates of computerized tests and test batteries among clinical neuropsychologists in the United States and Canada. Professional Psychology: Research and Practice, 45(5), 368–377. 10.1037/a0037987 [DOI] [Google Scholar]
- Raichle ME (2015). The Brain’s Default Mode Network. Annual Review of Neuroscience, 38, 433–447. 10.1146/annurev-neuro-071013-014030 [DOI] [PubMed] [Google Scholar]
- Rizzo G, Arcuti S, Copetti M, Alessandria M, Savica R, Fontana A, … Logroscino G (2018, April 1). Accuracy of clinical diagnosis of dementia with Lewy bodies: A systematic review and meta-analysis. Journal of Neurology, Neurosurgery and Psychiatry, Vol. 89, pp. 358–366. BMJ Publishing Group. 10.1136/jnnp-2017-316844 [DOI] [PubMed] [Google Scholar]
- Salmon DP, & Bondi MW (2009). Neuropsychological assessment of dementia. Annual Review of Psychology, 60, 257–282. 10.1146/annurev.psych.57.102904.190024 [DOI] [PMC free article] [PubMed] [Google Scholar]
- Sheikh JI, & Yesavage JA (1986). Geriatric Depression Scale (GDS): Recent Evidence and 33 Development of a Shorter Version. Clinical Gerontologist, 5(1–2), 165–173. 10.1300/J018v05n01_09 [DOI] [Google Scholar]
- Stuss DT, Murphy KJ, Binns MA, & Alexander MP (2003). Staying on the job: The frontal lobes control individual performance variability. Brain, 126(11), 2363–2380. 10.1093/brain/awg237 [DOI] [PubMed] [Google Scholar]
- Sullivan K, & Bowden SC (1997). Which tests do neuropsychologists use? Journal of Clinical Psychology, 53(7), 657–661. [DOI] [PubMed] [Google Scholar]
- Tappen RM, Rosselli M, & Engstrom G (2010). Evaluation of the functional activities questionnaire (FAQ) in cognitive screening across four american ethnic groups. Clinical Neuropsychologist, 24(4), 646–661. 10.1080/13854040903482855 [DOI] [PubMed] [Google Scholar]
- Teng E, Becker BW, Woo E, Knopman DS, Cummings JL, & Lu PH (2010). Utility of the functional activities questionnaire for distinguishing mild cognitive impairment from very mild Alzheimer disease. Alzheimer Disease and Associated Disorders, 24(4), 348–353. 10.1097/WAD.0b013e3181e2fc84 [DOI] [PMC free article] [PubMed] [Google Scholar]
- Tractenberg RE, & Pietrzak RH (2011). Intra-individual variability in alzheimer’s disease and cognitive aging: Definitions, context, and effect sizes. PLoS ONE, 6(4), e16973. 10.1371/journal.pone.0016973 [DOI] [PMC free article] [PubMed] [Google Scholar]
- Walker MP, Ayre GA, Cummings JL, Wesnes K, McKeith IG, O’Brien JT, & Ballard CG (2000a). Quantifying fluctuation in dementia with Lewy bodies, Alzheimer’s disease, and vascular dementia. Neurology, 54(8), 1616–1624. 10.1212/wnl.54.8.1616 [DOI] [PubMed] [Google Scholar]
- Walker MP, Ayre GA, Cummings JL, Wesnes K, McKeith IG, O’Brien JT, & Ballard CG (2000b). The clinician assessment of fluctuation and the one day fluctuation assessment scale: Two methods to assess fluctuating confusion in dementia. British Journal of Psychiatry, 177(SEPT), 252–256. 10.1192/bjp.177.3.252 [DOI] [PubMed] [Google Scholar]
- Webber TA, Kiselica AM, Mikula C, & Woods SP (2022). Dispersion-based cognitive intra-individual variability in dementia with Lewy bodies. Neuropsychology. 10.1037/NEU0000856 [DOI] [PMC free article] [PubMed] [Google Scholar]
- Weintraub S, Besser L, Dodge HH, Teylan M, Ferris S, Goldstein FC, … Morris JC (2018). Version 3 of the Alzheimer Disease Centers’ Neuropsychological Test Battery in the Uniform Data Set (UDS). Alzheimer Disease and Associated Disorders, 32(1), 10–17. 10.1097/WAD.0000000000000223 [DOI] [PMC free article] [PubMed] [Google Scholar]
- Wilcox R (2005). Trimming and Winsorization. In Encyclopedia of Biostatistics. John Wiley & Sons, Ltd. 10.1002/0470011815.b2a15165 [DOI] [Google Scholar]
- Yin L, Ren Y, Wang X, Li Y, Hou T, Liu K, … Du Y (2020). The power of the Functional Activities Questionnaire for screening dementia in rural-dwelling older adults at high-risk of cognitive impairment. Psychogeriatrics, 20(4), 427–436. 10.1111/psyg.12524 [DOI] [PubMed] [Google Scholar]
Associated Data
This section collects any data citations, data availability statements, or supplementary materials included in this article.