

Abstract
Dengue hemorrhagic fever is a worldwide epidemic caused by dengue virus and spread by infected female mosquitoes. The two main mosquito species vectors of the dengue virus are Aedes aegypti and Aedes albopictus. Conventionally, the identification of these two species’ egg is time-consuming which makes vector control more difficult. However, although attempts on efficiency improvements by providing automatic identification have been conducted, the earliest stage is at the larval stage. In addition, there are currently no studies on classifying to distinguish the two vectors during the egg stage based on their digital image. A total of 140 egg images of Aedes aegypti and Aedes albopictus were collected and validated by rearing them individually to become adult mosquitoes. Image processing and elliptic Fourier analysis were carried out to extract and describe the shape difference of the two vectors’ eggs. Machine learning algorithms were then used to classify the shape signatures. Morphometrically, the two species’ eggs were significantly different, which Aedes albopictus were smaller in size. Egg-shape contour reconstructions of principal components and Multivariate Analysis of Variance (MANOVA) revealed that there is a significant difference (p value ) in shape between two species’ eggs at the posterior end. Based on Wilk’s lambda of the MANOVA results, the classification could be done using only the first 3 principal components. Classification of the test data yielded an accuracy of 85.00% and F1 score 84.21% with Linear Discriminant Analysis applying default hyperparameter. Alternatively, k-Nearest Neighbors with optimal hyperparameter yielded a higher classification result with 87.50% and 87.18% of accuracy and F1 score, respectively. These results demonstrate that the proposed method can be used to classify Aedes aegypti and Aedes albopictus eggs based on their digital image. This method provides a foundation for improving the identification and surveillance of the two vectors and decision making in developing vector control strategies.
Subject terms: Biological techniques, Engineering, Mathematics and computing
Introduction
Dengue Hemorrhagic Fever (DHF) is a dangerous disease and has received a lot of attention in the world for decades, especially in tropical and sub-tropical countries. DHF is a disease caused by the dengue virus and its spread is caused by infected female mosquitoes. The two main mosquito species of dengue vector virus that cause dengue fever are Aedes aegypti and Aedes albopictus1, 2. Based on a modelling study, it is estimated that there are 390 million cases of the disease caused by the dengue virus annually from all over the world3. Due to the limitations and restricted use of available effective dengue vaccines, dengue virus vector control becomes the main choice in the efforts to prevent and to reduce the spread of DHF2, 4.
An attempt to detect the presence of the dengue virus vector that has been widely used is by using ovitraps. Several studies show ovitraps are able to detect the eggs, larvae, pupae5, and adult Aedes aegypti mosquitoes6. An ovitrap-based surveillance is usually done by installing a number of ovitraps in a monitoring area. Then identification and analysis are carried out at the mature and immature stages to estimate the abundance of a particular mosquito species in each area, although the monitoring systems are complex and changeable7–12. Based on the results of the analysis, further control strategies can be designed.
Ae. aegypti and Ae. albopictus are mosquitoes that lay eggs in artificial and natural water reservoirs, such as old tires, plastic, and tree holes. After the eggs hatch, the larvae will develop for several days to weeks depending on the temperature until they become pupae. Pupae will develop for 2–3 days until they become adult mosquitoes. Female Aedes mosquitoes can produce 100–200 eggs after receiving blood meal1. They lay their eggs on a moist surface at varying distances from the surface of the water. In the mature stage, Ae. aegypti and Ae. albopictus can be distinguished by observing the body parts of the mosquito. The easiest and quite clear observations to distinguish the two types of mosquitoes are based on the thorax part of the mosquito. Thorax mosquito Ae. aegypti has a pattern of two thin horizontal white lines in the middle and is surrounded by a curved line in the shape of a lute. While the thorax of Ae. albopictus has a pattern of one wide horizontal white line in the middle1. However, in the immature stage, identification of the eggs is still a challenge in ovitraps-based surveillance. Conventionally, the scanning electron microscopy (SEM) has been commonly used to study and identify the parameters to distinguish Aedes eggs13–15, specifically Ae. aegypti and Ae. albopictus eggs16–18. SEM has advantages in presenting a high resolution and detailed observation of fine structure of the eggs.
One of the earliest studies of Aedes eggs using SEM was presented in13 and14. In these studies, the surface structures were identified to distinguish the Aedes eggs including Ae. aegypti and Ae. albopictus. The authors reported key characteristics based on the pattern of reticulation, shape, and dimensions of papillae. However, in these papers, Ae. aegypti and Ae. albopictus were found similar with the same key characteristics. In16, the first comparison of Ae. aegypti and Ae. albopictus eggs was reported. In this paper, the micropylar collar was found to differentiate the eggs. In terms of shape, Ae. albopictus was known to be more tapered at the posterior end. The paper that more specific in studying the differentiation of Ae. aegypti and Ae. albopictus eggs is presented in17. The authors reported among 33 attributes which includes egg dimensions, micropylar apparatus, and outer chorionic cells dimension and density, these species’ eggs were 48,48% significantly different. In terms of shape, both species’ eggs were found to be cigar-shaped and tapered at ends. However, Ae. albopictus eggs are more tapered posteriorly. In18, an observation of the Aedes eggs using SEM with detailed color images was presented. The authors reported that these species’ eggs were similar and could be distinguished by their micropylar collar and central tubercles size. In terms of shape, Ae. albopictus is known to be strongly tapered from the widest point to the end of the egg. The latest study of Ae. aegypti and Ae. albopictus eggs differentiation was presented in19. In this paper, X-ray computed microtomography (micro-CT) was used. The proposed technique helped to measure the parameters directly, including length, surface area, volume, and eccentricity. In terms of shape, Ae. albopictus were found to be more tapered at ends presented by smaller eccentricity values.
The studies of Ae. aegypti and Ae. albopictus eggs using SEM and micro-CT yielded visible attributes to differentiate these species’ eggs for identification. However, these methods are time-consuming due to the transportation problems when the samples are far from the central laboratory20, stressfulness for the experts who manually identify each sample21, and complicated procedures. With consideration of the short life span of mosquitoes, these conventional methods make vector control more difficult. This problem motivates the need for automatic identification with minimal human expert intervention.
Although several attempts based on technology solutions have been made to improve the efficiency in vector surveillance20–24, the earliest stage that can be done for automatic identification is at the larval stage. Current attempts on mosquito egg identification25–28 still focus on counting the number of Ae. aegypti and Ae. albopictus eggs in ovitraps without identification29. By being able to identify at the egg stage, a more efficient identification process can be produced.
Recently, Elliptic Fourier Analysis (EFA) have been widely used in extracting and describing the shapes of agriculture products30–33, vectors’ egg34 and body morphology35. Based on previously described studies, it was stated that the Ae. albopictus eggs are more tapered at the posterior end16–18. Thus, we hypothesize that they could be classified by their shape. In this paper, the classification is carried out using a Linear Discriminant Analysis30, 31, 35, 36 and several alternative classification algorithms.
The objectives of this paper are to propose automatic identification of Ae. aegypti and Ae. albopictus eggs based on EFA and machine learning algorithms. The proposed method also uses a low-cost system based on a cellphone camera and a macro lens extension to provide easier implementation in a real case surveillance.
Material and methods
Data collection
The egg samples used in this paper were Ae. aegypti and Ae. albopictus eggs. Ae. aegypti eggs were obtained from the PPR Laboratory Research Station of the School of Life Sciences and Technology, Institut Teknologi Bandung, Indonesia (). Meanwhile, Ae. albopictus eggs were obtained by ovitraps-based collection. The ovitraps were placed at two outdoor parks, namely ITB’s Botani Park () and Ganesha Park (). Both parks are located in Bandung, Indonesia. Egg samples of Ae. aegypti and Ae. albopictus were dried at room temperature () and stored in a ziplock bag. Egg samples from both mosquito species were not older than 2 months to prevent deformation. The eggs were validated by individual rearing process until they become adult mosquitoes. When the mosquito had become an adult, the validation was done by observing the thorax of the mosquito. From 128 samples each of species’ egg and 16 days of rearing process, 68 and 74 samples of Ae. aegypti and Ae. albopictus had become adult mosquitoes. This process yielded validated samples of 68 Ae. aegypti (100%), 72 Ae. albopictus (97.3%) and 2 unidentified mosquitoes (2.7%).
A smartphone camera-based image data acquisition system was designed to collect image data. The smartphone used to capture images was iPhone 7 with camera resolution of up to 12 MP and a focal length of 28 mm. To bring the camera’s focal point closer, an Apexel APL-HD5M macro lens extension was used. With the extension of the macro lens, the minimum focus distance from the phone camera became , and 10 times magnification was obtained. The phone was placed on a phone holder and positioned facing perpendicularly to the base. The eggs were then individually placed at the distance of the closest focal point just below the camera on a transparent surface with filter paper and the image data was taken. Images data was taken with a digital zoom of 2.5 times. Furthermore, a light source was given from below as in32, 33. This was done to avoid shadows from the egg and, therefore, clear individual egg shape was obtained. Overall, the image acquisition system is shown in Fig. 1. The egg image data set are then manually cropped so that it is in a square form and the eggs are positioned with a uniform orientation with the posterior end is at the top of the image. An example of a cropped egg image data sample is shown in Fig. 2b,c.
Figure 1.
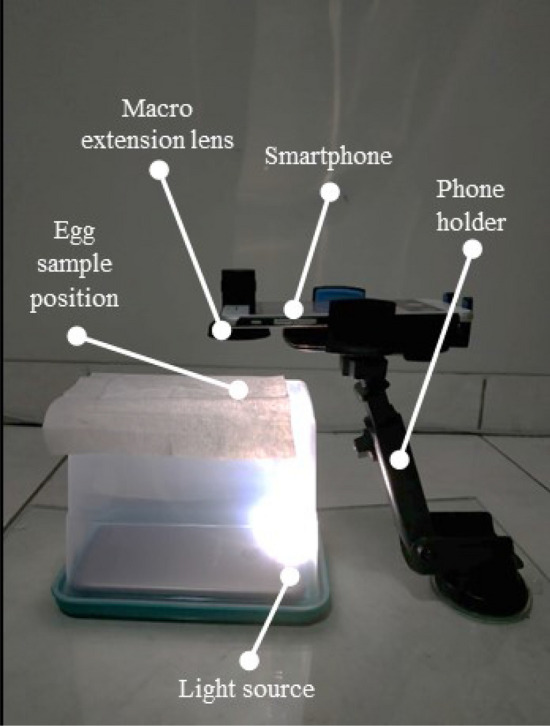
Low-cost image acquisition system design.
Figure 2.

(a) Original, (b) cropped image of Ae. aegypti, and (c) Ae. albopictus.
Image processing
This section presents the image processing method to obtain the contours of the collected egg images. This image processing began with resizing the resolution of the image up to 5 times of its initial size. This was done to make the eggs contours become smoother and more appropriate. The resizing process was done by up-sampling the image resolution with an interpolation method. Next, segmentation in the HSV color space was carried out. When the segmented binary image had been obtained, the morphological opening operation was performed to remove small pixels outside the egg object and to smooth the contours of the segmented egg's silhouette. An example of a binary image of this segmentation process is shown in Fig. 4a. Then to get information about the shape of the egg from the binary image, the Canny edge detection37 was used. Based on the resulting edge outline as shown in Fig. 5b, the egg contours could be extracted. Although every egg object in the image had been positioned uniformly, some eggs do not yet have the same orientation angle as shown in Fig. 4c. Therefore, it is necessary to measure the deviation of the egg contour and correct them. The overall steps performed in this image processing are described in the flowchart in Fig. 3.
Figure 4.

(a) Binary image of segmentation process, (b) Canny edge detection result, (c) measured orientation deviation, (d) corrected orientation contour.
Figure 5.
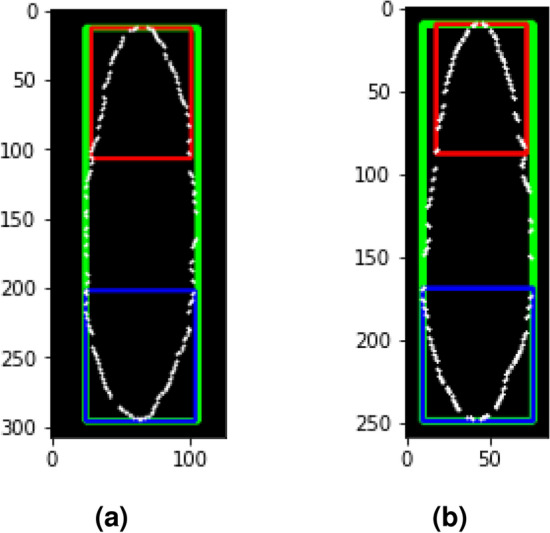
(a) Egg’s dimensions measurement of Ae. aegypti and (b) Ae. albopictus. Green box measures length and width of the egg. Red box measures width at 1/3 posterior end. Blue box measures width at 1/3 anterior end.
Figure 3.
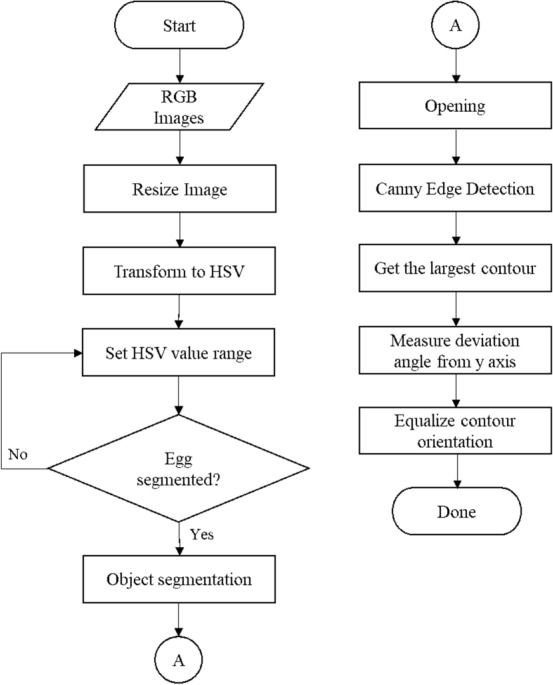
Image processing flowchart.
This image processing was done using the OpenCV library38 and programmed in Python 3.7.3. The result of this stage was the egg contour points with uniform orientation as shown in Fig. 4d. This was done to ensure that each egg contour can be compared and then to measure the dimensions of the eggs.
Egg’s dimensions measurement
The measurement of egg dimensions was carried out based on the egg's contour points. From the contour points, the dimensions of the egg in the image can be measured in pixels. To convert the dimensions from pixels to actual units, a length scale of known size was used. The scale used was the length of the label paper in the image data before the cropping process as shown in Fig. 2a. A total of 20 label papers were measured using a vernier caliper with an accuracy of 0.05 mm and an average reference length of 8.97 mm was obtained. Based on this value, the length of a pixel in millimeters can be calculated using the ratio of the reference length in millimeters to the reference length in pixels defined by following,
| 1 |
where is the reference length in millimeters and is the reference length in pixels. By multiplying the value with the egg dimensions measured in pixels in the image, the egg dimensions in millimeters can be calculated.
The dimensions of the eggs measured in this paper correspond to17 and are shown in the Fig. 5. The dimensions included the length of the egg from the anterior end to the posterior end (length of the green square), the widest part of the egg (width of the green box), the widest part at the anterior 1/3 end (width of the blue box) and the widest part at the 1/3 posterior end (width of the red box), and the ratio between egg length and width. A t-test with a significance level () of 5% was performed to see the significance of the differences in the dimensions of Ae. aegypti and Ae. albopictus. The measurement and statistical test were conducted to compare and confirm the proposed method with morphometrics results of previous studies14, 16–19.
Elliptic fourier analysis
Elliptic Fourier Analysis (EFA) works by representing the egg contour into a chain code , where k is the number of egg contour points. When each contour point has been encoded, the chain code is repeated so that it can be approximated by a Fourier series. The Fourier series representation of the contours for the x and y projections is defined as39
| 2 |
| 3 |
where and are the DC components of the Fourier series and n is the number of harmonics used to produce contour approximations. T is the period of the chain code or the time required to traverse all contour points. The Fourier coefficients , , , and for the x and y projections are then defined by following39
| 4 |
| 5 |
| 6 |
| 7 |
where is the time required to traverse the link p of the two contour points. and are the spatial changes in the x and y projections of the p-th link of the chain code. Each harmonic has 4 coefficients , , , and , yielding Elliptic Fourier (EF) coefficients. Referring to39, 3 EF coefficients of the first harmonic are used to normalize the overall EF coefficients, so that the number of normalized EF coefficients is reduced to . This normalization process makes the EF coefficient to be invariant to the rotation, size, and starting point of the contour. Table 1 shows the example of normalized EF coefficients of one egg contour. EFD feature extraction in this study was carried out using pyEFD library40.
Table 1.
Example of normalized EF coefficients of egg contour.
| Harmonic | ||||
|---|---|---|---|---|
| 1 | 1.000000 | − 2.7E−17 | − 7.5E−17 | − 0.3645 |
| 2 | 0.002165 | − 0.00081 | − 0.00161 | 0.021941 |
| 3 | 0.097114 | 0.000348 | − 0.00704 | − 0.0431 |
| 4 | 0.002283 | 0.001855 | − 0.00417 | 0.00468 |
| 5 | 0.031059 | 0.000585 | − 0.00035 | − 0.01095 |
| 6 | 0.003075 | 0.000142 | − 0.00222 | 0.001503 |
| 7 | 0.014326 | 0.000958 | − 0.00163 | − 0.00712 |
| 8 | 0.002306 | 0.001175 | − 0.0005 | − 0.00151 |
| 9 | 0.007903 | 0.001297 | 0.000414 | − 0.00373 |
| 10 | − 3.1E−05 | 0.001209 | − 0.00144 | − 0.00193 |
Furthermore, Principal Component Analysis (PCA) was carried out on the EF coefficients data set. PCA is widely used to reduce the dimensions of a data set that has a large number of variables and is correlated with each other while maintaining as much variance as possible in the data set. This can be done by reexpressing the data set into a new subspace using a transformation matrix called the principal component (PC). The resulting new variables or PCs have been sorted so that the first few PCs contain most of the variance of all the original variables. Since PCA in this study is used to reduce dimensions, so that an analysis is needed to select the number of PCs to be used. The analysis on the selection of the number of PCs was carried out based on statistical tests and Wilk’s Lambda41.
Classification
The use of the Linear Discriminant Analysis (LDA) algorithm in this study was based on previous studies30, 31, 35, 36. The classification process began by randomly selecting 20 samples of each species from the data set so that as many as 40 samples of test data are obtained that will be used to evaluate the performance of the model. The remainder of the data set was then used to train the model with a total of 48 and 52 samples for Ae. aegypti and Ae. albopictus, respectively. Ae. aegypti eggs are labeled by 0 and Ae. albopictus eggs are labeled by 1.
In its place, common machine learning algorithms such as Random Forest (RF), Support Vector Machine (SVM), and k-Nearest Neighbors (KNN) were also used. Alternative algorithm training was carried out with hyperparameter tuning to get the optimal model using Random Search with k-fold cross-validation42. The k value used for cross-validation is 10. The selection of alternative algorithms and hyperparameter configurations for tuning at this stage is carried out based on43 as shown in Table 3. Furthermore, to evaluate each model, a confusion matrix is used as shown in Table 2, where TN, TP, FP, and FN are True Negative, True Positive, False Positive, and False Negative, respectively. Performance metrics used in this study are accuracy and F1-score which can be calculated by the following equation
| 8 |
| 9 |
| 10 |
| 11 |
Table 3.
Alternative algorithms and hyperparameter configuration.
| Alternative | Hyperparameter | Types | Search |
|---|---|---|---|
| Algorithms | Space | ||
| LDA | solver | Categorical | [’lsqr’, ’eigen’] |
| shrinkage | Continuous | [0, 1] | |
| RF | n_estimator | Discrete | [10, 100] |
| max_depth | Discrete | [5, 50] | |
| min_samples_split | Discrete | [2, 11] | |
| min_samples_leaf | Discrete | [1, 11] | |
| criterion | Categorical | [’gini’, ’entropy’] | |
| max_features | Discrete | [1, 64] | |
| SVM | C | Continuous | [0.1, 50] |
| kernel | Categorical | [’linear’, ’poly’, ’rbf’, ’sigmoid’] | |
| KNN | n_neighbords | Discrete | [1, 20] |
Table 2.
Confusion matrix for model evaluation.
| Predicted | |||
|---|---|---|---|
| Ae. aegypti | Ae. albopictus | ||
| Actual | Ae. aegypti | TN | FP |
| Ae. albopictus | FN | TP | |
Results and discussions
Egg’s dimensions
Based on the dimension measurements and t-test carried out in this study, Ae. aegypti eggs were significantly longer than Ae. albopictus’ (p value ), similar with results reported by16–18. In this study, Ae. aegypti eggs were also significantly wider (p value ) similar to17, but not narrower as reported by16. The widths at the anterior 1/3 end and 1/3 posterior end of the two species’ eggs were also significantly different (p value ), which is also similar to that reported by17. However, the ratio of length and width was not significantly different (p value = 0.542) as the results obtained in17. All the measurement results are in mean ± standard deviation millimeters as shown in the Table 4. This measurement process was carried out using OpenCV library and t-test using stats library in Python 3.7.3.
Table 4.
Comparison of Ae. aegypti and Ae. albopictus eggs’ dimensions.
| Attributes | Ae. aegypti | Ae. albopictus | p value |
|---|---|---|---|
| Egg length | < 0.000 | ||
| Egg width | < 0.000 | ||
| Egg width at 1/3 ant. end | < 0.000 | ||
| Egg width at 1/3 post. end | < 0.000 | ||
| Egg length and width ratio | 0.542 |
The developed method results in the ratio of the mean of egg length and width 1.0057 compared to 1.0118 in17. The difference of the new result is 0.6028% to the previous result. The difference is very small, it indicates that the image-based method for dimension identification is comparable with the result using SEM.
Dimensionality reduction
The analysis began with performing PCA to the EF coefficient data set. PCA transforms the EF coefficient into a feature space with 37 new uncorrelated variables called PC1 to PC37. Based on the PC values, a statistical analysis called Multivariate Analysis of Variance (MANOVA) was performed to see how significant the difference between the two types of eggs was. MANOVA is a hypothesis testing method that compares the average data for each class that has 2 or more variables. The statistical test conducted in this study was carried out using IBM SPSS Statistic v.26 software with a significance level () of 5%.
Before MANOVA can be performed, there are ideal assumptions that must be met. Namely, each variable in each class must be normally distributed (normality) and the population covariance matrices must be equal (homogeneity).
From the results of the Kolmogorov-Smirnov normality test, it is known that all PCs are normally distributed, except PC11 and PC37. Therefore, it can be concluded that all PCs meet the assumption of normality except PC11 and PC37. In the homogeneity test using Box’s M, it is known that the assumption of homogeneity is only met when the first 2 PCs, the first 3 PCs, or the first 4 PCs are used. Based on the two ideal assumption tests, the MANOVA test was only carried out using only the first 2, 3, and 4 PCs. Table 5 displays the results of the MANOVA test on n first PCs. The results yielded p value for all options. This indicates that there is a significant difference in the two types of eggs based on the PC value. In41, it is stated that the WL value has an effect on misclassification and can be used as a feature selection method. In general, the smaller the WL value is associated with the better classification results. By considering WL value from the MANOVA test results, in this study the first 3 PCs were used because the first 4 PCs did not get a smaller WL value. By using the first 3 PCs, a visualization of data distribution of Ae. aegypti and Ae. albopictus eggs in PC feature space can be generated as shown in the Fig. 6. Data points distribution of two vectors’ eggs are overlapping at a certain region due to the shape similarity of both eggs.
Table 5.
MANOVA results of n first PCs.
| n first PC | Wilk’s lambda | p value | decision |
|---|---|---|---|
| 2 | 0.716 | Rejected | |
| 3 | 0.411 | Rejected | |
| 4 | 0.411 | Rejected |
Figure 6.
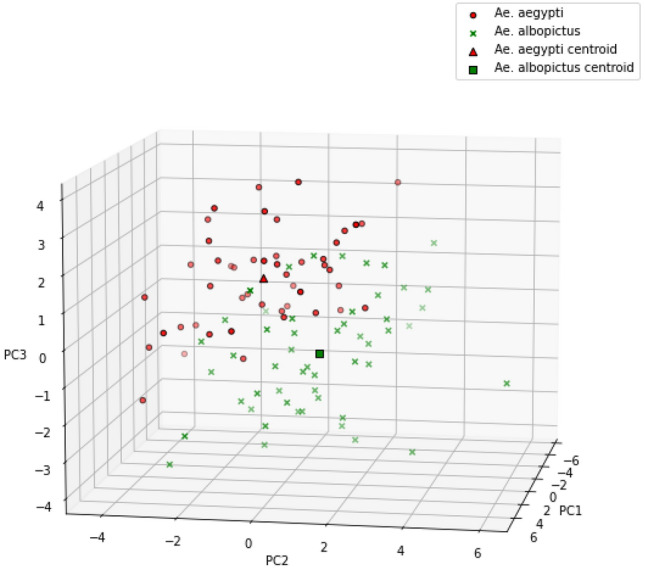
Ae. aegypti and Ae. albopictus data points in PC feature space.
Egg’s shape contour analysis
Reconstruction of the average contour is done by calculating the average value of the EF coefficient of each class and visualization is obtained as shown in Fig. 7. Normalization of the EF coefficient of EFD produces a contour with the position of the anterior end of the egg on the left side and the posterior end of the egg on the right side. Normalization of the EF coefficient also makes the contours have the same length so that variations in differences can only be observed in the direction of the y-axis or egg width.
Figure 7.

Comparison of average Ae. aegypti and Ae. albopictus egg contours.
The average contour of the eggs of Ae. aegypti is generally cigar-shaped with the widest part at the 1/3 anterior end, tends to be straight at 1/3 middle, and tapered at 1/3 posterior end. The average contour of the eggs of Ae. albopictus is generally cigar-shaped with the widest part at 1/3 anterior end and tapering directly from 1/3 middle towards the posterior end. This description of egg shape is similar to that described by16 regarding the general shape of the eggs of Ae. aegypti and Ae. albopictus.
To be able to find out the location of the variations in the shape, contour reconstruction was carried out based on each PC. This process was done by performing an inverse transform using the PC scores vector and certain eigenvectors so that the EF reconstruction coefficient values are obtained. From the EF coefficients, the average and standard deviation were calculated and the EFD inverse transform was carried out so the contour coordinates were recovered to be visualized. The results of the reconstruction of PC1, PC2, and PC3 are shown in Fig. 8.
Figure 8.

(a) Shape variation of PC1, (b) shape variation of PC2, and (c) shape variation of PC3.
As shown in Fig. 8, PC1 corresponds to the curved direction of the egg. The positive value of PC1 makes the egg contour slightly curved upwards, while the negative value makes the egg contour slightly curved downwards. PC2 corresponds to the shape of the egg at the anterior and posterior end. The values in the positive direction makes the width at the end of the egg wider. While the value in the negative direction makes the width smaller. PC3 corresponds to the shape of the egg at the anterior end and especially the middle to the posterior end. The values in the positive direction makes the egg more tapered at the middle to posterior end. While the value in the negative direction makes the middle to posterior less taper.
Based on the results of statistical analysis and contour reconstruction, the results are in accordance with previous studies which stated that Ae. albopictus eggs were more tapered at the posterior end16–18.
Figure 9.
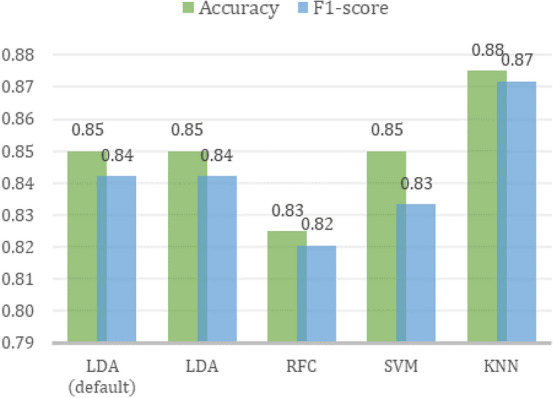
Comparison of optimal models’ performance on test data.
Classification
LDA classification with default hyperparameters was used as a baseline for the comparison of model performance. The classification evaluation process at this stage was carried out by training the LDA model using train data and then evaluating it with test data. The performance of the baseline model on the test data is shown in the Table 6. By using Eqs. (8), (9), (10), and (11) the accuracy and score could be calculated as 0.85 and 0.84, respectively.
Table 6.
LDA default confusion matrix on test data.
| Predicted | |||
|---|---|---|---|
| Ae. aegypti | Ae. albopictus | ||
| Actual | Ae. aegypti | 18 | 2 |
| Ae. albopictus | 4 | 16 | |
Significant values are in bold.
The hyperparameter tuning of LDA and classification using alternative algorithms and k-fold cross-validation as described in “Classification” section yielded classification results as shown in Fig. 10. The hyperparameter tuning of the LDA algorithm did not yield better performance. As shown in Fig. 7, the data distribution of Ae. aegypti and Ae. albopictus in the PC feature space is not completely linearly separated due to similarity of the two species’ eggs. Since the LDA algorithm classifies the data using a linear equation, poor performance is obtained on class data that are not linearly separated in their feature space. Linearity itself is one of the shortcomings of LDA44.
Figure 10.

Test data in decision boundaries of optimal (a) LDA, (b) RF, (c) SVM, and (d) KNN model.
The decision boundary generated from the training data of each algorithm is shown in the Fig. 10. The red region is Ae. aegypti class area and the green region is Ae. albopictus class area in the PC feature space. LDA produces a linear hyperplane while RF, SVM, and KNN produce a nonlinear hyperplane. Although the three alternative algorithms are all nonlinear classifiers, the best classification performance was obtained using the KNN algorithm with an accuracy of 0.88 and an score of 0.87 on the test data. This result shows promising results for initial research of automatic identification of Ae. aegypti and Ae. albopictus eggs, since there are currently no studies regarding these two species’ eggs classification. It also implies that the use of nonlinear classifier was able to improve the classification performance of this method, instead of only using LDA30, 31, 35, 36.
Compared to SVM, KNN is known to have better performance when the amount of training data is more than the number of variables or features. Whereas SVM generally works well on datasets with many features45. On the other hand, although RF works well with small datasets, it tends to be very sensitive to changes in datasets and the number of features. It makes RF easily overfit and affects the classification performance46. The classification process in this study used 100 egg data with a much smaller number of features, namely the values of PC1, PC2, and PC3. This nature of the dataset made KNN outperforms the other classifier algorithms and yields a higher classification result.
Limitations and further developments
The proposed method yielded promising results for initial research on the automatic identification of Ae. aegypti and Ae. albopictus’ eggs. However, there are several limitations and further developments regarding this study which we will discuss in this section.
The main limitation of this study is the limited species of interest. This study only focused on Ae. aegypti and Ae. albopictus which will not be applicable beyond the analyzed species. Additional species are essential for further studies, since there may be a percentage of other species in real-field ovitrap-based settings. Egg’s condition classification will also be very helpful in this context, for example by adding a classification model to differentiate between egg objects and non-egg objects before the species identification process.
This study was also conducted in a laboratory-conditioned setting, where the eggs are selected, observed, captured, and validated individually. This leads to a non-practical application of the proposed methods since there are a lot of variety in real-field settings. Fortunately, we covered the variety of egg sizes where the egg contour was normalized as discussed in the previous section.
Other image processing methods will also be very important for further development to overcome the non-practical limitation of this study. One possible improvement is by adding an overlapping-object separation method in the image processing stage. This is due to the real condition in ovitraps-collected eggs in which they are often found to be clustered and overlap each other. Moreover, using a higher-resolution camera will also be very advantageous for further studies.
Conclusions
This paper proposed the method to automatically identify Ae. aegypti and Ae. albopictus eggs based on digital images using a smartphone. From all the results, the proposed method confirmed that the egg dimensions of Ae. aegypti and Ae. albopictus and the shape at the posterior end differs significantly (p value ) similar to as mentioned in previous studies. The classification based on first 3 PC using KNN yielded an accuracy and F1-score of 0.88 and 0.87, respectively. This provides the possibility of automatic egg identification based on digital images.
By combining the proposed method with an overlapping-objects separation method at the image processing stage, the real implementation can be done with few adjustments. This can help epidemiologists to identify the two eggs more efficiently without having to carry out observations in a time-consuming conventional way. This digital image-based automatic identification can also assist authorized officials in monitoring and making decisions in developing vector control strategies.
Acknowledgements
This work was supported by Innovative-Productive Research Invitation-RISPRO, KEP. 52/LPDP/2019, Ministry of Finance, 2020-2023, Indonesia.
Author contributions
N.P.G. and E.J. wrote the main manuscript text E.J. and I.A. prepared the conseptualization N.P.G. and E.J. conducted the methodology N.P.G. and I.A. prepared the experiments E.J. and I.A. provided validation I.A. provided supervision All authors reviewed the manuscript E.J. conducted funding aquisition.
Competing interests
The authors declare no competing interests.
Footnotes
Publisher's note
Springer Nature remains neutral with regard to jurisdictional claims in published maps and institutional affiliations.
References
- 1.Das, B., Ghosal, S. & Mohanty, S. Aedes: What do we know about them and what can they transmit? In Vectors and Vector-Borne Zoonotic Diseases (IntechOpen, 2018).
- 2.Lwande OW, et al. Globe-trotting aedes aegypti and aedes albopictus: Risk factors for arbovirus pandemics. Vector-Borne Zoonotic Dis. 2020;20:71–81. doi: 10.1089/vbz.2019.2486. [DOI] [PMC free article] [PubMed] [Google Scholar]
- 3.Bhatt S, et al. The global distribution and burden of dengue. Nature. 2013;496:504–507. doi: 10.1038/nature12060. [DOI] [PMC free article] [PubMed] [Google Scholar]
- 4.Buhler C, Winkler V, Runge-Ranzinger S, Boyce R, Horstick O. Environmental methods for dengue vector control-a systematic review and meta-analysis. PLoS Negl. Trop. Dis. 2019;13:e0007420. doi: 10.1371/journal.pntd.0007420. [DOI] [PMC free article] [PubMed] [Google Scholar]
- 5.Sasmita HI, et al. Ovitrap surveillance of dengue vector mosquitoes in bandung city, west java province, indonesia. PLoS Negl. Trop. Dis. 2021;15:e0009896. doi: 10.1371/journal.pntd.0009896. [DOI] [PMC free article] [PubMed] [Google Scholar]
- 6.Rossi Da Silva K, et al. New traps for the capture of aedes aegypti (linnaeus) and aedes albopictus (skuse)(diptera: Culicidae) eggs and adults. PLoS Negl. Trop. Dis. 2021;15:e0008813. doi: 10.1371/journal.pntd.0008813. [DOI] [PMC free article] [PubMed] [Google Scholar]
- 7.Qiu YT, Spitzen J, Smallegange RC, Knols BG. Emerging Pests and Vector-Borne Diseases in Europe. Wageningen, Netherlands: Wageningen Academic Publishers; 2007. Monitoring systems for adult insect pests and disease vectors; pp. 329–352. [Google Scholar]
- 8.Steffler LM, Marteis LS, Dolabella SS, Cavalcanti SCDH, Santos RLCD. Risk of dengue occurrence based on the capture of gravid aedes aegypti females using mosquiTRAP. Mem. Inst. Oswaldo Cruz. 2011;106:365–367. doi: 10.1590/S0074-02762011000300018. [DOI] [PubMed] [Google Scholar]
- 9.Rakotoarivony LM, Schaffner F. ECDC guidelines for the surveillance of invasive mosquitoes in Europe. Eurosurveillance. 2012;17:20265. [PubMed] [Google Scholar]
- 10.Bowman LR, Runge-Ranzinger S, McCall P. Assessing the relationship between vector indices and dengue transmission: A systematic review of the evidence. PLoS Negl. Trop. Dis. 2014;8:e2848. doi: 10.1371/journal.pntd.0002848. [DOI] [PMC free article] [PubMed] [Google Scholar]
- 11.Manica M, Rosa R, Torre AD, Caputo B. From eggs to bites: do ovitrap data provide reliable estimates of aedes albopictus biting females? PeerJ. 2017;5:e2998. doi: 10.7717/peerj.2998. [DOI] [PMC free article] [PubMed] [Google Scholar]
- 12.Gao Q, et al. Field evaluation of Mosq-ovitrap, ovitrap and a co-light trap for aedes albopictus sampling in Shanghai. China. PeerJ. 2019;7:e8031. doi: 10.7717/peerj.8031. [DOI] [PMC free article] [PubMed] [Google Scholar]
- 13.Matsuo K, Yoshida Y, Kunou I. Scanning electron microscopy of mosquitoes. I. the egg surface of five species of Aedes and Armigeres subalbatus. J. Kyoto Pref. Univ. Med. H. 1972;358:363. [Google Scholar]
- 14.Matsuo K, Yoshida Y, Lien JC. Scanning electron microscopy of mosquitoes: Ii. The egg surface structure of 13 species of aedes from Taiwan. J. Med. Entomol. 1974;11:179–188. doi: 10.1093/jmedent/11.2.179. [DOI] [PubMed] [Google Scholar]
- 15.Faull KJ, Williams CR. Differentiation of aedes aegypti and aedes notoscriptus (diptera: Culicidae) eggs using scanning electron microscopy. Arthropod Struct. Dev. 2016;45:273–280. doi: 10.1016/j.asd.2016.01.009. [DOI] [PubMed] [Google Scholar]
- 16.Linley JR. Comparative fine structure of the eggs of aedes albopictus, ae. aegypti, and ae, bahamensis (diptera: Culicidae) J. Med. Entomol. 1989;26:510–521. doi: 10.1093/jmedent/26.6.510. [DOI] [PubMed] [Google Scholar]
- 17.Suman DS, Shrivastava AR, Pant S, Parashar BD. Differentiation of aedes aegypti and aedes albopictus (diptera: Culicidae) with egg surface morphology and morphometrics using scanning electron microscopy. Arthropod Struct. Dev. 2011;40:479–483. doi: 10.1016/j.asd.2011.04.003. [DOI] [PubMed] [Google Scholar]
- 18.Bova J, Paulson S, Paulson G. Morphological differentiation of the eggs of north American container-inhabiting aedes mosquitoes. J. Am. Mosq. Control Assoc. 2016;32:244–246. doi: 10.2987/15-6535.1. [DOI] [PubMed] [Google Scholar]
- 19.de Morais LMO, Jussiani EI, Zequi JAC, Dos Reis PJ, Andrello AC. Morphological study of aedes aegypti and aedes albopictus (diptera: Culicidae) eggs by x-ray computed microtomography. Micron. 2019;126:102734. doi: 10.1016/j.micron.2019.102734. [DOI] [PubMed] [Google Scholar]
- 20.Arista-Jalife A, et al. Aedes mosquito detection in its larval stage using deep neural networks. Knowl.-Based Syst. 2020;189:104841. doi: 10.1016/j.knosys.2019.07.012. [DOI] [Google Scholar]
- 21.Minakshi, M. et al. Automating the surveillance of mosquito vectors from trapped specimens using computer vision techniques. In Proceedings of the 3rd ACM SIGCAS Conference on Computing and Sustainable Societies, 105–115 (2020).
- 22.Motta D, et al. Optimization of convolutional neural network hyperparameters for automatic classification of adult mosquitoes. PLoS ONE. 2020;15:e0234959. doi: 10.1371/journal.pone.0234959. [DOI] [PMC free article] [PubMed] [Google Scholar]
- 23.Neto, A. A. et al. Identification of the aedes aegypti/albopictus mosquito using digital image processing techniques. In 2020 IEEE 5th International Conference on Signal and Image Processing (ICSIP), 518–523 (IEEE, 2020).
- 24.De Silva, W. & Jayalal, S. Dengue mosquito larvae identification using digital images. In 2020 International Research Conference on Smart Computing and Systems Engineering (SCSE), 31–36 (IEEE, 2020).
- 25.Gaburro J, Duchemin J-B, Paradkar PN, Nahavandi S, Bhatti A. Assessment of icount software, a precise and fast egg counting tool for the mosquito vector aedes aegypti. Parasites Vectors. 2016;9:1–9. doi: 10.1186/s13071-016-1870-1. [DOI] [PMC free article] [PubMed] [Google Scholar]
- 26.Wan Yussof, W. N. J. H. et al. Wavelet-based auto-counting tool of aedes eggs. In Proceedings of the 2018 International Conference on Sensors, Signal and Image Processing, 56–59 (2018).
- 27.Bandong, S. & Joelianto, E. Counting of aedes aegypti eggs using image processing with grid search parameter optimization. In 2019 International Conference on Sustainable Engineering and Creative Computing (ICSECC), 293–298 (IEEE, 2019).
- 28.Garcia, P. S. C., Martins, R., Coelho, G. L. L. M. & Cámara-Chávez, G. Acquisition of digital images and identification of aedes aegypti mosquito eggs using classification and deep learning. In 2019 32nd SIBGRAPI Conference on Graphics, Patterns and Images (SIBGRAPI), 47–53 (IEEE, 2019).
- 29.Joshi A, Miller C. Review of machine learning techniques for mosquito control in urban environments. Ecol. Inform. 2021;61:101241. doi: 10.1016/j.ecoinf.2021.101241. [DOI] [Google Scholar]
- 30.Gentallan RP, et al. An objective method of shape descriptor state establishment using elliptic Fourier analysis (efa) Plant Genetic Res. 2019;17:480–487. doi: 10.1017/S1479262119000285. [DOI] [Google Scholar]
- 31.Demir B, Sayinci B, Çetin N, Yaman M, Çömlek R. Shape discrimination of almond cultivars by elliptic Fourier descriptors. Erwerbs-obstbau. 2019;61:245–256. doi: 10.1007/s10341-019-00423-7. [DOI] [Google Scholar]
- 32.Bodor P, Somogyi E, Baranyai L, Lázár J, Bálo B. Analysis of the grapevine (vitis vinifera l) berry shape by using elliptic Fourier descriptors. Prog. Agric. Eng. Sci. 2020;16:87–93. [Google Scholar]
- 33.Kupe M, et al. Morphological characteristics of grapevine cultivars and closed contour analysis with elliptic Fourier descriptors. Plants. 2021;10:1350. doi: 10.3390/plants10071350. [DOI] [PMC free article] [PubMed] [Google Scholar]
- 34.Santillán-Guayasamín S, Villacís AG, Grijalva MJ, Dujardin J-P. The modern morphometric approach to identify eggs of triatominae. Parasites Vectors. 2017;10:1–10. doi: 10.1186/s13071-017-1982-2. [DOI] [PMC free article] [PubMed] [Google Scholar]
- 35.Cruz DD, Arellano E, Denis Ávila D, Ibarra-Cerdeña CN. Identifying chagas disease vectors using elliptic Fourier descriptors of body contour: A case for the cryptic dimidiata complex. Parasites Vectors. 2020;13:1–12. doi: 10.1186/s13071-020-04202-2. [DOI] [PMC free article] [PubMed] [Google Scholar]
- 36.da Silva Ferreira FA, et al. Scanning electron microscopy and geometric contour morphometry for identifying eggs of three amazonian species of mansonia (diptera: Culicidae) J. Med. Entomol. 2020;57:745–754. doi: 10.1093/jme/tjz240. [DOI] [PubMed] [Google Scholar]
- 37.Canny, J. A computational approach to edge detection. IEEE Trans. Pattern Anal. Mach. Intell. 679–698 (1986). [PubMed]
- 38.Bradski G. The opencv library. Dr. Dobb’s J. Softw. Tools Prof. Program. 2000;25:120–123. [Google Scholar]
- 39.Kuhl FP, Giardina CR. Elliptic Fourier features of a closed contour. Comput. Graphics Image Process. 1982;18:236–258. doi: 10.1016/0146-664X(82)90034-X. [DOI] [Google Scholar]
- 40.Blidh, H. PyEFD Documentation (2016).
- 41.El Ouardighi, A., El Akadi, A. & Aboutajdine, D. Feature selection on supervised classification using wilks lambda statistic. In 2007 International Symposium on Computational Intelligence and Intelligent Informatics, 51–55 (IEEE, 2007).
- 42.Refaeilzadeh P, Tang L, Liu H. Cross-validation. Encycl. Database Syst. 2009;5:532–538. doi: 10.1007/978-0-387-39940-9_565. [DOI] [Google Scholar]
- 43.Yang L, Shami A. On hyperparameter optimization of machine learning algorithms: Theory and practice. Neurocomputing. 2020;415:295–316. doi: 10.1016/j.neucom.2020.07.061. [DOI] [Google Scholar]
- 44.Tharwat A, Gaber T, Ibrahim A, Hassanien AE. Linear discriminant analysis: A detailed tutorial. AI Commun. 2017;30:169–190. doi: 10.3233/AIC-170729. [DOI] [Google Scholar]
- 45.Bzdok D, Krzywinski M, Altman N. Machine learning: supervised methods. Nat. Methods. 2018;15:5. doi: 10.1038/nmeth.4551. [DOI] [PMC free article] [PubMed] [Google Scholar]
- 46.Boateng EY, Otoo J, Abaye DA. Basic tenets of classification algorithms k-nearest-neighbor, support vector machine, random forest and neural network: A review. J. Data Anal. Inf. Process. 2020;8:341–357. [Google Scholar]