Abstract
The inhibitory activity of a truncated derivative of the natural amphibian skin peptide dermaseptin s3-(1-16)-NH2 [DS s3 (1-16)] against Saccharomyces cerevisiae was studied. Significant growth inhibition was observed after exposure to 3.45 μg of the peptide per ml at pH 6.0 and 7.0, with complete growth inhibition occurring at 8.63 μg of peptide per ml for all pH values tested. Using confocal scanning laser microscopy, we have shown that DS s3 (1-16) disrupted the yeast cell membrane resulting in the gross permeabilization of the cell to the nuclear stain ethidium bromide. However, the principal inhibitory action of the peptide was not due to disruption of intracellular pH homeostasis. Instead, growth inhibition by the peptide correlated with the efflux of important cellular constituents such as ADP, ATP, RNA, and DNA into the surrounding medium. The combination of DS s3 (1-16) with mild heating temperatures as low as 35°C significantly enhanced the inhibitory effect of the peptide (8.63 μg/ml), and at 45°C greater than 99% of the population was killed in 10 min. In summary, a derivative of a natural antimicrobial peptide has potential, either alone or in combination with mild heating, to prevent the growth of or kill spoilage yeast.
Antimicrobial peptides are found throughout nature and have been isolated from bacteria, insects, plants, frogs, and mammals (1, 2, 5, 13, 26). Possibly the best-characterized group of antimicrobial peptides come from amphibian skin and were recently reviewed by Barra and Simmaco (2). The most commonly studied amphibian peptides consist of the bombinins, from the European toad Bombina variegata (14); the magainins, from the African clawed frog Xenopus laevis (18, 28); and the dermaseptins, from the South American arboreal frog Phyllomedusa sauvagii (19).
These amphibian peptides have four common features: they are small, linear peptides approximately 23 to 34 residues in length; they are cationic due to a high content of lysine and arginine residues which are positively charged at neutral pH; they form characteristic α-helices upon association with lipid bilayers; and they are amphipathic molecules with a hydrophobic face comprising nonpolar amino acid side chains and a hydrophilic face of polar, positively charged amino acids. Despite these similarities, each of the amphibian peptides has very different levels of activity against gram-negative and gram-positive bacteria, yeasts, molds, and protozoa (2, 19, 20, 28). Importantly, most of the naturally occurring antimicrobial peptides from amphibian skin have little or no hemolytic activity against mammalian cells at concentrations that effectively inhibit microbial growth (19, 20, 28).
The dermaseptins are a family of five highly related peptides, s1 to s5, that share a high level of sequence similarity with dermaseptin s1 (53 to 94% amino acid positional identity), vary in length from 28 to 34 residues, are lysine rich, and form typical amphipathic α-helical structures (21). The dermaseptins are unique among the antibacterial peptides because, in addition to having potent activity against bacteria, protozoa, and yeasts, they are also very active against filamentous fungi (19, 20). Although the five peptides have similar antimicrobial spectra, their relative potencies against certain organisms do vary (20), and there is dramatic antimicrobial synergy if the dermaseptins are applied together in combination (20). Thus, it has been suggested that the physiological significance of whole families of related peptides on amphibian skin is to provide a broader spectrum of activity against invading microorganisms (22).
Generally, it is believed that cationic peptides form channels in the cytoplasmic membrane (15). The positively charged residues of the peptide interact with the negatively charged cell membrane, and upon insertion into this hydrophobic environment the peptide forms a characteristic α-helical structure. During this process the electrical potential across the cytoplasmic membrane results in the peptides undergoing a transition into an aggregated and structured form with their hydrophobic faces directed toward the membrane lipids and their hydrophilic faces facing inward to form an aqueous channel or pore (15–17). The formation of this channel leads to the loss of membrane function and enhanced permeability such that the capacity of the organism to maintain homeostasis is lost and growth is inhibited or the cell dies. However, with regard to microorganisms, there is little evidence in the literature to support this model or to explain the inhibitory mechanisms of these peptides in terms of cellular physiology.
In the work described here we studied the effects on Saccharomyces cerevisiae of exposure to a COOH-terminally truncated derivative of dermaseptin s3, dermaseptin s3-(1-16)-NH2 [DS s3 (1-16)] (20), in order to understand the physiological basis of the potent antifungal activity of this compound.
MATERIALS AND METHODS
Organism.
The S. cerevisiae strain used in this study was X2180-1A (MATa); the strain was originally from the Yeast Genetic Stock Centre. The strain was maintained on YEPD (2% [wt/vol] glucose [BDH], 2% [wt/vol] yeast extract [BetaLab], 1% [wt/vol] Bacto Peptone [Difco]) agar plates.
Chemicals.
DS s3 (1-16) was synthesized on the basis of the amino acid sequence of Mor et al. (20) and was purchased from Peptide and Protein Research Consultants, Washington Singer Laboratories, University of Exeter, Devon, United Kingdom. The sequence of the truncated derivative compared to those of the parent dermaseptin s3 and dermaseptin s1 is shown in Table 1.
TABLE 1.
Amino acid sequences of dermaseptin peptides
| Peptide | Sequence | Refer- ence |
|---|---|---|
| DS s3 (1-16) | AlaLeuTrpLysAsnMetLeuLysGlyIleuGlyLysLeuAlaGlyLys-NH2 | 11 |
| DS s3 (1-30) | AlaLeuTrpLysAsnMetLeuLysGlyIleuGlyLysLeuAlaGlyLysAlaAlaLeuGlyAlaValLysLysLeuValGlyAlaGluSer-NH2 | 11, 13 |
| DS s1 (1-34) | AlaLeuTrpLysThrMetLeuLysLysLeuGlyThrMetAlaLeuHisAlaGlyLysAlaAlaLeuGlyAlaAlaAlaAspThrIleuSerGlnGlyThrGln-NH2 | 10 |
The homogeneity of the synthesized product was >95% by reverse-phase and cation-exchange high-pressure liquid chromatography, and its molecular weight was confirmed by laser desorption mass spectrometry. The peptide was used from a stock solution of 172.7 μg/ml in phosphate-buffered saline (145 mM NaCl, 6.85 mM Na2HPO4, 2.25 mM Na2H2PO4). For measurement of membrane permeability, ethidium bromide was purchased from Sigma and was used from a working stock solution of 1 mg/ml in sterile distilled water. For determination of the intracellular pH, the fluorescent probe used in this study was 5′(6′)-carboxy fluorescein diacetate succinimidyl ester (CFDA-SE) (Lambda Fluorescence Technologie, Graz, Austria).
Measurement of the inhibitory effect of DS s3 (1-16).
A preculture of S. cerevisiae X2180-1A was grown to the late exponential phase (optical density at 600 nm, 0.8) in YEPD broth at 30°C with shaking. These cells were then harvested, resuspended in fresh YEPD broth to give an optical density at 600 nm of 0.8, and used as the inoculum in subsequent experiments.
Growth in the presence of DS s3 (1-16) was measured turbidometrically with an automated Labsystems Bioscreen (Life Sciences International, Basingstoke, United Kingdom). A number of Bioscreen microtiter plates (100-well honeycomb) (Life Sciences International) were prepared, and each well contained 360 μl of fresh YEPD broth at pH values of 7.0, 6.0, 5.0, 4.0, and 3.0 (adjusted with 1 M HCl and 1 M NaOH). At each of these culture pH values, wells that contained, 0, 0.86, 1.73, 3.45, 8.63, and 17.27 μg of DS s3 (1-16) per ml were also prepared. Following this, 40 μl of the prepared culture (described above) was inoculated into each well on the Bioscreen plates to give a starting inoculum of 5.0 × 10³ cells ml−1. Growth was measured by determining the change in the optical density (600 nm) every hour for 7 days at 30°C with continuous high-intensity shaking. The data generated were then imported into Microsoft Excel software (Microsoft, Seattle, Wash.), and growth curves were generated. To study the effect of inoculum size on the efficacy of the peptide, an experiment similar to that described above was carried out with starting inocula of 5.0 × 10³, 5.0 × 10², and 5.0 × 10 cells ml−1.
The effect of exposure to DS s3 (1-16) on viability was also measured. Late-exponential-phase cells were harvested, resuspended in fresh YEPD broth at pH values of 7.0, 6.0, 5.0, 4.0, and 3.0, and divided into 1-ml aliquots. After taking an initial sample to determine starting cell numbers, 8.63 μg of DS s3 (1-16) per ml was added to each aliquot and the viable count was determined every hour for 7 h. For each time point, a 100-μl sample was removed, resuspended in 2 ml of fresh YEPD broth, serially diluted, and plated in duplicate on YEPD agar. The plates were incubated for 48 h at 30°C before counting.
Viability was also determined after 10 min of exposure to increasing concentrations (0 to 103.62 μg/ml) of DS s3 (1-16) at pH 6.0 and also after exposure to 0, 3.45, and 8.63 μg of the peptide per ml at increasing incubation temperatures (25 to 45°C). The cells were heated in a modified thermocouple block calibrator DB-40L (Techne, Cambridge, United Kingdom) (8).
Measurement of the effect of DS s3 (1-16) on membrane permeability.
Membrane permeability was measured by capturing confocal scanning laser microscopy (CSLM) images of the uptake of the fluorescent nuclear stain ethidium bromide, which is largely excluded by yeast cells with intact plasma membranes (9, 10). In all experiments, late-exponential-phase cells were harvested and resuspended in fresh YEPD broth (pH 6.0). Following this, 10 μg of ethidium bromide per ml was added to 200-μl aliquots of these cells, and this was followed by the addition of different concentrations of DS s3 (1-16). The cells were visualized with a Bio-Rad MRC 600 confocal scanning laser microscope fitted with a 20-mW krypton argon mixed gas laser (Bio-Rad). For high-magnification studies of the effect of DS s3 (1-16) on membrane integrity, the cells were exposed to 12.97 μg of the peptide per ml and a population was visualized over a period of approximately 20 min at 30°C with an objective magnification of ×60 (Nikon ×60 oil 1.4 numerical aperture, Plan Apo objective). Single-channel, epifluorescent images of cells (excitation line, 488 nm) were captured on videotape, and the frames were subsequently enhanced with the Quantimet 570 Image Analysis System (Leica Instruments, Milton Keynes, United Kingdom). To study the effect of exposure to DS s3 (1-16) on overall levels of membrane disruption in populations of cells, a lower-objective magnification of ×20 (Nikon ×20, 0.75 numerical aperture) was used. By capturing low-magnification, single-channel epifluorescent images (up to 200 cells per field of view), it was possible to count the number of fluorescent cells in the population. This method was used to calculate the percentage of fluorescent cells in populations following (i) exposure to increasing concentrations of DS s3 (1-16) (from 0 to 103.62 μg/ml) for 10 min at 30°C and (ii) the percentage of fluorescent cells in a population following exposure to 0, 3.45, and 8.63 μg of the peptide per ml for 10 min at increasing temperatures (from 25 to 45°C). Individual cell aliquots were heated in a modified thermocouple block calibrator DB-40L (Techne) (8).
For each concentration of peptide or temperature tested, at least four random, independent images were captured and the frequency of occurrence of fluorescent or permeabilized cells was calculated. Each datum point represents the mean and standard deviation acquired from the counting of at least 300 cells.
Measurement of the effect of DS s3 (1-16) on the pHi.
S. cerevisiae X2180-1A was grown to the late exponential phase in yeast nitrogen base with amino acids (0.67% [wt/vol]; Difco) and glucose (2% [vol/vol] d-glucose) (Sherman Chemicals) (YNBG) at 30°C with shaking. These cells were then loaded with a 75 μM concentration of the fluorescent probe, CFDA-SE, as described previously (3, 4), except that the cells were loaded over a period of 15 h in 25 mM citric-phosphate buffer (25 mM citric acid, 25 mM sodium dihydrogen orthophosphate, 25 mM potassium hydroxide). Fluorescence determinations were made on a Shimadzu RF-1501 fluorometer (Shimadzu UK, Haverhill, Suffolk, United Kingdom) with a 1.5-ml optically clear quartz cuvette (Hellma; Fisher Scientific UK). All readings followed an excitation scan between 400 and 500 nm, with emission set at 525 nm (bandwidths, 10 nm).
Calibration curves of CFDA-SE cleaved to the fluorescent form, carboxy fluorescein succinimidyl ester (CF-SE), were made in YNBG buffered with 25 mM citric-phosphate buffer and were composed by plotting the ratio of fluorescence intensities (emission wavelength, 525 nm) at excitation wavelengths of 495 (pH-dependent point) and 435 nm (pH-independent point) as a function of pH (3). Intracellular pH (pHi) was calculated from this calibration curve as described previously (3).
To measure the effect of exposure to DS s3 (1-16) on the pHi of growing cells, a culture loaded with CFDA-SE (10 ml with an optical density at 600 nm of approximately 0.8) was harvested and was resuspended in 25 ml of YNBG buffered with 25 mM citric-phosphate buffer at pH 5.0, 5.5, and 6.0 to give a starting optical density at 600 nm of approximately 0.3. The cells were then incubated for 30 min at 30°C to allow recovery from the stress of the probe loading conditions. Following this, cultures were allowed to grow to an optical density at 600 nm of approximately 0.45 before 8.63 or 17.27 μg of peptide per ml was added. The effect on growth and pHi was measured as described previously (3, 4).
Measurement of the effect of DS s3 (1-16) on the intracellular ADP/ATP ratio.
Measurement of the effect of DS s3 (1-16) on the intracellular ADP/ATP ratio was carried out by a method adapted from Chapman et al. (7). ATP was measured with the Celsis High Sensitivity Bioluminescence Kit (Celsis International, Cambridge Science Park, Cambridge, United Kingdom). The cells were inoculated into YNBG at pH 4.5 and 6.0 and 30°C with shaking to give a starting optical density at 600 nm of approximately 0.4. When the cultures had grown to an optical density at 600 nm of approximately 0.55, DS s3 (1-16) (17.27 μg/ml) was added. Growth was followed spectrophotometrically, and ATP plus ADP levels were measured pre- and postaddition of the peptide by using a Luminoscan luminometer (Labsystems, Basingstoke, Hampshire, United Kingdom).
Measurement of DS s3 (1-16)-induced leakage of UV-absorbing compounds.
Measurement of DS s3 (1-16)-induced leakage of UV-absorbing compounds was performed exactly as described by De Nobel et al. (11), except that measurements were made in 25 mM citric-phosphate buffer at pH 4.5 and 6.0. After incubation with 17.27 μg of DS s3 (1-16) per ml the release of UV-absorbing compounds from the cells was determined as the A260 (Philips PU 8630 spectrophotometer) of the cell-free solution, and the A260 was compared to that for an untreated control. Readings were adjusted for the presence of the peptide.
RESULTS
DS s3 (1-16) is a potent, pH-dependent inhibitor of yeast growth.
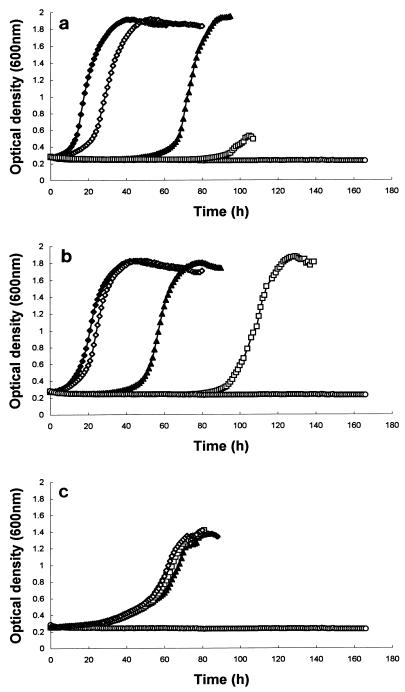
At all pH values, a concentration of 8.63 μg of the peptide per ml completely inhibited growth over the duration of the experiment (Fig. 1). Although growth was monitored for only 1 week (168 h), after this time the plates were observed visually for signs of subsequent growth, and none was observed after 3 weeks (data not shown). Optimal inhibition of growth induced by exposure to DS s3 (1-16) occurred at pH 7.0 (Fig. 1a). Reducing the treatment pH reduced the inhibitory effect of the peptide. For example, at pH 7.0, exposure to 1.73 μg of the peptide per ml delayed the onset of growth for approximately 40 h (Fig. 1a), but exposure to the equivalent concentration at pH 6.0 delayed growth for only 20 h (Fig. 1b), and at pH 4.0 growth was not inhibited by this concentration at all (Fig. 1c). A similar effect was also observed when cells were exposed to 3.45 μg of the peptide per ml (Fig. 1).
FIG. 1.
Effect of 0 (⧫), 0.86 (◊), 1.73 (▴), 3.45 (□), and 8.63 (○) μg of DS s3 (1-16) per ml on the growth of S. cerevisiae X2180-1A in YEPD (inoculum size, 5.0 × 10³ cells ml−1) at pH 7.0 (a), pH 6.0 (b), and pH 4.0 (c). Growth was measured turbidometrically at 600 nm at 30°C with shaking over a period of 7 days. A representative result of at least three replicate experiments is shown.
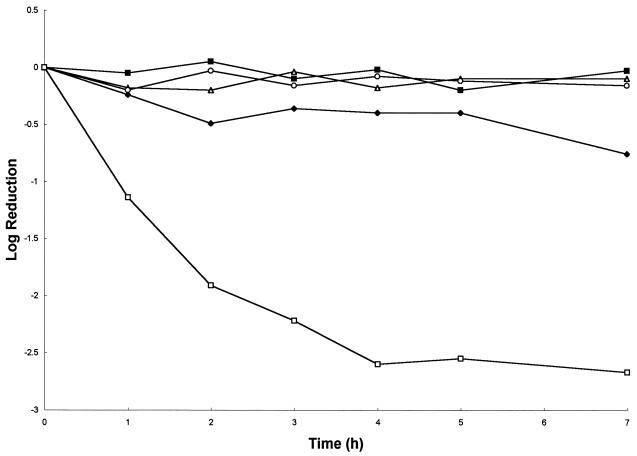
In correlation with the observed results for growth inhibition, the loss of viability induced upon exposure to 8.63 μg of DS s3 (1-16) per ml was also pH dependent. Maximal log reductions occurred at pH 6.0 (0.75 log) and pH 7.0 (2.5 logs) (Fig. 2). No loss of viability was observed upon exposure to the peptide at pH 3.0, 4.0, or 5.0 over a 7-h period.
FIG. 2.
Effect of 8.63 μg of DS s3 (1-16) per ml on viability over a 7-h incubation of a mid-exponential-phase culture (5.0 × 10⁷ cells ml−1) of S. cerevisiae X2180-1A in YEPD at 30°C at pH 3.0 (▵), pH 4.0 (■), pH 5.0 (○), pH 6.0 (⧫), and pH 7.0 (□). A representative result of at least three replicate experiments is shown.
The same concentration of DS s3 (1-16) has a greater inhibitory effect on lower inoculum sizes.
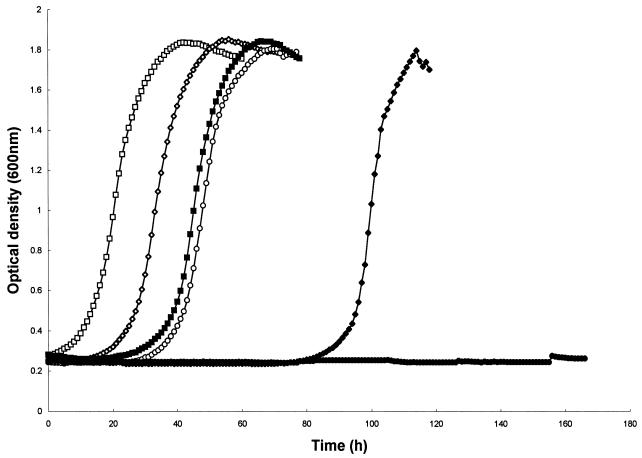
A reduction of the initial inoculum size, in the absence of peptide, from 5.0 × 10³ cells ml−1 (2,000 cells per well) to 5.0 × 10² cells ml−1 (200 cells per well) and, finally, to 5.0 × 10 cells ml−1 (20 cells per well) resulted in small, increasing delays in the time to the onset of growth (Fig. 3). However, in the presence of 1.73 μg of DS s3 (1-16) per ml this effect was amplified and a lower initial number of cells resulted in far greater inhibitory activity. For example, an initial inoculum size of 5.0 × 10³ cells ml−1 in the presence of peptide resulted in a delay to the onset of growth of approximately 25 h. However, if the inoculum size was reduced to 5.0 × 10² cells ml−1 this delay was extended to approximately 80 h. Finally, with an inoculum size of only 5.0 × 10 cells ml−1 no growth was observed at all (after 168 h of incubation) (Fig. 3).
FIG. 3.
Effect of inoculum sizes of 5.0 × 10³ cells ml−1 (□, ■), 5.0 × 10² cells ml−1 (◊, ⧫), and 5.0 × 10 cells ml−1 (○, •) on the growth of S. cerevisiae X2180-1A in YEPD at pH 6.0 either without (open symbols) or in the presence of (solid symbols) 1.73 μg of DS s3 (1-16) per ml. Growth was measured turbidometrically at 600 nm at 30°C with shaking over a period of 7 days. A representative result of at least three replicate experiments is shown.
Exposure to DS s3 (1-16) causes membrane disruption.
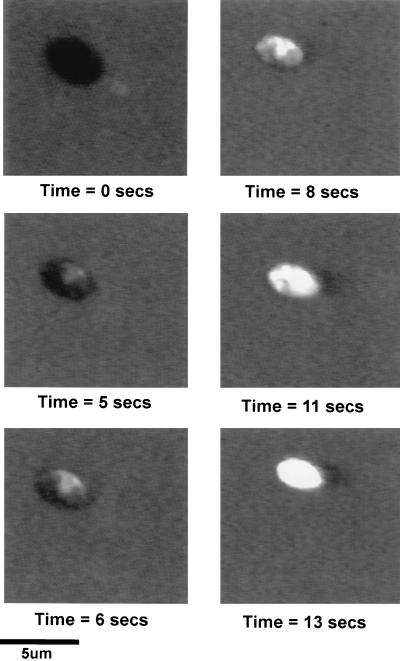
Approximately 5.0 × 10⁷ cells ml−1 were exposed to 12.97 μg of DS s3 (1-16) per ml in YEPD broth (pH 6.0) and the cells were visualized by CSLM. A time course of fluorescent images illustrating the effect of the peptide on the integrity of the membrane of a single cell, visualized by the influx of ethidium bromide, is shown in Fig. 4.
FIG. 4.
Results of a time course experiment illustrating the effect of exposure to 12.97 μg of DS s3 (1-16) per ml on the permeability of the membrane of an individual cell of S. cerevisiae X2180-1A in YEPD (pH 6.0) by CSLM. Peptide-induced membrane disruption was visualized by influx of the fluorescent nuclear stain ethidium bromide (10 μg/ml) over a time course of 13 s. The captured images are representative of a typical result.
The image at time zero shows a high background fluorescence from ethidium bromide in the culture medium. However, it is clear that the intact yeast cell excluded ethidium bromide from the cytosol because there is no detectable intracellular fluorescence. In these experiments, untreated cells were completely impermeable to ethidium bromide for up to 30 min (data not shown). After 5 s of incubation with DS s3 (1-16), a small influx of ethidium bromide, and thus fluorescence, appeared to originate from a single puncture site at the cell surface and subsequently spread rapidly into the cell cytosol. At 6 and 8 s of incubation, the spread of intracellular fluorescence across the cytoplasm accelerated rapidly, until, after 13 s, the entire cell was completely fluorescent (Fig. 4). This rapid, peptide-induced increase in the permeability of cells to ethidium bromide from one apparent site at the cell surface was typical for the majority of cells in the population. However, a small fraction of cells always remained impermeable even after 10 to 20 min of incubation in the presence of the peptide.
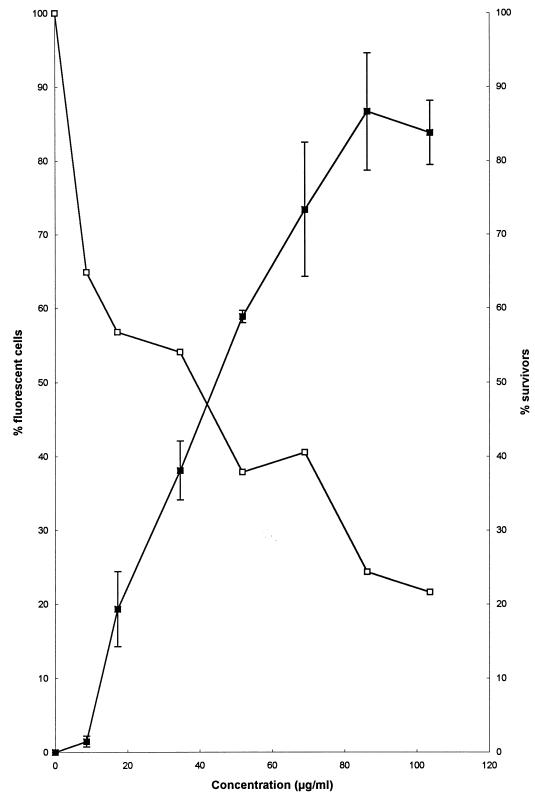
A more detailed study of the relationship between permeability and viability after exposure to increasing concentrations of DS s3 (1-16) is shown in Fig. 5. Exposure to increasing concentrations of the peptide resulted in coincident increases in the fraction of the cell population that became permeable to ethidium bromide. The observed increase in permeability correlated with the loss of viability (Fig. 5).
FIG. 5.
Effect of a 10-min exposure to increasing concentrations of DS s3 (1-16) (0 to 103.62 μg/ml) on the membrane permeability (■) and viability (□) of a mid-exponential-phase culture of S. cerevisiae X2180-1A in YEPD at pH 6.0. Peptide-induced permeability to ethidium bromide (10 μg/ml) was measured from captured fluorescent images (obtained by CSLM) and was expressed as the percentage of fluorescent cells in the population. Each datum point represents the mean and standard deviation acquired from the counting of at least 300 randomly captured cells.
Inhibition of growth by DS s3 (1-16) does not correlate with gross changes in pHi.
The observation that exposure to DS s3 (1-16) results in disruption of the cell membrane led us to investigate the possibility that, as a consequence of this, the inhibitory action of the peptide could be due to disruption of pHi homeostasis.
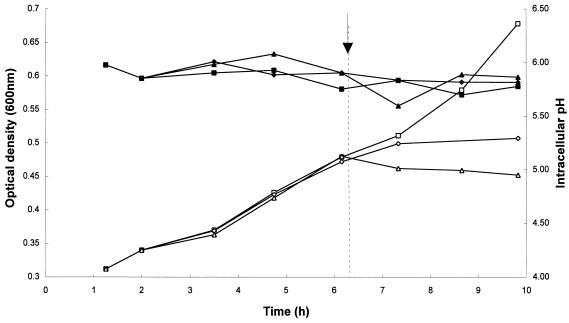
Cells growing at an external pH of 5.0 maintained their pHi at about 5.8 over the duration of the experiment (Fig. 6). Compared to the untreated culture, the addition of 8.63 μg of peptide per ml resulted in a significant reduction in the growth rate but little change in pHi, which remained constant at approximately 5.8. The addition of 17.27 μg of the peptide per ml resulted in a complete cessation of growth and little observable reduction in the pHi. We also measured the effect of exposure to DS s3 (1-16) at culture pH values of 5.5 and 6.0 and observed significant growth inhibition but little change in the pHi (data not shown). The experiments described above confirm that the membrane-disrupting effect of the peptide does not lead to gross changes in pHi that could account for the inhibitory action of the peptide (Fig. 6).
FIG. 6.
Effect of exposure to DS s3 (1-16) on the pHi of S. cerevisiae X2180-1A. The effect of 0 (■, □), 8.63 (⧫, ◊) and 17.27 (▴, ▵) μg of DS s3 (1-16) per ml on the pHi (solid symbols) of cells growing in YNBG at pH 5.0 (open symbols) was determined. The arrow and dotted line indicate when the peptide was added to the cultures. Growth was measured turbidometrically at 600 nm, and the pHi was measured by determining the intracellular pH-dependent fluorescence of CF-SE. Representative results of at least two independent experiments are shown.
Inhibition of growth by DS s3 (1-16) correlates with the loss of cellular constituents to the external environment.
If the inhibitory action of DS s3 (1-16) does not appear to be due to disruption of pHi homeostasis, then there must be an alternative explanation. To test whether the membrane-disrupting effect that occurs upon exposure to the peptide resulted in the loss of cellular materials to the medium, we measured the change in extracellular ATP/ADP ratio and the loss of UV-absorbing compounds.
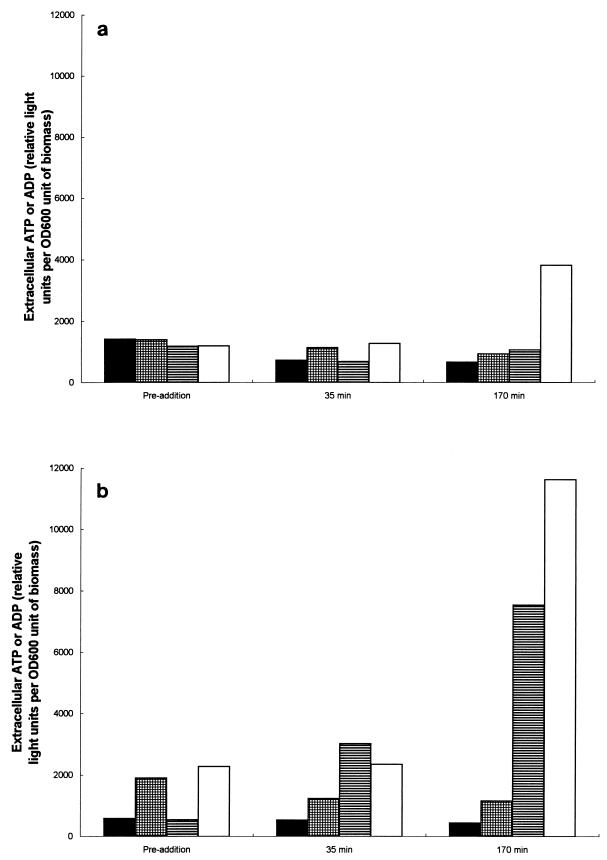
Exposure to 17.27 μg of the peptide per ml at pH 4.5 only resulted in the significant loss of ADP to the external medium after 170 min of exposure compared to the amount lost for the untreated control (Fig. 7a). However, as expected from previous results showing greater potency of the peptide at pH values near neutrality, exposure to the peptide at pH 6.0 resulted in the leakage of enormous amounts of both ATP and ADP into the culture medium compared to the amounts for the untreated culture (Fig. 7b).
FIG. 7.
Comparison of the levels of extracellular ATP or ADP effluxed from growing cultures of S. cerevisiae X2180-1A at pH 4.5 (a) and pH 6.0 (b) before (preaddition) and after (35 and 170 min postaddition) exposure to 17.27 μg of DS s3 (1-16) per ml. Extracellular ATP (▤) or ADP (□) levels during growth in the presence of 17.27 μg of DS s3 (1-16) per ml were compared to the levels of extracellular ATP (■) or ADP (▩) without the presence of the peptide. Representative results of at least two independent experiments are shown.
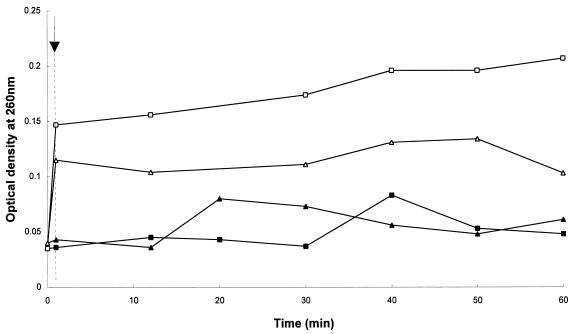
Supporting the data presented above, exposure to 17.27 μg of DS s3 (1-16) per ml resulted in immediate leakage of UV-absorbing materials from the cells (Fig. 8) which correlated with the inhibition of growth (data not shown). Greater leakage was induced upon exposure to the peptide at pH 6.0 than at pH 4.5, confirming the observations described above.
FIG. 8.
Effect of exposure to 17.27 μg of DS s3 (1-16) per ml on the efflux of UV-absorbing compounds from S. cerevisiae X2180-1A. The arrow and dotted line indicate when the peptide was added to the cultures. Efflux of UV-absorbing compounds was measured from cells resuspended in 25 mM citric-phosphate buffer at pH 4.5 (▴, ▵) and pH 6.0 (■, □). Efflux was determined in the presence of the peptide (open symbols) or without peptide (solid symbols) by measuring the optical density at 260 nm (adjusted for the presence of the peptide) and was expressed as the A260 of the cell-free solution. A representative result is shown.
The membrane-permeabilizing effect of DS s3 (1-16) results in the loss of the peptide from the medium.
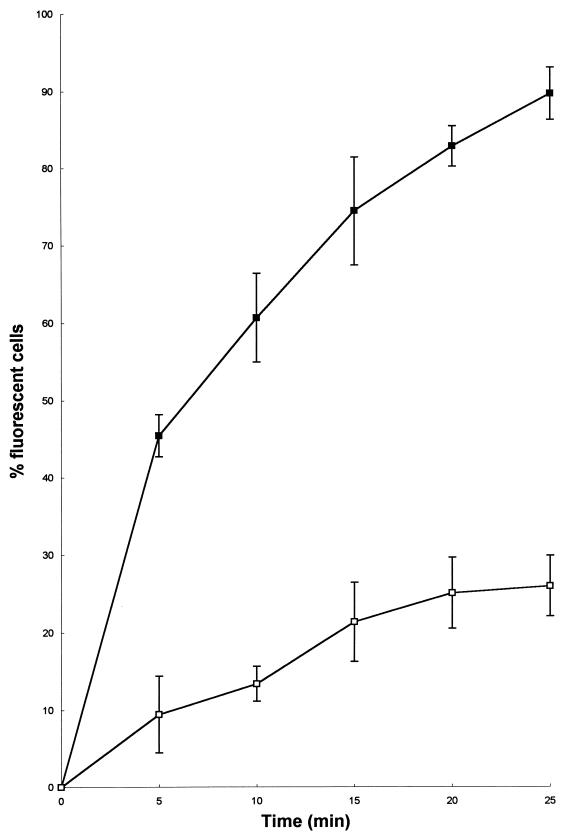
Earlier in the study we demonstrated that exposure to DS s3 (1-16) resulted in significant membrane disruption. To gain understanding of how this occurs, we exposed cells to 34.54 μg of DS s3 (1-16) per ml at pH 6.0 and measured the number of fluorescent or permeabilized cells in the population every 5 min for 25 min (Fig. 9). After 25 min of exposure to the peptide, approximately 90% of the cell population had become permeable to ethidium bromide and were fluorescent. Following this, the cells were harvested, the pellet was discarded, and the supernatant was retained. A pellet of identical, untreated cells was then exposed to this retained supernatant that had previously contained 34.54 μg of DS s3 (1-16) per ml. Upon reexposure, the supernatant was able to permeabilize only a maximum of 25% of the population (Fig. 9). This result is consistent with the fact that the majority of the peptide is removed from the medium by the cells during the initial treatment, such that during subsequent reexposure to fresh cells, a lower concentration of peptide is present.
FIG. 9.
Effect of exposure to 34.54 μg of DS s3 (1-16) per ml on the membrane permeability of mid-exponential-phase cells of S. cerevisiae X2180-1A in YEPD at pH 6.0 (■). After 25 min of exposure, the treated cells were removed by centrifugation and the supernatant was retained and subsequently used to challenge a fresh, identical population of cells for a further 25 min (□). Peptide-induced permeability of the cell to ethidium bromide (10 μg/ml) was measured from captured fluorescent images (obtained by CSLM) and was expressed as the percentage of fluorescent cells in the population. Each datum point represents the mean and standard deviation acquired from the counting of at least 300 randomly captured cells.
The inhibitory effect of DS s3 (1-16) is enhanced at higher temperatures.
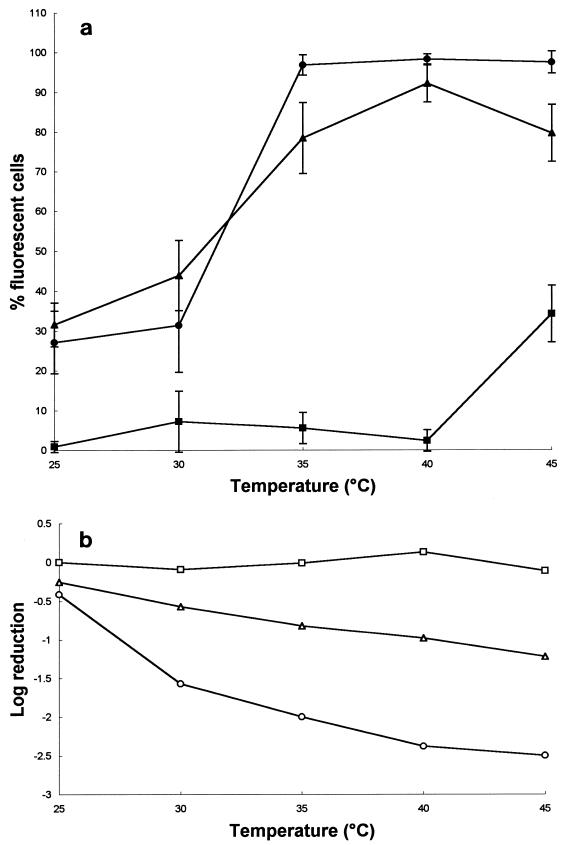
Raising the incubation temperature from 25 to 40°C resulted in little significant change in the levels of cell membrane permeability. However, raising the exposure temperature to 45°C resulted in a significant increase in the number of fluorescent, permeabilized cells in the population (approximately 30%) (Fig. 10a). Incubation at all of these temperatures had no effect on cell viability (Fig. 10b). As would be expected, incubation at 25°C in the presence of both 3.45 and 8.63 μg of DS s3 (1-16) per ml resulted in an increase in the fraction of permeabilized cells to approximately 30% (Fig. 10a) and a small, coincident loss of viability (Fig. 10b). However, when the incubation temperature was raised to 35°C and above, the fraction of permeabilized cells in the population rose to between 80 and 100% after exposure to both concentrations of the peptide (Fig. 10a). In correlation with this, there was a coincident loss of viability, such that after exposure to 3.45 and 8.63 μg of the peptide per ml at 40°C, approximately 90 and 99% of the population was killed, respectively (Fig. 10b). Similar results were observed at the higher incubation temperature of 45°C.
FIG. 10.
Effect of increasing temperature (25 to 45°C) on the membrane permeability (solid symbols) (a) and viability (open symbols) (b) of mid-exponential-phase cells of S. cerevisiae X2180-1A (YEPD, pH 6.0) exposed to 0 (■, □), 3.45 (▴, ▵) and 8.63 (○, •) μg of DS s3 (1-16) per ml for 10 min. Membrane permeability was measured by fluorescence microscopy as described in the text, and each datum point represents the mean and standard deviation acquired from the counting of at least 300 randomly captured cells.
DISCUSSION
In the work described in this report we have characterized the potent inhibitory activity of a truncated derivative of the natural amphibian skin peptide DS s3 (1-16) against S. cerevisiae. The efficacy of the peptide was found to be pH dependent, with optimal activity at pH values around neutrality. It has been hypothesized that positively charged, cationic peptides, such as dermaseptin, are attracted to the negatively charged surfaces of cell membranes (15). The negative charges on microbial cell membranes arise from the carboxyl groups of amino acids, free fatty acids, and sugar acids and the phosphate groups of phospholipids. These groups generally have pKa values of about 4.0 and become protonated below these pH values (12). Thus, lowering the pH of the yeast suspension would result in protonation or neutralization of negative charges at the surface of the membrane and would thus reduce the interaction of the cationic peptide with the membrane phospholipid complex, possibly explaining the decreased potency of DS s3 (1-16) at low pH. This hypothesis is supported by the observations of Murata et al. (23), who have shown that fusion of egg phosphatidylcholine unilamellar vesicles induced by anionic peptides occurs optimally at acidic pH values (below 6.0) and that fusion by a cationic, lysine-rich peptide occurs at alkaline pH values.
Using fluorescence microscopy we have clearly shown that DS s3 (1-16) acts to disrupt the yeast cell membrane, resulting in the gross permeabilization of the cell to the nuclear stain ethidium bromide. Study of the captured fluorescence images revealed that each cell appeared to become permeabilized from one initial point at the cell surface. A possible explanation for this apparent localized collapse of membrane integrity could include the more rapid transfer of the peptide through the cell wall to the plasma membrane at a weak point, for example, at a bud scar. Alternatively, perhaps a threshold concentration of peptide must be partitioned within the plasma membrane at any one site such that aggregation occurs to form a single pore which results in immediate membrane disruption.
Upon exposure to the peptide, the majority of cells (>90%) were rapidly permeabilized, with permeabilization occurring within approximately 5 min. After this initial stage the frequency of permeabilization slowed until, after approximately 30 min, no more cells became fluorescent and a small population of intact cells remained. These kinetics could occur because there is a subpopulation of cells that are resistant to the inhibitory action of the peptide, or because the peptide partitions into the plasma membrane, the population of cells could act as a sink, removing all the peptide from the surrounding medium. Thus, assuming that a certain concentration of peptide is required to result in the permeabilization of an individual cell, the consequence of the peptide being removed could be that some cells remain apparently unaffected because insufficient peptide is present to completely permeabilize their membranes. We believe the latter explanation is more likely because subsequent exposure of these apparently resistant cells to additional peptide also results in their permeabilization (data not shown).
Supporting the hypothesis presented above, exposure of a population of cells to 34.54 μg of the peptide per ml resulted in permeabilization of approximately 90% of the population after 25 min. Removal of these cells by centrifugation and reexposure of identical fresh cells to the same supernatant that had previously contained peptide resulted in permeabilization of only approximately 20% of the population after 25 min (Fig. 9). Thus, the most likely explanation for the reduced level of membrane disruption induced by the second exposure is the fact that the majority of the peptide had been removed from solution by the plasma membranes of the initial population. It is possible that the peptide could also have been removed from the medium by nonspecific binding to the cell wall or by proteinase activity. The latter explanation is unlikely because few yeasts have the ability to hydrolyze extracellular proteins (25). Further evidence supporting removal of the peptide from the medium by the cell membrane comes from studies on the effect of inoculum size on the inhibitory action of the peptide. A lower initial number of cells resulted in the same concentration of peptide having far greater inhibitory activity in terms of growth inhibition. Similar to previous results, perhaps this is due to a set number of cells requiring a minimum concentration of peptide to ensure that the entire population is permeabilized and thus incapable of subsequent growth.
Despite inducing gross membrane permeabilization, it is clear that the principal inhibitory action of the peptide cannot be disruption of pHi homeostasis. Exposure of the cells to inhibitory concentrations of peptide at an external pH of 5.0, at which we would expect that membrane disruption would induce protons to flow into the cell down the pH gradient, resulted in little decrease in pHi. A possible explanation for this could be the induction of a protective response, such as activation of the proton-pumping H+-ATPase, that compensates for the decrease in pHi that has been shown to occur when yeast cells are exposed to stress factors that reduce the pHi (24, 27). However, because the peptide has optimal inhibitory activity at external pH values similar to the pHi of the cell, we would predict that any membrane disruption induced by exposure to DS s3 (1-16) would not lead to movement of protons into the cell and thus a decrease in the pHi. Therefore, we can conclude that the inhibitory action of DS s3 (1-16) is not due to disruption of pHi homeostasis per se.
Significantly, the growth inhibition induced upon exposure to the peptide did correlate with the efflux of critical cellular constituents such as ADP, ATP, and UV-absorbing compounds, for example, RNA and DNA, into the surrounding medium. This supports the previous observations of Abee et al. (1), who proposed that the principal inhibitory action of the cationic peptide nisin against Listeria monocytogenes was a combination of effects due to membrane disruption, such as depolarization and inhibition of the respiratory chain, and the loss of critical cellular components such as ATP and intracellular K+ ions to the external environment. The combination of DS s3 (1-16) with mild heating temperatures as low as 35°C significantly enhanced the inhibitory effect of the peptide. Indeed, heating of the cells to 45°C in the presence of 8.63 μg of the peptide per ml resulted in the death of greater than 99% of the population in 10 min (Fig. 9b). Sublethal heating is known to increase the permeability and fluidity of the yeast cell membrane (6, 9). Perhaps the combination of the membrane-active peptide with the membrane-perturbing effects of heating results in a greater loss of membrane function and intracellular constituents to the external environment. Future studies will attempt to elucidate the basis of this inhibitory synergy in more detail. Furthermore, the precise role that the composition of the plasma membrane plays in determining the efficacy of DS s3 (1-16), for example, lipid chain length and saturation and sterol content, is being investigated.
In summary, we have identified a derivative of a natural antimicrobial peptide that has considerable potential, either alone or in combination with mild heating, to prevent the growth of or kill spoilage yeast.
ACKNOWLEDGMENT
We thank Helen Hunt, Measurement Science, for invaluable assistance in the preparation of the CSLM images.
REFERENCES
- 1.Abee T, Rombouts F M, Hugenholtz J, Guihard G, Letellier L. Mode of action of nisin Z against Listeria monocytogenesScott A grown at high and low temperatures. Appl Environ Microbiol. 1994;60:1962–1968. doi: 10.1128/aem.60.6.1962-1968.1994. [DOI] [PMC free article] [PubMed] [Google Scholar]
- 2.Barra D, Simmaco M. Amphibian skin: a promising resource for antimicrobial peptides. Trends Biotechnol. 1995;13:205–209. doi: 10.1016/S0167-7799(00)88947-7. [DOI] [PubMed] [Google Scholar]
- 3.Bracey D, Holyoak C D, Nebe-von Caron G, Coote P J. Determination of the intracellular pH (pHi) of growing cells of Saccharomyces cerevisiae: the effect of reduced-expression of the membrane H+-ATPase. J Microbiol Methods. 1998;31:113–125. [Google Scholar]
- 4.Bracey, D., C. D. Holyoak, and P. J. Coote. Comparison of the inhibitory effect of sorbic acid and amphotericin B on Saccharomyces cerevisiae: is growth inhibition dependent on reduced intracellular pH? J. Appl. Microbiol., in press. [DOI] [PubMed]
- 5.Broekaert W F, Terras F R G, Cammue B P A, Osborn R W. Plant defensins: novel antimicrobial peptides as components of the host defence system. Plant Physiol. 1995;108:1353–1358. doi: 10.1104/pp.108.4.1353. [DOI] [PMC free article] [PubMed] [Google Scholar]
- 6.Chang S B, Matson R S. Membrane stability (thermal) and nature of fatty acids in yeast cells. Biochem Biophys Res Commun. 1972;46:1529–1535. doi: 10.1016/0006-291x(72)90781-4. [DOI] [PubMed] [Google Scholar]
- 7.Chapman A G, Fall L, Atkinson D E. Adenylate energy charge in Escherichia coliduring growth and starvation. J Bacteriol. 1971;108:1072–1086. doi: 10.1128/jb.108.3.1072-1086.1971. [DOI] [PMC free article] [PubMed] [Google Scholar]
- 8.Coote P J, Cole M B, Jones M V. Induction of increased thermotolerance in Saccharomyces cerevisiaeby a mechanism involving intracellular pH. J Gen Microbiol. 1991;137:1701–1708. doi: 10.1099/00221287-137-7-1701. [DOI] [PubMed] [Google Scholar]
- 9.Coote P J, Jones M V, Seymour I J, Rowe D L, Ferdinando D P, McArthur A J, Cole M B. Activity of the plasma membrane H+-ATPase is a key physiological determinant of thermotolerance in Saccharomyces cerevisiae. Microbiology. 1994;140:1881–1890. doi: 10.1099/13500872-140-8-1881. [DOI] [PubMed] [Google Scholar]
- 10.Davey H M, Kell D B. Flow cytometry and cell sorting of heterogeneous microbial populations: the importance of single-cell analyses. Microbiol Rev. 1996;60:641–696. doi: 10.1128/mr.60.4.641-696.1996. [DOI] [PMC free article] [PubMed] [Google Scholar]
- 11.De Nobel J G, Klis F M, Munnik T, Priem J, Van den Ende H. An assay of relative cell wall porosity in Saccharomyces cerevisiae, Kluyveromyces lactis and Schizosaccharomyces pombe. Yeast. 1990;6:483–490. doi: 10.1002/yea.320060605. [DOI] [PubMed] [Google Scholar]
- 12.Dychala G R, Lopes J A. Surface-active agents: acid-anionic compounds. In: Block S S, editor. Disinfection, sterilization and preservation. 4th ed. Philadelphia, Pa: Lea & Febiger; 1991. pp. 256–262. [Google Scholar]
- 13.Evans E W, Harmon B G. A review of antimicrobial peptides: defensins and related cationic peptides. Vet Clin Pathol. 1995;24:109–115. doi: 10.1111/j.1939-165x.1995.tb00949.x. [DOI] [PubMed] [Google Scholar]
- 14.Gibson B W, Tang D, Mandrell R, Kelly M, Spindel E R. Bombinin-like peptides with antimicrobial activity from skin secretions of the asian toad, Bombina orientalis. J Biol Chem. 1991;266:23103–23111. [PubMed] [Google Scholar]
- 15.Hancock R E W. Peptide antibiotics. Lancet. 1997;349:418–422. doi: 10.1016/S0140-6736(97)80051-7. [DOI] [PubMed] [Google Scholar]
- 16.He K, Ludtke S J, Huang H W. Antimicrobial peptide pores in membranes detected by neutron in-plane scattering. Biochemistry. 1995;34:15614–15618. doi: 10.1021/bi00048a002. [DOI] [PubMed] [Google Scholar]
- 17.Matsuzaki K, Murase O, Fujii N, Miyajima K. Translocation of a channel-forming antimicrobial peptide, magainin 2, across lipid bilayers by forming a pore. Biochemistry. 1995;34:6521–6526. doi: 10.1021/bi00019a033. [DOI] [PubMed] [Google Scholar]
- 18.Matsuzaki K, Sugishita K, Fujii N, Miyajima K. Molecular basis for membrane selectivity of an antimicrobial peptide, magainin 2. Biochemistry. 1995;34:3423–3429. doi: 10.1021/bi00010a034. [DOI] [PubMed] [Google Scholar]
- 19.Mor A, Huong Nguyen V, Delfour A, Migliore-Samour D, Nicolas P. Isolation, amino acid sequence, and synthesis of dermaseptin, a novel antimicrobial peptide of amphibian skin. Biochemistry. 1991;30:8824–8830. doi: 10.1021/bi00100a014. [DOI] [PubMed] [Google Scholar]
- 20.Mor A, Hani K, Nicolas P. The vertebrate peptide antibiotics dermaseptins have overlapping structural features but target specific microorganisms. J Biol Chem. 1994;269:31365–31641. [PubMed] [Google Scholar]
- 21.Mor A, Nicolas P. The NH2-terminal α-helical domain 1-18 of dermaseptin is responsible for antimicrobial activity. J Biol Chem. 1994;269:1934–1939. [PubMed] [Google Scholar]
- 22.Mor A, Nicolas P. Isolation and structure of novel defensive peptides from frog skin. Eur J Biochem. 1994;219:145–154. doi: 10.1111/j.1432-1033.1994.tb19924.x. [DOI] [PubMed] [Google Scholar]
- 23.Murata M, Takahashi S, Kagiwada S, Suzuki A, Ohnishi S. pH-dependent membrane fusion and vesiculation of phospholipid large unilamellar vesicles induced by amphiphilic anionic and cationic peptides. Biochemistry. 1992;31:1986–1992. doi: 10.1021/bi00122a013. [DOI] [PubMed] [Google Scholar]
- 24.Piper P W, Ortiz-Calderon C, Holyoak C D, Coote P, Cole M B. Hsp30, the integral plasma membrane heat shock protein of Saccharomyces cerevisiae, is a stress-inducible regulator of plasma membrane H+-ATPase. Cell Stress Chaperones. 1997;2:12–24. doi: 10.1379/1466-1268(1997)002<0012:htipmh>2.3.co;2. [DOI] [PMC free article] [PubMed] [Google Scholar]
- 25.Rose A H. Responses to the chemical environment. In: Rose A H, Harrison J S, editors. The yeasts, vol. 2. Yeasts and the environment. 2nd ed. London, United Kingdom: Academic Press; 1987. pp. 5–40. [Google Scholar]
- 26.Steiner H, Hultmark D, Engstrom A, Bennich H, Boman H G. Sequence and specificity of two antibacterial proteins involved in insect immunity. Nature. 1981;292:246–248. doi: 10.1038/292246a0. [DOI] [PubMed] [Google Scholar]
- 27.Viegas C A, Almeida P H, Cavaco M, Sa-Correia I. The H+-ATPase in the plasma membrane of Saccharomyces cerevisiaeis activated during growth latency in octanoic acid-supplemented medium accompanying the decrease in intracellular pH and cell viability. Appl Environ Microbiol. 1998;64:779–783. doi: 10.1128/aem.64.2.779-783.1998. [DOI] [PMC free article] [PubMed] [Google Scholar]
- 28.Zasloff M. Magainins, a class of antimicrobial peptides from Xenopusskin: isolation, characterization of two active forms, and partial cDNA sequence of a precursor. Proc Natl Acad Sci USA. 1987;84:5449–5453. doi: 10.1073/pnas.84.15.5449. [DOI] [PMC free article] [PubMed] [Google Scholar]


