

Abstract
INTRODUCTION
The risk reduction for Alzheimer's disease (rrAD) trial was a multisite clinical trial to assess exercise and intensive vascular pharmacological treatment on cognitive function in community‐dwelling older adults at increased risk for Alzheimer's disease.
METHODS
Eligibility, consent, and randomization rates across different referral sources were compared. Informal interviews conducted with each site's project team were conducted upon study completion.
RESULTS
Initially, 3290 individuals were screened, of whom 28% were eligible to consent, 805 consented to participate (87.2% of those eligible), and 513 (36.3% of those consented) were randomized. Emails sent from study site listservs/databases yielded the highest amount (20.9%) of screened individuals. Professional referrals from physicians yielded the greatest percentage of consented individuals (57.1%). Referrals from non‐professional contacts (ie, friends, family; 75%) and mail/phone contact from a site (73.8%) had the highest yield of randomization.
DISCUSSION
Professional referrals or email from listservs/registries were most effective for enrolling participants. The greatest yield of eligible/randomized participants came from non‐professional and mail/phone contacts. Future trials should consider special efforts targeting these recruitment approaches.
Highlights
Clinical trial recruitment is commonly cited as a significant barrier to advancing our understanding of cognitive health interventions.
The most cited referral source was email, followed by interviews/editorials on the radio, television, local newspapers, newsletters, or magazine articles.
The referral method that brought in the largest number of contacts was email but did not result in the greatest yield of consents or eligible participants.
The sources that yielded the greatest likelihood of consent were professional referrals (ie, physician), social media, and mail/phone contact from study site.
The greatest yield of eligible/randomized participants came from non‐professional contacts and mail/phone contact from a site.
Findings suggest that sites may need to focus on more selective referral sources, such as using contact mailing and phone lists, rather than more widely viewed recruitment sources, such as social media or TV/radio advertisements.
Keywords: Alzheimer's disease, brain structure, cognition, exercise, recruitment, reduction of vascular risk factors
1. INTRODUCTION
Clinical trial recruitment is commonly cited as being among the costliest barriers to advancing our understanding of cognitive health interventions. 1 , 2 , 3 , 4 Successful recruitment of older adults into clinical trials often requires significant investment of both time and money, 1 , 5 and the pace of recruitment into trials directly impacts the cost of trials and time to completion. 3 In addition, single‐site studies, although important for early proof of concept of studies, cannot always be relied upon for representative study populations. 6 Therefore, multisite clinical research designs are often used to increase sample size, obtain more representative samples, and increase the generalizability of the outcome measures. 7 , 8 In addition, insufficient inclusion of underrepresented populations is an ongoing limitation of most clinical research. A recent systematic review highlighted the need to learn more about the barriers and facilitators to research participation among racial or ethnic minoritized individuals 9 .
In this report, we describe the recruitment strategies, yield, successes, and lessons learned from the risk reduction of Alzheimer's disease (rrAD) trial recruitment efforts. We also describe the baseline characteristics of the participants. These data will provide helpful information for investigators seeking to recruit older adults with cardiovascular risk factors into future pharmacological and physical activity interventions aimed at reducing the risk of cognitive decline and Alzheimer's disease (AD).
2. METHODS
2.1. Study overview
The rrAD trial was designed to test the hypothesis that exercise combined with intensive pharmacological reduction of vascular risk factors (IRVR) over a period of 2 years would provide greater benefits for neurocognitive function than either exercise (EX) or IRVR alone. 10 Eligibility criteria included (1) age 60 to 85 years, (2) diagnosis of hypertension (HTN) with systolic blood pressure between 130 and 180 mmHg or between 110 and 130 mmHg if on treatment for HTN, and (3) subjective memory concerns or first‐degree relative with diagnosis of dementia, without evidence of significant cognitive impairment. After careful screening and baseline assessments, participants were randomized into one of four intervention groups for a period of 2 years: usual care (UC), intensive reduction of vascular risk factors (IRVR) with blood pressure and cholesterol reduction, EX, and IRVR+EX. Participants assigned to EX performed a structured, moderate‐to‐vigorous aerobic exercise program, were provided membership at a local YMCA or gym, and followed their primary care physician's recommendations for blood pressure and cholesterol management. Those assigned to IRVR were treated by the study team for HTN and hypercholesterolemia using algorithms to achieve systolic blood pressure (BP) < 130 mmHg and atorvastatin 80 mg daily. Those assigned to EX + IRVR received both interventions. Those assigned to UC followed their primary care physician's recommendations for BP and cholesterol management and were provided instructions and encouragement for a home exercise program focused on stretching and balance exercises. The complete rrAD trial protocol has been described previously. 10
RESEARCH IN CONTEXT
Systematic review: Clinical trials require a large enough sample size to evaluate the primary outcomes of interest; however, recruiting adequate numbers of qualified volunteer participants efficiently is among the biggest challenges facing AD investigators. Clinical trial recruitment is commonly cited as being among the costliest barriers to advancing our understanding of cognitive health interventions. Successful recruitment of older adults into clinical trials often requires significant investment of both time and money, and the pace of recruitment into trials directly impacts the cost of trials and time to completion. There is a need to learn more about the barriers and facilitators to research participation among racial or ethnic minoritized individuals.
Interpretation: In the rrAD trial, four centers randomized 513 participants ages 65 to 80 years with cardiovascular and dementia risk factors into future pharmacological and physical activity interventions aimed at reducing the risk of cognitive decline and AD. Recruitment yield was 15.5% of total screened individuals randomized to participate in the trial. Across the four sites, the most cited referral source was email, followed by interviews/editorials on radio or television (TV) or that appeared in local newspapers, newsletters, or magazine articles. However, the referral method that brought in the largest number of contacts (email) did not result in the greatest yield of consents or quality/eligible participants. The referrals that yielded the greatest likelihood of consent were professional referrals (ie, physician), social media, and mail/phone contact from the study site. The highest number of randomized participants learned of the study through email, an investigator interview or editorial, or another source. However, the greatest yield of eligible/randomized participants came from non‐professional contacts and mail/phone contact from a site. This suggests that sites may need focus on more selective referral sources such as using contact mailing and phone lists rather than more widely viewed recruitment sources such as TV/radio advertisements.
Future directions: The maintenance of a registry or large database of past study participants or those interested in research participation was the most fruitful method of recruiting eligible study participants. Partnering or being a part of a National Institutes of Health (NIH)‐designated Alzheimer's Disease Research Center is also helpful for building study visibility and referral of aging participants for trials. For research sites building a recruitment database or trying to attract new potential participants, an increase in the overall presence and visibility of the research team within the community is advisable. This could include regular presence at community events including churches, community council/development committees, fairs, and other events using staff who are like the populations of interest in terms of race/ethnicity. This type of recruitment effort may help to increase the diversity of who are aware of and interested in participating in research. The development of relationships with primary care physicians or developing Community‐Based Participatory Research Program (CBPR) approaches may also lead to success. Finally, keeping detailed financial records for recruitment could help studies to better develop recruitment budgets for future trials as they would know the approximate cost to acquire a study.
2.2. Consent statement
The rrAD study protocol (NCT02913664) was approved by Pennington, University of Texas Southwestern, Washington University, St. Louis, and the University of Kansas Medical Center (KUMC), and Human Subjects Review Committees, and informed consent was obtained from all participants.
2.3. Recruitment
rrAD trial recruitment began in July 2016 and ended in October 2019. Participants were recruited from Baton Rouge, Louisiana; Dallas, Texas; Kansas City, Kansas; and St. Louis, Missouri areas using a variety of strategies, including non‐professional referrals (eg, spouse/partner, friends, family member), professional referrals (ie, physician), mail or phone contact from a study site using a registry list, advertising displays (eg, posters, e‐boards, billboards, bus wraps), marketing materials (eg, brochures, promotional items, flyers, handouts, letters, postcards), print ads (eg, newspaper, newsletter, magazine ads), broadcast advertising (radio/TV), the rrAD trial website (www.rradtrial.org), email (ie, email blasts to registry lists), social media (eg, Facebook, LinkedIn, Twitter, Instagram), E‐Link/Trial registries (eg, clinicaltrials.gov, ENDALZNOW), community presentations (eg, libraries, senior centers, churches, recreation centers), interviews/editorials (eg, radio, TV, newspaper, or magazine articles), and special community events (eg, awareness events, fundraisers, senior/health fairs). Marketing materials targeted individuals 60 to 85 years of age, with high BP, concerns about memory or a parent or sibling diagnosed with dementia, and willingness to be randomized into one of four study groups.
Recruitment goals for individuals from minoritized racial and ethnic identities underrepresented in science were established a priori based on regional site demographic representation and were anticipated to be ∼20% for the entire study: 8% Black, 8% Hispanic, and 4% Asian/others. We also anticipated that approximately 60% of the final sample would be female. Additional information related to recruitment is available in supplemental information.
2.4. Study screening and assessments
Interested participants were prescreened over the phone or in person at each study site. After hearing a brief description of the rrAD trial, those interested in participating completed screening questions including referral source, age, gender, questions about memory difficulty, family history of dementia or subjective memory decline, BP concerns, medication status, exercise habits, and other general health questions. Following the phone screening, interested participants provided written informed consent and completed two onsite screening/testing visits to evaluate their eligibility for the study based on 10 inclusion and 15 exclusion criteria (Table S1).
In‐person screening visits included an informed consent session and two onsite visits. Demographics (including age, education, race, and ethnicity), vital signs, electrocardiogram, blood collection, physical exam, screening for cognitive impairment and depression, and a medical history were obtained during these visits. Participants who successfully completed both screening visits and were eligible for the study proceeded to baseline testing. Following baseline testing, participants were randomized to one of four intervention groups (usual care, IRVR, EX, or IRVR+EX).
2.5. Informal interviews with study coordinators
Following the completion of recruitment, an investigator (Szabo‐Reed) informally interviewed each site coordinator about the methods of recruitment used at their site via video conference (May 2020). Open‐ended questions included the following: What methods of recruitment did your site use? Which model(s) of recruitment do you feel were the most successful (ie, highest yield)? Were there any issues with the modes of recruitment used at your site (ie, too many contact calls to return at one time)? Themes for each site and overall are presented in the results.
2.6. Data analysis
Data analysis was conducted in SPSS version 27.0. We assumed missing data occurred randomly. Pearson's chi‐squared analysis was used to compare eligibility, consenting, and randomization rates across different referral sources. Independent t tests were used to compare differences in numerical variables. Post hoc analyses were conducted when a difference between groups (eg, eligible/ineligible or race) was detected. Tests were conducted by examining the residuals to determine what was driving group differences. All post hoc analyses were Bonferroni corrected to control for multiple comparisons. Continuous measures are presented as mean (± SD). Frequencies are presented as percentages.
3. RESULTS
Following a brief description of the rrAD trial, 2747 (83.5%) of 3290 potential participants expressed interest in participating and continuing with the initial prescreening. A total of 1824 failed phone prescreening, and 805 participants proceeded to the in‐person study screening and baseline assessment (24.5%; Figure 1).
FIGURE 1.

Flow of participants through study enrollment.
3.1. Referral sources
Figure 2 and Table S2 show referral source by study site. A total of 2084 participants cited one referral source, 434 cited two, 175 cited three, nine cited four, one cited six, and 44 cited no referral source. The number of referral sources (three or more), was significantly different by study location (χ2 [45] = 2034, P < 0.0001). Post hoc analysis suggests that this association was a result of Baton Rouge reporting a greater proportion of individuals viewing zero or one source (P < 0.0001) and fewer viewing two or three sources. Kansas City reported more individuals viewing four sources (P < 0.0001). Dallas reported significantly fewer individuals viewing two sources and significantly more viewing three sources (P < 0.0001). St. Louis reported significantly fewer individuals viewing one source and more viewing two sources (P < 0.0001). In Baton Rouge, most participants cited email contact (N = 268, 51.7%), in Dallas participants cited interviews/editorials (N = 385, 35.8%), in Kansas City non‐professional sources were cited (104, 21.7%), and in St. Louis other source (240, 28.6%) was cited as the most common means of referral.
FIGURE 2.

See supplemental Table S2 for numerical details.
Across the four sites, the most common referral source cited was email from study site (20.9%) followed by interviews/articles/editorials on radio or TV or in local newspapers (18.7%), print advertising (18.7%), and other/unknown referrals (17.9%). Of the individuals who received an email, 39% completed phone screening and signed a consent form (χ2 [1] = 33.36, P < 0.0001, consented vs. non‐consented), compared with 20.2% for radio/television (χ2 [1] = 25.21, P < 0.0001, consented vs. non‐consented), 28.3% for print advertising (χ2 [1] = 0.08, P = 0.773, consented vs. non‐consented), and 20.3% for other/unknown referral (χ2 [1] = 23.15, P < 0.0001, consented vs. non‐consented). Although not the most cited referral source, professional referrals (ie, physician) was associated with 57.1% eligibility and signed consents (χ2 [1] = 18.725, P < 0.0001, consented vs. non‐consented). Consent rates were also higher for social media, 49.2% (χ2 [1] = 25.35, P < 0.0001, consented vs. non‐consented), mail/phone contact from site, 45.2% (χ2 [1] = 23.19, P < 0.0001, consented vs. non‐consented).
Among all individuals who signed a consent, completed screening visits, and were eligible for randomization (N = 805), 15 (1.9%) participants cited no referral source, 634 (78.9%) cited one, 117 (14.6%) cited two, and 38 (4.7%) cited three or more sources. The number of sources viewed (three or more) differed by study location (χ2 [9] = 49.76, P < 0.0001). Post hoc analysis revealed that this association was a result of the fact that Baton Rouge participants primarily reported one source (P < 0.0001) and significantly fewer reported three sources (P < 0.0001), while Kansas City had significantly fewer reporting only one source (P < 0.0001) and significantly more two sources (P < 0.0001) compared to the other sites.
Racial/ethnic minority status was collected following the in‐person consent. Of the consented individuals, 173 (21.5%) identified as a racial or ethnically minoritized individual. Among that group 11 (6.4%) participants cited no referral source, 144 (83.2%) cited one, 16 (9.2%) cited two, and two (1.5%) cited three or more sources. The number of sources cited by individuals who identified as a racial or ethnically minoritized was not statistically different from white participants (χ2 [4] = 6.09, P = 0.19). Individuals who identified as a racial or ethnically minoritized were referred to the study through a variety of sources: email blast (27.0%), interviews/editorials (11.8%), print ads (11.8%), personal contact (6.5%), mail/direct contact from site (7.1%), social media (6.4%), community presentations (4.7%), broadcast advertising (4.7%), rrAD print marketing (3.5%), another participant (2.9%), professional (2.3%), rrAD website (1.7%), trial registries (1.2%), and rrAD display advertising (0.5%). Individuals who identified as racially or ethnically minoritized were more likely to be referred by a print ad source than white individuals (χ2 [1] = 9.37, P < 0.01). There were too few racial or ethnically minoritized individuals at some sites to compare the distribution of referral sources between sites.
3.2. Phone screening
Participants were ineligible for a variety of reasons during the phone screening process (Figure 3, Table S3). Overall, 1824 (66.4% of those interested) individuals failed the phone screening. The most common reason for being excluded was a BP, reported by 432 (15.7%), that was either above or below the study criteria. This was followed by being too active for our exercise criteria (n = 288; 10.5%) and lack of a family member with dementia (n = 172; 6.3%). Of those potential participants who expressed interest, 923 (33.6%) were invited to consent for the study.
FIGURE 3.
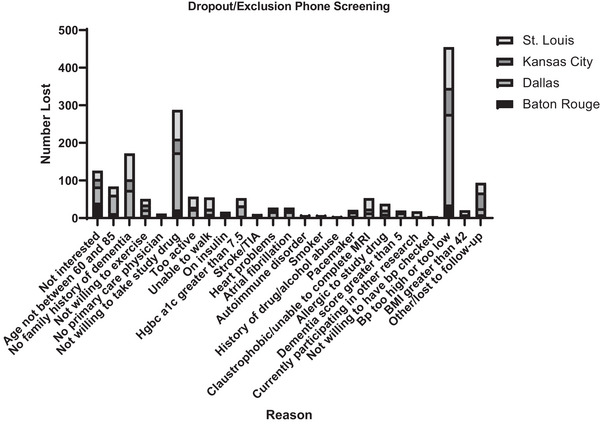
See supplemental Table S3 for numerical details.
3.3. In‐person screening/baseline
A summary of all consented participants’ baseline descriptive values by study site can be found in Tables 1 and 2. The average age for an individual consented for the study was 68.9 years (±6.3), 65.2% were female, 2.9% reported being Hispanic/LatinX, 80.5% were White, 65.9% had at least a college degree, 55.7% reported being retired, and 58.3% were married.
TABLE 1.
Categorical in‐person screening descriptive values for all consented participants by study site.
| Baton Rouge | Dallas | Kansas City | St. Louis | Total | Missing/unknown | |
|---|---|---|---|---|---|---|
| N (%) | N (%) | N (%) | N (%) | N (%) | N (%) | |
| Gender | ||||||
| Male | 99 (37.1%) | 79 (41.8%) | 56 (33.7%) | 46 (25.3%) | 280 (34.8%) | 0 (0.0%) |
| Female | 168 (62.9%) | 110 (58.2%) | 110 (66.3%) | 136 (74.7%) | 524 (65.2%) | 0 (0.0%) |
| Hispanic/Latinx ethnicity | 3 (1.1%) | 12 (6.3%) | 4 (2.4%) | 4 (2.2%) | 23 (2.9%) | 18 (2.2%) |
| Race | 797 (99.1%) | 7 (0.9%) | ||||
| White | 209 (78.3%) | 160 (84.7%) | 148 (89.2%) | 130 (71.4%) | 647 (80.5%) | |
| Black/African American | 52 (19.5%) | 17 (9.0%) | 13 (7.8%) | 49 (26.9%) | 131 (16.3%) | |
| American Indian/Native American | 1 (0.4%) | 0 (0.0%) | 1 (0.6%) | 0 (0.0%) | 2 (0.2%) | |
| Asian | 4 (1.5%) | 4 (2.1%) | 3 (1.8%) | 0 (0.0%) | 11 (1.4%) | |
| More than one race | 0 (0.0%) | 1 (0.5%) | 0 (0.0%) | 2 (1.1%) | 3 (0.4%) | |
| Another race | 1 (0.4%) | 2 (1.1%) | 0 (0.0%) | 0 (0.0%) | 3 (0.4%) | |
| Years of education | 759 (94.4%) | 45 (5.6%) | ||||
| Less than high school/no GED | 0 (0.0%) | 1 (0.5%) | 0 (0.0%) | 2 (1.1%) | 3 (0.4%) | |
| High school/GED | 41 (15.4%) | 23 (12.2%) | 7 (4.2%) | 14 (7.7%) | 85 (10.6%) | |
| Some college | 43 (16.1%) | 29 (15.3%) | 34 (20.5%) | 35 (19.2%) | 141 (17.5%) | |
| Bachelor's or equivalent | 81 (30.3%) | 63 (33.3%) | 50 (30.1%) | 37 (20.3%) | 231 (28.7%) | |
| Some postgraduate | 2 (0.7%) | 5 (2.6%) | 6 (3.6%) | 4 (2.2%) | 17 (2.1%) | |
| Master's or equivalent | 57 (21.3%) | 47 (24.9%) | 43 (25.9%) | 55 (30.2%) | 202 (25.1%) | |
| Advanced degree | 24 (9.0%) | 19 (10.1%) | 21 (12.7%) | 16 (8.8%) | 80 (10.0%) | |
| Employment status | 764 (95.0%) | 40 (5.0%) | ||||
| Employed full‐time | 48 (18.0%) | 62 (32.8%) | 34 (20.5%) | 28 (15.4%) | 172 (21.4%) | |
| Employed part‐time | 45 (16.9%) | 29 (15.3%) | 26 (15.7%) | 27 (14.8%) | 127 (15.8%) | |
| Retired | 151 (56.6%) | 87 (46.0%) | 104 (62.7%) | 106 (58.2%) | 448 (55.7%) | |
| Unemployed | 3 (1.1%) | 9 (4.98%) | 2 (1.2%) | 3 (1.6%) | 17 (2.1%) | |
| Marital status | 761 (94.6%) | 43 (5.4%) | ||||
| Married | 152 (56.9%) | 120 (63.5%) | 102 (61.4%) | 95 (52.2%) | 469 (58.3%) | |
| Widowed | 25 (9.4%) | 21 (11.1%) | 20 (12%) | 16 (8.8%) | 82 (10.2%) | |
| Divorced | 59 (22.1%) | 34 (18.0%) | 27 (16.3%) | 32 (17.6%) | 152 (18.9%) | |
| Separated | 1 (0.4%) | 1 (0.5%) | 1 (0.6%) | 3 (1.6%) | 6 (0.7%) | |
| Never married | 12 (4.5%) | 9 (4.8%) | 10 (6%) | 17 (9.3%) | 48 (6.0%) | |
| Domestic partnership | 0 (0.0%) | 2 (1.1%) | 1 (0.6%) | 1 (0.5%) | 4 (0.5%) | |
| Family history of dementia/subjective memory decline | ||||||
| Mother | 68 (25.5%) | 97 (51.3%) | 82 (49.4%) | 77 (42.3%) | 324 (40.3%) | 152 (18.9%) |
| Father | 32 (12.0%) | 45 (23.8%) | 49 (29.5%) | 36 (19.8%) | 162 (20.1%) | 173 (21.5%) |
| 1 or more siblings | 27 (10.0%) | 21 (11.1%) | 22 (13.3%) | 21 (11.5%) | 91 (11.3%) | 253 (31.5%) |
| Children | 1 (0.4%) | 1 (0.5%) | 0 (0.0%) | 0 (0.0%) | 2 (0.2%) | 304 (37.8%) |
Note: The participant N for each assessment is variable. Participants excluded after completing an earlier assessment did not complete additional assessments or screening appointments.
TABLE 2.
Continuous in‐person screening descriptive values for all consented participants by study site.
| Baton Rouge | Dallas | Kansas City | St. Louis | Total | Missing/ unknown | |||||||
|---|---|---|---|---|---|---|---|---|---|---|---|---|
| N (%) | Mean (SD) | N (%) | Mean (SD) | N (%) | Mean (SD) | N (%) | Mean (SD) | N (%) | Mean (SD) | Min‐max | N (%) | |
| Age (years) | 267 (100%) | 68.7 (6.1) | 188 (99.5%) | 69.7 (6.7) | 166 (100%) | 68.4 (5.7) | 167 (91.7%) | 68.7 (6.5) | 788 (98.0%) | 68.9 (6.3) | 59 to 86 | 16 (2.0%) |
| Geriatric depression score (GDS) | 247 (92.5%) | 1.3 (1.5) | 184 (97.4%) | 1.5 (1.8) | 161 (96.9%) | 1.6 (2.0) | 148 (81.3%) | 1.5 (2.0) | 740 (92.0%) | 1.46 (1.8) | 0 to 12 | 64 (7.9%) |
| MMSE score | 247 (92.5%) | 28.8 (1.2) | 184 (97.3%) | 28.8 (1.5) | 160 (96.4%) | 29 (1.4) | 149 (81.9%) | 28.9 (1.2) | 740 (92.0%) | 28.9 (1.3) | 18 to 30 | 64 (7.9%) |
| Systolic blood pressure (mmHg) | 258 (96.6%) | 131.7 (17.7) | 189 (100%) | 143.3 (15.8) | 165 (99.4%) | 134.1 (15.8) | 182 (100%) | 136.6 (18.6) | 794 (98.8%) | 136.1 (17.6) | 97 to 218 | 10 (1.2%) |
| Diastolic blood pressure (mmHg) | 258 (96.6%) | 76.2 (7.4) | 189 (100%) | 81.2 (7.9) | 165 (99.4%) | 81.0 (7.3) | 182 (100%) | 77.4 (7.6) | 794 (98.8%) | 78.7 (7.9) | 52 to 116 | 10 (1.2%) |
| Currently receiving treatment for HTN | 138 (51.7%) | 106 (56.1%) | 115 (69.3%) | 101 (55.5%) | 463 (57.6%) | 306 (38.0%) | ||||||
Note: The participant N for each assessment is variable. Participants excluded after completing an earlier assessment did not complete additional assessments or screening appointment.
A summary of why individuals were excluded from participation during in‐person screening by site is included in Figure 4 and Table S4. In total, 292 consented individuals were excluded from participation. The largest proportion of consented participants (n = 93; 31.8%) was excluded because they were deemed ineligible for the study by the investigator, followed by not meeting the criteria for hypertension (systolic BP ≥ 140 mmHg; n = 86; 29.5%). Reasons for which an individual was believed to be unfit to participate in the study by an investigator varied widely and included the participant's no longer being interested in being randomized, relocation, or lack of time to commit to the study. The reason for exclusion or dropout during phone screening varied widely by site based on Fisher's exact test (χ2 [84] = 344.7, P < 0.0001). Post hoc analysis concluded that Baton Rouge had significantly more individuals lost to follow‐up (P < 0.0001) than the other three sites. Kansas City had significantly more individuals who were not willing to or uninterested in taking study‐related drugs (P < 0.0001) and who did not want to commit to the study due to business or time constraints. St. Louis had significantly more individuals report taking insulin (P < 0.0001) and currently participating in other research trials (P < 0.0001) than the other three sites.
FIGURE 4.

See supplemental Table S4 for numerical details.
In total, 77 minorities (26.4% of those ineligible) who were consented were ineligible for participation. The largest proportion of consented participants (n = 22; 28.6% of minorities ineligible) was excluded because they were deemed ineligible for the study by the investigator, followed by not meeting the criteria for hypertension (systolic BP ≥ 140 mmHg; n = 19; 24.5%). These reasons were followed by a history of atrial fibrillation (n = 8; 10.4%), unwilling to be randomized (n = 5, 6.5%), uncontrolled diabetes (n = 4, 5.2%), autoimmune disorder (n = 4, 5.2%), neurological/cerebrovascular disease (n = 3, 3.9%), being a smoker (n = 3, 3.9%), body mass index greater than or equal to 40 (n = 3, 3.9%), abnormal laboratory tests (n = 3, 3.9%), AD8 < 2, Mini‐Mental State Exam (MMSE) ≥ 26 (n = 3, 3.9%), currently participating in other research (n = 2, 2.6%), allergy to study drug (n = 2, 2.6%), major depression (n = 1, 1.3%), atrial fibrillation (n = 1, 1.3%), not fluent in English (n = 1, 1.3%), and unable to walk (n = 1, 1.3%). These occurrences were too small to examine by site.
The proportion of participants excluded at each study site varied widely and significantly (χ2 [60] = 114.2, P < 0.0001). After controlling for multiple comparisons, post hoc tests revealed that Kansas City had significantly more individuals excluded for stoke (P < 0.0001), while Baton Rouge had significantly fewer (P < 0.0001). Kansas City and Dallas had significantly fewer individuals excluded for hypertension (P < 0.0001), while Baton Rouge had significantly more (P < 0.0001). Individuals who were ineligible for the study after consenting were not significantly different from randomized participants with respect to all demographic variables. Consented participants were more likely to be eligible if they reported being of Hispanic/LatinX origin (χ2 [1] = 34.05, P < 0.0001, consented [n = 18] vs. non‐consented [n = 5]) or identified as a racial or ethnically minoritized individual (χ2 [1] = 13.66, P < 0.0001, consented [n = 80] vs. non‐consented [n = 77]). However, the proportions of individuals represented in these groups are very small.
3.4. Baseline characteristics of randomized participants
A summary of the randomized samples’ (n = 513) descriptive values at baseline by study site can be found in Tables 3 and 4. The proportion of individuals randomized by site was significantly different (χ2 [3] = 42.08, P < 0.0001). Baton Rouge randomized N = 147 (49.7%) of those consented, Dallas randomized N = 136 (71.6%), Kansas City randomized N = 126 (75.9%), and St. Louis randomized N = 104 (56.5%). Post hoc tests indicated that Kansas City and Dallas randomized a significantly greater proportion of consented participants than Baton Rouge and St. Louis (P < 0.001), while Baton Rouge randomized significantly fewer consented participants (P < 0.0001).
TABLE 3.
Categorical descriptive values for randomized individuals by study site.
| Baton Rouge | Dallas | Kansas City | St. Louis | Total | Missing/unknown | |
|---|---|---|---|---|---|---|
| N (%) | N (%) | N (%) | N (%) | N (%) | N (%) | |
| Gender | ||||||
| Male | 57 (38.8%) | 59 (43.4%) | 46 (36.5%) | 28 (26.9%) | 190 (37%) | |
| Female | 90 (61.2%) | 77 (56.6%) | 80 (63.5%) | 76 (73.1%) | 323 (63%) | |
| Hispanic/Latinx ethnicity | 3 (2%) | 10 (7.4%) | 3 (2.4%) | 2 (1.9%) | 18 (3.5%) | |
| Race | 2 (0.4%) | |||||
| White | 123 (83.7%) | 119 (87.5%) | 120 (95.2%) | 71 (68.3%) | 433 (84.4%) | |
| Black/African American | 20 (13.6%) | 9 (6.6%) | 5 (4%) | 31 (29.8%) | 65 (12.7%) | |
| American Indian/Native American | 0 (0.0%) | 0 (0.0%) | 0 (0.0%) | 0 (0.0%) | 0 (0.0%) | |
| Asian | 3 (2%) | 3 (2.2%) | 1 (0.8%) | 0 (0.0%) | 7 (1.4%) | |
| More than one race | 0 (0.0%) | 1 (0.7%) | 0 (0.0%) | 2 (1.9%) | 3 (0.6%) | |
| Another | 1 (0.7%) | 2 (1.5%) | 0 (0.0%) | 0 (0.0%) | 3 (0.6%) | |
| Years of education | ||||||
| Less than high school/no GED | 0 (0.0%) | 0 (0.0%) | 0 (0.0%) | 1 (1%) | 1 (0.2%) | |
| High school/GED | 23 (15.6%) | 15 (11%) | 6 (4.8%) | 8 (7.7%) | 52 (10.1%) | |
| Some college | 25 (17%) | 18 (13.2%) | 23 (18.3%) | 19 (18.3%) | 85 (16.6%) | |
| Bachelor's or equivalent | 54 (36.7%) | 44 (32.4%) | 42 (33.3%) | 22 (21.2%) | 162 (31.6%) | |
| Some postgraduate | 2 (1.4%) | 5 (3.7%) | 3 (2.4%) | 3 (2.9%) | 13 (2.5%) | |
| Master's or equivalent | 29 (19.7%) | 39 (28.7%) | 34 (27%) | 40 (38.5%) | 142 (27.7%) | |
| Advanced degree | 14 (9.5%) | 15 (11%) | 18 (14.3%) | 11 (10.6%) | 58 (11.3%) | |
| Employment status | 2 (0.4%) | |||||
| Employed full‐time | 26 (17.7%) | 46 (33.8%) | 21 (16.7%) | 17 (16.3%) | 110 (21.4%) | |
| Employed part‐time | 28 (19%) | 19 (14%) | 23 (18.3%) | 15 (14.4%) | 85 (16.6%) | |
| Retired | 90 (61.2%) | 64 (47.1%) | 80 (63.5%) | 70 (67.3%) | 304 (59.3%) | |
| Unemployed | 1 (0.7%) | 7 (5.1%) | 2 (1.6%) | 2 (1.9%) | 12 (2.3%) | |
| Marital status | ||||||
| Married | 92 (62.6%) | 88 (64.7%) | 81 (64.3%) | 58 (55.8%) | 319 (62.2%) | 1(0.2%) |
| Widowed | 16 (10.9%) | 14 (10.3%) | 17 (13.5%) | 13 (12.5%) | 60 (11.7%) | |
| Divorced | 32 (21.8%) | 24 (17.6%) | 21 (16.7%) | 23 (22.1%) | 100 (19.5%) | |
| Separated | 1 (0.7%) | 1 (0.7%) | 0 (0.0%) | 0 (0.0%) | 2 (0.4%) | |
| Never married | 6 (4.1%) | 6 (4.4%) | 6 (4.8%) | 9 (8.7%) | 27 (5.3%) | |
| Domestic partnership | 0 (0.0%) | 2 (1.5%) | 1 (0.8%) | 1 (1%) | 4 (0.8%) | |
| Family history of dementia/subjective memory decline | ||||||
| Mother | 58 (39.5%) | 71 (52.2%) | 68 (54%) | 52 (50%) | 249 (48.5%) | 14 (2.7%) |
| Father | 24 (16.3%) | 30 (22.1%) | 40 (31.7%) | 26 (25%) | 120 (23.4%) | 31 (6%) |
| 1 or more siblings | 19 (12%) | 14 (11.3%) | 21 (16.7%) | 15 (14.5%) | 69 (12.5%) | 88 (17.2%) |
| Children | 0 (0.0%) | 0 (0.0%) | 0 (0.0%) | 0 (0.0%) | 0 (0.0%) | 133 (25.9%) |
TABLE 4.
Continuous descriptive values for randomized individuals by study site.
| Baton Rouge | Dallas | Kansas City | St. Louis | Total | Missing/ unknown | |||||||
|---|---|---|---|---|---|---|---|---|---|---|---|---|
| N (%) | Mean (SD) | N (%) | Mean (SD) | N (%) | Mean (SD) | N (%) | Mean (SD) | N (%) | Mean (SD) | Min‐max | N (%) | |
| Age (years) | 147 (100%) | 68.6 (5.7) | 136 (100%) | 69.5 (6.4) | 126 (100%) | 68.14 (5.6) | 104 (100%) | 68.8 (6.3%) | 513 (100%) | 68.74 (5.9) | 60 to 84 | |
| Geriatric depression score (GDS) | 147 (100%) | 1.1 (1.1) | 135 (99.2%) | 1.4 (1.8) | 126 (100%) | 1.4 (1.5) | 104 (100%) | 1.6 (1.8) | 512 (99.8%) | 1.3 (1.5) | 0 to 9 | 1 (0.2%) |
| MMSE score | 147 (100%) | 29.1 (0.9) | 136 (100%) | 29.1 (1.1) | 126 (100%) | 29.2 (0.9) | 104 (100%) | 28.9 (1.1) | 513 (100%) | 29.0 (1.0) | 25 to 30 | |
| Systolic blood pressure (mmHg) | 147 (100%) | 135.2 (16.1) | 136 (100%) | 143.0 (14.5) | 126 (100%) | 133.3 (14.3) | 104 (100%) | 138.7 (16.2) | 513 (100%) | 137.5 (15.7) | 109 to 188 | |
| Diastolic blood pressure (mmHg) | 147 (100%) | 77.3 (6.6) | 136 (100%) | 81.8 (7.7) | 126 (100%) | 80.9 (6.7) | 104 (100%) | 77.1 (7.0) | 513 (100%) | 79.3 (7.3) | 56 to 116 | |
| Currently receiving treatment for HTN | 115 (78.2%) | 80 (58.8%) | 99 (78.6%) | 70 (67.3%) | 364 (71.0%) | 118 (23.0%) | ||||||
The average age of randomized participants was 68.7 (±5.9) years; 63% were female, most were White (84.6%), 73.1% had a college education, 59.3% reported being retired, and 62.2% were married. The proportion of demographic variables among those enrolled/consented differed significantly by site, including the number of males and females (χ2 [3] = 12.99, P < 0.005), number of Hispanic/LatinX (χ2 [3] = 10.81, P < 0.01) (Fisher's exact), reported race (χ2 [12] = 41.08, P < 0.0001) (Fisher's exact), education level (χ2 [18] = 35.1, P < 0.01) (Fisher's exact), and employment status (χ2 [9] = 25.77, P < 0.01). Post hoc analyses show that the St. Louis site consented a significantly smaller proportion of males than the other three sites (P < 0.001), and the Dallas site consented a significantly larger proportion of Hispanic/LatinX individuals (P < 0.0001). St. Louis consented a significantly larger proportion of African Americans (P < 0.0000), while Dallas consented a significantly larger proportion of individuals who reported being employed full‐time (P < 0.0001) and a smaller proportion of individuals who reported being retired (P < 0.0001) than the other three sites. After controlling for multiple comparisons, there were no significant differences between sites for education level.
3.5. Informal interviews with study coordinators
Baton Rouge (Pennington Biomedical Research Center) had ∼1000 older adults that are followed up with annually by a physician as part of an annual research evaluation. Some of these individuals may have been invited to participate in the rrAD trial based on information that they provided at their annual assessment (ie, potentially meet inclusion/exclusion criteria). This may have resulted in a lower screen fail rate and higher rate of consent and randomization for those citing a physician as a referral source. The Baton Rouge site also maintains a database of ∼3500 past study participants who have indicated that they can be recruited for new/ongoing trials. Participants in the databases were contacted in waves via mail/email to limit the number of potentially interested participants being screened and to reduce waiting times and loss of interest in study participation.
Dallas primarily used radio ads and a televised investigator interview that aired on the morning news approximately half‐way through the recruitment period. Although their response was good, this approach resulted in many individuals lost to follow‐up, as the research team was not able to return calls inquiring about study participation quickly enough. The Dallas site also held talks at local libraries and health fairs and attempted to increase diverse recruitment by regularly setting up a booth at churches after service.
St. Louis utilized a Volunteer for Health database of research volunteers available through the Washington University School of Medicine Clinical and Translational Science Award (CTSA) Center as a recruitment source. The database was customized to include individuals in the target age range and diagnosis of hypertension. They partnered with the local Alzheimer's Association chapter to distribute literature about the rrAD trial. The St. Louis site promoted the study through paid advertisements in a local newspaper that served the African American community, at health fairs, and other community events. Advertisements and flyers were designed specifically to promote the study among older African Americans.
Kansas City site operates within the University of Kansas Medical Center's Alzheimer's’ Disease Research Center. Within the center, the recruitment team maintains a database of ∼10,000 older adults in the Kansas City area. This database allowed investigators to send recruitment materials (email) to individuals in the database who met certain inclusion/exclusion criteria prior to phone screening.
4. DISCUSSION
Clinical trial recruitment is commonly cited as a significant barrier to advancing our understanding of cognitive health interventions. 1 , 2 , 3 , 4 In the rrAD trial, four clinical research centers randomized 513 participants ages 65 to 80 years with cardiovascular and dementia risk factors into pharmacological and physical activity interventions aimed at reducing the risk of cognitive decline and AD. The study randomized 80% of its goal of 640 individuals and achieved its enrollment goal of including ∼20% minorities. Recruitment yield was 15.5% of total screened individuals randomized to participate in the trial. Across the four sites, the most cited referral source was email, followed by interviews/editorials on the radio, television, local newspapers, newsletters, or magazine articles. However, the referral method that brought in the largest number of contacts (email) did not result in the greatest yield of consented or eligible participants. The sources that yielded the greatest likelihood of a consent were professional referrals (ie, physician), social media, and mail/phone contact from study site. The greatest yield of eligible/randomized participants came from non‐professional contacts and mail/phone contact from a site. This suggests that sites may need focus on more selective referral sources such as using contact mailing and phone lists rather than more widely viewed recruitment sources such as social media or TV/radio advertisements.
Most participants were excluded during the phone screening process for reporting a BP that was either above or below the study criteria, being too active, or a lack of a family member with dementia or memory concerns. The largest proportion of consented participants was excluded because they were deemed inappropriate for the study by the investigator, or they did not have hypertension. Those individuals randomized (N = 513), as compared to those who were ineligible for the study after consenting, were not significantly different in age; however, an individual was more likely to be eligible if they reported being of Hispanic/LatinX origin or identified as non‐White. However, this finding was likely due to Type I error, but still, Hispanic/LatinX did report higher rates of cognitive concerns than other White individuals. 11
A diverse set of recruitment approaches were utilized for the rrAD trial. Some researchers feel the means by which participants are recruited may impact the outcome of a research study. 12 For example, recruiting participants from a database of individuals who had previously participated in research may result in better adherence to protocols as they are familiar with the research process. However, having a unified recruitment strategy across a multisite study may not be feasible or may not result in a generalizable sample as certain strategies, including the language used in advertisements or the hosting media, may be more attractive to certain segments of the population more than others. 13 Thus, the use of unique strategies at each site may have resulted in the most generalizable sample possible, as some individuals were recruited from databases, others from the local community at large. The rrAD trial recruitment results also suggest that certain sources of referrals (ie, direct mailings/phone calls from a site) may yield more eligible participants than other more widely distributed sources (ie, TV/radio or print advertising). Limited information is available on the best means of recruiting older adult participants as such information is often not reported. 14 , 15 When examined, a variety of sources are often used to recruit participants into exercise and vascular trials, as found for the rrAD trial. 2 , 16 Previous exercise trials cited a variety of sources, including electronic health records 17 , 18,word of mouth 16 , 17 , 19 , print and electronic flyer 16 , 17 , press media 16 , 17 and promotional events 16 , 19 . There are limited publications on the recruitment of individuals into vascular health trials, with the main sources cited being electronic health records and Medicare/Medicaid records. 20 As with rrAD, the most successful source may be dependent on inclusion/exclusion criteria and clinical trial requirements. 2 , 14 , 16 Currently, the field lacks high‐quality evidence on the effectiveness of different approaches. 2 , 14 , 15 , 16 , 19
Approximately 16% of individuals were excluded because they reported their BP did not meet the study criteria. Another 11% of individuals were too active, and 6.3% did not have a family history of dementia or subjective memory decline. Of these study criteria, only one, family history or subjective memory decline, could have potentially been amended to increase the number of participants consented. Other adjustments to the study to decrease the time requirements or increase the number of study testing/intervention sites (each 1.2%) may have also improved enrollment. 21 However, research on participation in exercise interventions has shown that individuals are more likely to participate if the intervention site is closer to home and the intervention is shorter in duration. 22 , 23 , 24 It is unclear whether the same is true for non‐exercise or combined trials. Despite this, the rrAD randomization yield (15.6%) was higher than previously conducted trials looking at the effect of exercise on cognition/brain health. 5 , 25
Individuals recruited for rrAD were more likely to be randomized if they identified with a racial or ethnic minoritized community. The Hispanic/LatinX population represents the second largest ethnic group in the United States but constitutes a relatively small proportion of older adults (∼8.8%). 26 The rrAD trial achieved less than half this proportion, with only 3.5% of those randomized identified as Hispanic/LatinX. Individuals identifying as African American/Black represent 9.3% of the US population and were 12.7% of those randomized in rrAD. 27 The St. Louis site was able to recruit a high percentage of African Americans using tailored messaging and collaboration with community organizations. Research suggests that successful recruitment, enrollment, and retention across racially and ethnically diverse individuals require tailored procedures to enhance success. 28 , 29 Long‐term institutional commitment to inclusion has helped to overcome known barriers to participation. 30 Unlike most 5 , the HABLE study successfully enrolled over 1700 older adult Hispanic/Latinx participants to explore health and the aging brain using a community‐based participatory research (CBPR) approach. 31 Overall, successful recruitment of older adult AD/and non‐AD trials may require a novel recruitment model that (1) invests in extensive community‐based efforts to promote research participation and (2) develops a centralized and integrated recruitment operations. 2 , 31
4.1. Limitations
Several limitations of this study should be noted. First, race and ethnic identity were not collected until after consent was obtained. Therefore, we could not determine associations with inclusion or exclusion criterion during phone screening and their association with recruitment or referral sources. Second, we were unable to determine the impact of amendments (see supplement) to the inclusion/exclusion criteria on recruitment as we did not know whether a new recruitment record was created or if the existing record was amended when eligibility criteria were changed for potentially eligible individuals. In addition, individual source recruitment data on each participant (eg, exact newspaper, flyer, or event attended) were not collected. However, we did attempt to provide supplemental information on our recruitment efforts using open‐ended questions to study coordinators to characterize the most helpful strategies. We also lacked information on the distribution of participants recruited from outreach through our research centers versus community outreach efforts and how this might have influenced recruitment yields. Even so, these two methods are often synergistic. Often, the most important strategy for successful recruitment is being prepared to handle large call volumes, having courteous and well‐trained center personnel able to phone screen and inform adequately, and having community outreach staff that is deployed with cultural competence. 2 , 16 Finally, a cost analysis detailing the cost to acquire a potential participant for the trial was not possible because the necessary financial records were not kept. 32 Previous studies in similar populations reported the cost (ie, advertisement, staff time, retention) of recruiting a randomized individual to be in the range of US$103 to $939, with the cost of targeting unique and individuals from socioeconomically disadvantaged communities to be much higher ($2000). 2 , 5 , 16 , 33 , 34 , 35
4.2. Future considerations
Recruitment of large, randomized control trials with multiple inclusion/exclusion criteria is challenging. Overall, there appears to be a lack of understanding of all of the barriers and facilitators of research participation among older adults and especially those from minoritized communities. 36 For the rrAD trial, utilization of a registry or database of past study participants or those interested in research participation was the most fruitful method of recruiting eligible study participants. Thus, creating and maintaining this type of database may be advisable to decrease staff burden for recruitment and to increase the number of individuals reached without undue effort. Partnering with or being a part of a NIH‐designated AD research center is also helpful for building study visibility and referral of aging participants for trials, though such sites are also to be subject to recruiting bias, as data from the National Alzheimer Coordinating Center (U01 AG016976) similarly reflect a predominance of White, well‐educated individuals.
For research sites building a recruitment database or trying to attract new potential participants, an increase in the overall presence and visibility of the research team within the community is advisable. 31 This could include a regular presence at community events, including churches, community council/development committees, fairs, and other events using staff who are like the populations of interest in terms of race/ethnicity. This type of recruitment effort may help to increase the diversity of those who are aware of and interested in participating in research, 2 , 28 , 29 , 37 although such procedures were only reported by two rrAD sites. Nevertheless, the recruitment teams at these sites had the impression that these special efforts facilitated the recruitment of potential participants who have historically been underrepresented in clinical research. Another recruitment approach could include the development of relationships with primary care physicians to include CBPR approaches. 31 For example, the Dallas Heart Study used local barber shops for the recruitment of racial or ethnically minoritized populations. 38 This type of recruitment effort may help to increase interest in studies where a study physician is required to prescribe/monitor a participant's medication, as the individual could feel more comfortable participating if his/her primary care doctor felt participating was a good course of treatment.
Study recruitment is costly. Some large trials suggest ∼20% of the study budget should be dedicated to recruitment. 39 For the rrAD trial ∼7% of the proposed budget at each site was dedicated for recruitment. Additional funds from an administrative supplement were acquired in 2017. These funds included $50,000 per year to support personnel and $15,000 for additional recruitment costs per site ($260,000 total per year). The additional recruitment funds were used to (1) plan and implement a wide range of community outreach activities (eg, presentations to local churches, senior centers, health clubs, racial or ethnically minoritized organizations) with the goal of increasing public awareness of and interest in the trial; (2) develop and use internet‐based tools (Facebook and Twitter) to target specific populations; (3) organize and coordinate recruitment activities in collaboration with American Heart Association, Alzheimer's Association, Young Men's Christian Association (YMCA) and other organizations committed to promoting rrAD; (4) communicate and work with local healthcare professionals to increase referrals; and (5) significantly increase phone screening numbers to 30 to 35 per week at each site to meet recruitment goals. Thus, it is possible that a larger initial budget for study recruitment/advertising could have helped the study achieve the planned recruitment goals earlier on. A larger staffing budget may also be necessary to deal with influxes of study inquiries following a targeted recruitment effort such as media announcement or TV interview. Finally, keeping detailed financial records for recruitment could help studies to better develop recruitment budgets for future trials as they would know the approximate cost to acquire a study participant. 32
5. CONCLUSION
Overall, findings from the rrAD trial suggest that utilization of professional referrals (ie, physician), email from a listserv or registry, and/or an investigator interview or editorial should be used to yield consented participants. However, the greatest yield of eligible/randomized participants came from non‐professional contacts and mail/phone contacts from a site. Future trials should include special efforts on these recruitment efforts. Features such as a larger recruitment budget and diverse research staff to increase representation of minoritized individuals may also increase yield.
CONFLICT OF INTEREST STATEMENT
The authors report no conflicts of interest. Author disclosures are available in the supporting information.
Supporting information
Supporting Information
Supporting Information
Supporting Information
ACKNOWLEDGMENTS
This study was supported by the National Institutes of Health grants R01 AG49749, R24 AG063724, and KL2TR002367. NCT Registration: NCT0291366
Szabo‐Reed AN, Hall T, Vidoni ED, et al. Recruitment methods and yield rates for a multisite clinical trial exploring risk reduction for Alzheimer's disease (rrAD). Alzheimer's Dement. 2023;9:e12422. 10.1002/trc2.12422
REFERENCES
- 1. Caldieraro‐Bentley AJ, Kelechi TJ, Treat‐Jacobson D, Mueller M. Challenges in recruitment of persons with peripheral artery disease for exercise studies. J Vasc Nurs. 2018;36(3):111‐120. [DOI] [PubMed] [Google Scholar]
- 2. Vidoni ED, Bothwell RJ, Burns JM, Dwyer JR. Novel recruitment models will drive Alzheimer's trial success. Alzheimers Dement. 2018;14(1):117‐119. [DOI] [PMC free article] [PubMed] [Google Scholar]
- 3. Cummings J, Aisen P, Barton R, et al. Re‐Engineering Alzheimer clinical trials: Global Alzheimer's platform network. J Prev Alzheimers Dis. 2016;3(2):114‐120. [DOI] [PMC free article] [PubMed] [Google Scholar]
- 4. Fargo KN, Carrillo MC, Weiner MW, Potter WZ, Khachaturian Z. The crisis in recruitment for clinical trials in Alzheimer's and dementia: An action plan for solutions. Alzheimer's & dementia : the journal of the Alzheimer's Association. 2016;12(11):1113‐1115. [DOI] [PubMed] [Google Scholar]
- 5. Marsh AP, Lovato LC, Glynn NW, et al. Lifestyle interventions and independence for elders study: Recruitment and baseline characteristics. J Gerontol A Biol Sci Med Sci. 2013;68(12):1549‐1558. [DOI] [PMC free article] [PubMed] [Google Scholar]
- 6. Whitehead AL, Julious SA, Cooper CL, Campbell MJ. Estimating the sample size for a pilot randomised trial to minimise the overall trial sample size for the external pilot and main trial for a continuous outcome variable. Stat Methods Med Res. 2016;25(3):1057‐1073. [DOI] [PMC free article] [PubMed] [Google Scholar]
- 7. Fuller RK, Mattson ME, Allen JP, Randall CL, Anton RF, Babor TF. Multisite clinical trials in alcoholism treatment research: Organizational, methodological and management issues. J Stud Alcohol Suppl. 1994;12:30‐37. [DOI] [PubMed] [Google Scholar]
- 8. Grant M, Anderson P, Ashley M, et al. Developing a team for multicultural, multi‐institutional research on fatigue and quality of life. Oncol Nurs Forum. 1998;25(8):1404‐1412. [PubMed] [Google Scholar]
- 9. Rodríguez‐Torres E, González‐Pérez MM, Díaz‐Pérez C. Barriers and facilitators to the participation of subjects in clinical trials: An overview of reviews. Contemp Clin Trials Commun. 2021;23:100829. [DOI] [PMC free article] [PubMed] [Google Scholar]
- 10. Szabo‐Reed AN, Vidoni E, Binder EF, et al. Rationale and methods for a multicenter clinical trial assessing exercise and intensive vascular risk reduction in preventing dementia (rrAD Study). Contemp Clin Trials. 2019;79:44‐54. [DOI] [PMC free article] [PubMed] [Google Scholar]
- 11. Vega WA, Rodriguez MA, Gruskin E. Health disparities in the Latino population. Epidemiol Rev. 2009;31(1):99‐112. [DOI] [PMC free article] [PubMed] [Google Scholar]
- 12. Sugden NA, Moulson MC. Recruitment strategies should not be randomly selected: empirically improving recruitment success and diversity in developmental psychology research. Front Psychol. 2015;6:523‐523. [DOI] [PMC free article] [PubMed] [Google Scholar]
- 13. Blanton S, Morris DM, Prettyman MG, et al. Lessons learned in participant recruitment and retention: The EXCITE trial. Phys Ther. 2006;86(11):1520‐1533. [DOI] [PubMed] [Google Scholar]
- 14. Ridda I, MacIntyre CR, Lindley RI, Tan TC. Difficulties in recruiting older people in clinical trials: An examination of barriers and solutions. Vaccine. 2010;28(4):901‐906. [DOI] [PubMed] [Google Scholar]
- 15. Gross CP, Mallory R, Heiat A, Krumholz HM. Reporting the recruitment process in clinical trials: Who are these patients and how did they get there? Ann Intern Med. 2002;137(1):10‐16. [DOI] [PubMed] [Google Scholar]
- 16. Vidoni ED, Szabo‐Reed AN, Kang C, et al. The IGNITE trial: Participant recruitment lessons prior to SARS‐CoV‐2. Contemporary Clinical Trials Communications. 2020;20. [DOI] [PMC free article] [PubMed] [Google Scholar]
- 17. Botton CE, Santos LP, Moraes BG, et al. Recruitment methods and yield rates in a clinical trial of physical exercise for older adults with hypertension—HAEL Study: A study within a trial. BMC Med Res Method. 2022;22(1):42. [DOI] [PMC free article] [PubMed] [Google Scholar]
- 18. Huang L, Lü J, Chen N, Liu Y. Recruitment of older adults into randomized controlled trials: Issues and lessons learned from two community‐based exercise interventions in Shanghai. Journal of Sport and Health Science. 2016;5(3):308‐314. [DOI] [PMC free article] [PubMed] [Google Scholar]
- 19. Liljas AEM, Walters K, Jovicic A, et al. Strategies to improve engagement of ‘hard to reach’ older people in research on health promotion: A systematic review. BMC Public Health. 2017;17(1):349. [DOI] [PMC free article] [PubMed] [Google Scholar]
- 20. Tell GS, Fried LP, Hermanson B, Manolio TA, Newman AB, Borhani NO. Recruitment of adults 65 years and older as participants in the cardiovascular health study. Ann Epidemiol. 1993;3(4):358‐366. [DOI] [PubMed] [Google Scholar]
- 21. Pribulick M, Willams IC, Fahs PS. Strategies to reduce barriers to recruitment and participation. Online J Rural Nurs Health Care. 2010;10(1):22‐33. [PMC free article] [PubMed] [Google Scholar]
- 22. Cohen‐Mansfield J, Marx MS, Guralnik JM. Motivators and barriers to exercise in an older community‐dwelling population. J Aging Phys Act. 2003;11(2):242‐253. [Google Scholar]
- 23. Higgins TJ, Middleton KR, Winner L, Janelle CM. Physical activity interventions differentially affect exercise task and barrier self‐efficacy: A meta‐analysis. Health Psychol. 2014;33(8):891. [DOI] [PMC free article] [PubMed] [Google Scholar]
- 24. Lees FD, Clark PG, Nigg CR, Newman P. Barriers to exercise behavior among older adults: A focus‐group study. J Aging Phys Act. 2005;13(1):23‐33. [DOI] [PubMed] [Google Scholar]
- 25. Vidoni ED, Johnson DK, Morris JK, et al. Dose‐response of aerobic exercise on cognition: A community‐based, pilot randomized controlled trial. PLoS One. 2015;10(7):e0131647. [DOI] [PMC free article] [PubMed] [Google Scholar]
- 26. Bureau USC . US Census Bureau July 1 2021 Estimates. Published 2021. Accessed November 22, 2022.
- 27. America's Health Rankings analysis of America's Health Rankings composite measure. In: Foundation UH, ed. AmericasHealthRankings.org2022.
- 28. Shaw AR, Perales‐Puchalt J, Moore T, et al. Recruitment of older African Americans in Alzheimer's disease clinical trials using a community education approach. The Journal of Prevention of Alzheimer's Disease. 2022. [DOI] [PMC free article] [PubMed] [Google Scholar]
- 29. Perales‐Puchalt J, Shaw A, McGee JL, et al. Preliminary efficacy of a recruitment educational strategy on Alzheimer's disease knowledge, research participation attitudes, and enrollment among Hispanics. Hisp Health Care Int. 2020;18(3):144‐149. [DOI] [PMC free article] [PubMed] [Google Scholar]
- 30. Williams MM, Meisel MM, Williams J, Morris JC. An interdisciplinary outreach model of African American recruitment for Alzheimer's disease research. Gerontologist. 2011;51 Suppl 1(Suppl 1):S134‐141. [DOI] [PMC free article] [PubMed] [Google Scholar]
- 31. O'Bryant SE, Johnson LA, Barber RC, et al. The Health & Aging Brain among Latino Elders (HABLE) study methods and participant characteristics. Alzheimers Dement (Amst). 2021;13(1):e12202. [DOI] [PMC free article] [PubMed] [Google Scholar]
- 32. Engstrom GA, Tappen RM, Ouslander J. Costs associated with recruitment and interviewing of study participants in a diverse population of community‐dwelling older adults. Nurs Res. 2014;63(1). [DOI] [PubMed] [Google Scholar]
- 33. Ory MG, Lipman PD, Karlen PL, et al. Recruitment of older participants in frailty/injury prevention studies. Prev Sci. 2002;3(1):1‐22. [DOI] [PubMed] [Google Scholar]
- 34. Gill TM, McGloin JM, Gahbauer EA, Shepard DM, Bianco LM. Two recruitment strategies for a clinical trial of physically frail community‐living older persons. J Am Geriatr Soc. 2001;49(8):1039‐1045. [DOI] [PubMed] [Google Scholar]
- 35. Donahue PT, Grove G, Stillman C, et al. Estimating the financial costs associated with a phase III, multi‐site exercise intervention trial: Investigating gains in neurocognition in an intervention trial of exercise (IGNITE). Contemp Clin Trials. 2021;105:106401. [DOI] [PMC free article] [PubMed] [Google Scholar]
- 36. George S, Duran N, Norris K. A systematic review of barriers and facilitators to minority research participation among African Americans, Latinos, Asian Americans, and Pacific Islanders. Am J Public Health. 2014;104(2):e16‐e31. [DOI] [PMC free article] [PubMed] [Google Scholar]
- 37. Mendez‐Luck CA, Trejo L, Miranda J, Jimenez E, Quiter ES, Mangione CM. Recruitment strategies and costs associated with community‐based research in a Mexican‐origin population. Gerontologist. 2011;51 Suppl 1(Suppl 1):S94‐S105. [DOI] [PMC free article] [PubMed] [Google Scholar]
- 38. Victor RG, Haley RW, Willett DL, et al. The Dallas Heart Study: A population‐based probability sample for the multidisciplinary study of ethnic differences in cardiovascular health. Am J Cardiol. 2004;93(12):1473‐1480. [DOI] [PubMed] [Google Scholar]
- 39. Kakumanu S, Manns BJ, Tran S, et al. Cost analysis and efficacy of recruitment strategies used in a large pragmatic community‐based clinical trial targeting low‐income seniors: A comparative descriptive analysis. Trials. 2019;20(1):577. [DOI] [PMC free article] [PubMed] [Google Scholar]
Associated Data
This section collects any data citations, data availability statements, or supplementary materials included in this article.
Supplementary Materials
Supporting Information
Supporting Information
Supporting Information