

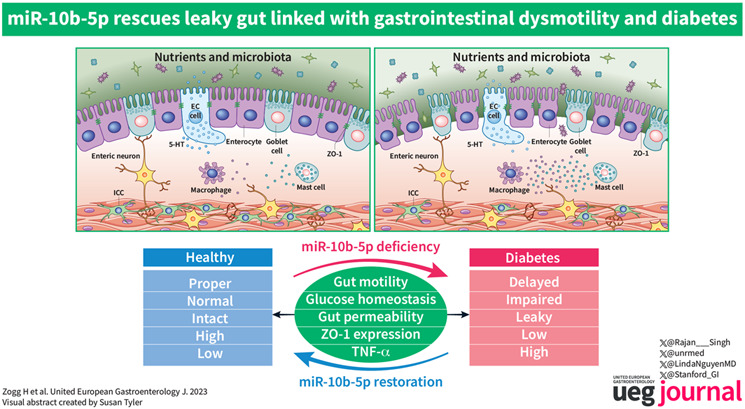
Abstract
Background/Aim
Diabetes has substantive co‐occurrence with disorders of gut‐brain interactions (DGBIs). The pathophysiological and molecular mechanisms linking diabetes and DGBIs are unclear. MicroRNAs (miRNAs) are key regulators of diabetes and gut dysmotility. We investigated whether impaired gut barrier function is regulated by a key miRNA, miR‐10b‐5p, linking diabetes and gut dysmotility.
Methods
We created a new mouse line using the Mb3Cas12a/Mb3Cpf1 endonuclease to delete mir‐10b globally. Loss of function studies in the mir‐10b knockout (KO) mice were conducted to characterize diabetes, gut dysmotility, and gut barrier dysfunction phenotypes in these mice. Gain of function studies were conducted by injecting these mir‐10b KO mice with a miR‐10b‐5p mimic. Further, we performed miRNA‐sequencing analysis from colonic mucosa from mir‐10b KO, wild type, and miR‐10b‐5p mimic injected mice to confirm (1) deficiency of miR‐10b‐5p in KO mice, and (2) restoration of miR‐10b‐5p after the mimic injection.
Results
Congenital loss of mir‐10b in mice led to the development of hyperglycemia, gut dysmotility, and gut barrier dysfunction. Gut permeability was increased, but expression of the tight junction protein Zonula occludens‐1 was reduced in the colon of mir‐10b KO mice. Patients with diabetes or constipation‐ predominant irritable bowel syndrome, a known DGBI that is linked to leaky gut, had significantly reduced miR‐10b‐5p expression. Injection of a miR‐10b‐5p mimic in mir‐10b KO mice rescued these molecular alterations and phenotypes.
Conclusions
Our study uncovered a potential pathophysiologic mechanism of gut barrier dysfunction that links both the diabetes and gut dysmotility phenotypes in mice lacking miR‐10b‐5p. Treatment with a miR‐10b‐5p mimic reversed the leaky gut, diabetic, and gut dysmotility phenotypes, highlighting the translational potential of the miR‐10b‐5p mimic.
Keywords: diabetic dysmotility, gastroparesis, intestinal barrier dysfunction, irritable bowel syndrome, microRNAs
Key summary.
Summarize the established knowledge on this subject
Diabetes has substantive co‐occurrence with gut motility disorders.
Recent studies have highlighted gut barrier dysfunction as a possible core pathophysiological mechanism linking gut dysmotility to the diabetic condition. Therefore, it is of paramount importance to treat gut barrier dysfunction in patients with diabetes and gut dysmotility.
What are the significant and/or new findings of this study?
Our study has uncovered a novel mechanism linking diabetes and gut disorders through the dysregulation of gut barrier function by deficiency of miR‐10b‐5p.
We created a new mouse line with a global knockout (KO) of mir‐10b using CRISPR‐Mb3Cas12a/Mb3Cpf1. Using this mouse model, we were able to demonstrate that loss of mir‐10b resulted in the development of hyperglycemia, gut dysmotility, and gut barrier dysfunction.
In addition, our analysis of patients with irritable bowel syndrome, a known gut‐brain interaction disorder linked to a leaky gut, revealed significantly reduced miR‐10b‐5p expression.
Furthermore, we performed miRNA‐sequencing analysis from colonic mucosa from mir‐10b KO, wild type, and miR‐10b‐5p mimic injected mice to confirm (1) lack of miR‐10b‐5p in KO mice, (2) reintroduction of miR‐10b‐5p following the mimic injection, and (3) miR‐10b mimic treatment induced the restoration of dysregulated miRNAs in key pathophysiological mechanisms of motility disorders (e.g., gut dysmotility, intestinal barrier dysfunction, gut immune dysfunction, as well as visceral hypersensitivity).
This study provides strong evidence for the therapeutic potential of a miR‐10b‐5p mimic for diabetes, gut motility disorders, and gut barrier dysfunction. Our study represents a significant advancement in the understanding of the pathophysiology of these conditions and identifies potential new targets for their treatment.
INTRODUCTION
Globally, there are more than 451 million people diagnosed with diabetes. 1 This condition has been shown to have significant overlap with disorders of gut‐brain interactions (DGBIs), such as gastroparesis and slow transit constipation, with approximately 50%–60% of diabetics experiencing at least one of these disorders. 2 , 3 , 4 Dysregulated gut‐brain axis, altered gut motility, altered GI secretion, gut immune dysfunction, microbial dysbiosis, presence and degree of bile acid malabsorption, impaired glucose homeostasis, insulin resistance, and visceral hypersensitivity have all been attributed to the development of DGBIs, highlighting the heterogeneous nature of these disorders. 2 , 3 Recent studies have highlighted gut barrier dysfunction as a possible core pathophysiological mechanism linking DGBIs to the diabetic condition. 2 , 5 , 6 , 7 This is likely mediated through gut microbiota‐induced immune dysfunction, which is extremely prevalent in both conditions. 2 , 8 , 9 Therefore, it is of paramount importance that a treatment for gut barrier dysfunction become clinically available for patients with diabetes and DGBIs. Furthermore, the current therapies for gut dysmotility and diabetes merely treat the symptoms and are generally ineffective for most patients as they do not fix the pathologies present there. Fixing the cellular defects linked with the pathophysiological mechanisms of these disease states would lead to better therapeutic outcomes. microRNA (miRNA) therapeutics are promising because they are capable of triggering cellular remodeling to restore the function of key cells critical for GI motility and metabolic function. 2 , 3 , 9 , 10
Normal glucose homeostasis and gut functions require complex coordinated interplay between pancreatic cell types (e.g., pancreatic beta and alpha cells) and GI cell types, for instance, interstitial cells of Cajal (ICCs), enteric neurons, smooth muscle cells (SMCs), enteroendocrine cells, enterocytes, and immune cells. 10 , 11 , 12 Functional defects to these cells lead to diabetes and gut dysmotility. 10 , 13 , 14 , 15 , 16 , 17 Proper functioning of these cells is regulated at the transcriptional, post‐transcriptional, translational, and post‐translational levels. Additionally, regulatory RNA is essential for the regulation of each of these molecular mechanisms. Therefore, RNA‐based therapeutics may offer significant advantages over many of the traditional small molecule and protein‐based therapeutic options. 18 , 19 First, they typically are much cheaper to produce. 20 Second, they are much faster to produce. 18 , 20 Additionally, it is much easier to deliver RNA‐based therapeutics to their target cells due to the advancement of delivery mechanisms. 21 , 22 Therefore, RNA‐based drugs, such as miRNAs, have immense potential for the treatment of diabetes, DGBIs, and the leaky gut.
miRNA dysregulation has been linked to pathophysiological mechanisms of diabetes and gastrointestinal dysmotility. 11 , 23 Furthermore, miRNAs have been associated with key gut physiological and pathophysiological mechanisms such as gut motility, gastrointestinal barrier function, visceral sensation, as well as gut immune function. 12 , 13 , 14 , 15 , 16 , 17 , 23 These mechanisms are highly relevant to gut‐metabolic health, thus highlighting the importance of miRNAs in the development of diabetes and gut dysmotility conditions.
We have previously reported that a conditional loss of mir‐10b in KIT+ cells, such as pancreatic beta cells and ICCs, leads to the onset of diabetes and gut dysmotility. 16 Furthermore, our previous study found a novel miR‐10b‐KLF11‐KIT pathway responsible for the regulation of glucose homeostasis and gut motility. We demonstrated the targeting effect of miR‐10b‐5p on Krüppel‐like factor‐11 (KLF11), where miR‐10b downregulates KLF11 expression, leading to increased KIT expression. In the diabetic condition, miR‐10b‐5p is depleted leading to increased KLF11 expression, which leads to decreased KIT expression. Since KIT expression is essential for the functioning of ICCs, 24 , 25 pacemaking cells in the gut, it is of no surprise that previous studies have reported that loss of KIT+ ICCs leads to the development of gut dysmotility in both humans and mice. 26 , 27 , 28 Interestingly, when the KIT+ cell‐specific knockout (KO) mice were injected with the miR‐10b‐5p mimic, there was restoration of KIT expression and the diabetes and gut dysmotility phenotypes were rescued. 16 Taken together, it is clear that the loss of miR‐10b‐5p plays a crucial role in the development of diabetes and gut dysmotility.
While our previous studies have elucidated the role of miR‐10b‐5p in KIT+ cells, in this study we aimed to elucidate if global loss of mir‐10b led to the development of similar phenotypes as the cell‐specific conditional KO as well as elucidating if the leaky gut is linked to the development of hyperglycemia and gut dysmotility. Additionally, the loss of mir‐10b, a key regulator of cell differentiation, 29 , 30 , 31 may impact the function and/or development of smooth muscle and mucosa important for maintaining gut homeostasis; therefore, further contributing to the development of diabetes and gut dysmotility. To test these hypotheses, we created a mir‐10b global KO mouse model using CRISPR‐Mb3Cas12a/Mb3Cpf1. Using both loss‐of‐function and gain‐of‐function studies, we found that the leaky gut phenotype is a core pathophysiological mechanism linking the hyperglycemic and gut dysmotility phenotypes. Finally, we found that treating the mice with a miR‐10b‐5p mimic rescues these phenotypes and might have substantial therapeutic potential for the treatment of diabetes, gut dysmotility, and the leaky gut.
METHODS
Generation of global mir‐10b knockout mice
The Mb3Cas12 and CRISPR RNA (crRNA) were used to generate mir‐10b KO mice as previously described. 32 Since Mb3Cas12a can process and utilize its own crRNA, we used one crRNA harboring three 23‐nt spacers separated by three 20 nt direct repeats (DRs) to target the mir‐10b locus. One of the spacers was designed to target the TTV (V stands for A/C/G) protospacer adjacent motif (PAM) sequence (spacer 1) and the rest of the spacers (spacers 2 and 3) recognize the TTTV PAM sequence. The MB3Cas12a mRNA and crRNA were injected into the cytoplasm of the zygotes collected from FVB/NJ or C57BL/6J female mice previously mated with C57BL/6J males. 32 After injection, all embryos were cultured and transferred into 7–10‐week‐old female CD1 recipients to generate mir‐10b KO pups. 32 Genomic DNA samples isolated from each of the mir‐10b KO pups were sent to the Nevada Genomics Center at the University of Nevada, Reno to confirm the presence of the mir‐10b deletion. The founder with two deletions in both the 5p and 3p regions of miR‐10b was selected for further breeding. Polymerase chain reaction (PCR)‐based genotyping was then utilized to further confirm the deletion of mir‐10b in the mice. Genotyping PCR was performed using primers (10b‐1 and 10b‐2r) to find mir‐10b +/+ (217 bp), mir‐10b +/− (217 bp/174 bp), and mir‐10b −/− (174 bp). The primer sequences are listed in Table S3. The mice included in this study have a C57BL6 background. The analysis was compiled from age‐ and sex‐matched mice from multiple litters. The Institutional Animal Care and Use Committee at the University of Nevada, Reno (UNR) approved all experimental procedures. The colony of mice included in this study was housed in a centralized animal facility at the UNR Animal Resources. UNR is fully accredited by the American Association for Accreditation of Laboratory Animal Care (AAALAC) International. All mice were housed under pathogen‐free conditions on a 12‐h light/dark cycle with food and water ad libitum. Mice were euthanized by inhaling CO2, followed by cervical dislocation. A ventral midline incision was made, and the whole GI tract was carefully excised. These procedures were in accordance with the National Institutes of Health guidelines for the care and use of laboratory animals.
Reverse transcription quantitative polymerase chain reaction (RT‐qPCR)
Small RNAs were isolated from human serum samples using the mirVana miRNA Isolation Kit (Ambion) as previously described. 16 RNA quality and quantity were evaluated using a Nanodrop 2000 Spectrophotometer (Thermo Fisher Scientific), then RNAs were polyadenylated using Poly(A) Polymerase (Ambion) followed by reverse transcribed using SuperScript IV Reverse Transcriptase (Thermo‐Fisher) as previously described. 16 All primers used for qPCR are shown in Table S3. A standard qPCR protocol was followed on a qPCR cycler qTOWER3 84 (Analytik Jena, Jena, Germany). The comparative cycle threshold method was used to compare relative transcription levels. The transcription level of each miRNA was estimated as the relative fold‐change over the control small nucleolar RNA (snoRNA) genes (Table S3). All samples were run in triplicate for each assay.
Automated western blot
Mucosa was separated from the smooth muscle tissue in the colon and homogenized in radioimmunoprecipitation assay (RIPA) buffer using an air‐cooled bead homogenizer (Bullet Blender Storm, Next Advance). The homogenate was then centrifuged at 12,000 rpm for 5 min at 4°C. The supernatant was then collected and stored at −80°C. A detergent compatible Bradford assay was then performed to measure the protein concentration of each sample. 10 μg of protein was loaded for each sample for running the automated WES (ProteinSimple) to analyze protein expression. Quantification of banding patterns was performed using Compass software (v4.0.0) for WES (ProteinSimple). All antibodies used are listed in Table S3.
In Vivo metabolic screening
Body weight and 6‐h fasting blood glucose measurements were conducted weekly. A glucose tolerance test (GTT) was performed by measuring the 6‐h fasting blood glucose levels as well as blood glucose levels at 15‐, 30‐, 60‐, 90‐, and 120‐min post glucose injection (2 g/kg body weight). An insulin tolerance test (ITT) was performed by measuring the 6‐h fasting blood glucose levels as well as blood glucose levels at 30‐, 60‐, 90‐, and 120‐min post insulin glargine Lantus (0.6 IU/kg) injection. 16 Area under the curve (AUC) analysis for both GTT and ITT was performed using GraphPad Prism 9 software.
In vivo functional gastrointestinal motility tests
Whole gut transit time was conducted by oral gavaging Evans blue solution into the mice as previously reported. 16 Overnight‐fasted mice received an intragastric gavage of a semi‐liquid solution containing 5% Evans blue, 0.9% NaCl, and 0.5% methylcellulose in 1 × PBS (100 mL/20 g body weight). The mice were then monitored every 10 min until a fecal pellet containing the Evans blue solution was expelled. The time from oral gavage until the time of Evans blue containing pellet expulsion was considered the whole gut transit time.
Gastric emptying was measured following an oral gavage of a semi‐solid solution containing Gastrosense™750 (0.25 nmol/100 mL/25 g body weight). 16 GastroSense 750 is a near‐infrared fluorescent imaging agent used to monitor and quantify gastric emptying rates in real time using the IVIS Lumina III system (PerkinElmer). Images were taken before the administration of Gastrosense™750 to ensure no autofluorescence and then 0‐, 30‐, and 60‐min post‐gavage using an IVIS Lumina III system (PerkinElmer). Fluorescence of the images from 0‐ and 30‐min was quantified and compared to determine the percentage of gastric emptying 30 min following the oral gavage using Living Image (PerkinElmer) software. Percent gastric emptying after 30 min in each mouse was quantified as (1−[stomach fluorescence/total fluorescence] × 100).
Colonic transit time was performed on overnight‐fasted mice. A 3‐mm‐diameter glass bead was inserted into the anus and gently pushed 3 cm into the colon using a plastic Pasteur pipette covered with lubricating jelly. Colonic transit time was assessed between the time the mouse awoke from anesthesia until the expulsion of the bead. 16
Pathological analysis
To examine the microanatomy of the mir‐10b KO mice, colon cryostat sections were stained with Hematoxylin solution (ab220365) and Eosin Y Solution (ab246824) according to the manufacturer's protocol. Slides were then visualized using Keyence BZ‐X710 microscope.
The histology scores of individual mice were assessed by the sum of the scores of epithelial damage (score range, 0–4) and infiltration of inflammatory cells (score range, 0–4) as described previously. 33
Immunohistochemical and confocal microscope analysis
Murine colon tissue was analyzed through cryostat sectioned staining and confocal microscopy. Colon tissue collection and examination were performed in Krebs buffer (125.35 mmol/L NaCl, 5.9 mmol/L KCl, 1.2 mmol/L NaHPO4, 15.5 mmol/L NaHCO3, 1.2 mmol/L MgCl2, 11.5 mmol/L D‐glucose, and 2.5 mmol/L CaCl2). The fresh tissue was fixed in 4% paraformaldehyde at 4°C for 20 min, followed by overnight incubation in 1 × Tris‐ buffered saline (TBS) at 4°C. Dehydration was performed in 20% sucrose in TBS at 4°C. The tissue was trimmed and placed at 1:1 optimum cutting temperature (OCT)/20% sucrose in TBS and flash frozen by liquid nitrogen. Then, 8‐mm‐thick cryosections were used for immunohistochemistry staining experiments. The section was blocked with 0.5% Triton X‐114, 4% skim milk in TBS for 1 h at room temperature, rinsed with TBS twice for 10 min each, and then incubated with primary antibodies (Table S3) for 48 h on a rocker at 4°C. The slide was rinsed with TBS twice for 10 min each and then incubated with secondary antibodies for 2 h at room temperature. After washing with 1X TBS 3 times for 10 min each, and mounted (treated with Fluoroshield mounting medium 40, 6‐diamidino‐2‐phenylindole). Fluoview FV10‐ASW (Olympus) Viewer software (version 3.1) on an Olympus FV1000 confocal laser scanning microscope was used to image the slides.
Gut permeability assay
Mice were fasted overnight and then oral gavaged 600 mg/kg body weight of FITC‐Dextran (4 kDa). 34 4 h after the gavage, blood was collected by penetrating the retro‐orbital sinus of the mice. The blood was stored in a vial containing EDTA to prevent blood clotting. The blood was then spun down at 15,000 RPM for 15 min at 4°C in order to collect the plasma. The plasma was diluted 1:5 with 1X PBS and then fluorescence was measured at 485 nm excitation and 528 nm emission using the GloMax® Explorer plate reader.
Rescue experiments through miR‐10b mimic intervention
Intraperitoneal (IP) injection of either 500 ng/g of the miR‐10b mimic (a chemically modified double‐stranded RNA molecule that mimics endogenous miR‐10b upregulates miRNA activity), or 500 ng/g of the scramble (SCR) RNA (a negative control miRNA mimic molecule with a random sequence that has been extensively tested and validated to ensure no identifiable effects) was administered to male mir‐10b KO mice. 16 Body weight, blood glucose levels, functional gut motility procedures, and gut permeability assays were measured or performed 2‐week post‐injection.
miRNA sequencing and the Gene Ontology (GO) terms analysis
Small RNA libraries were generated using an Illumina TruSeq Small RNA Preparation Kit (Illumina) following the manufacturer's instructions. The cDNA libraries were sequenced following the vendor's instructions. The cDNA libraries were sequenced following the vendor's instructions on an Illumina Hiseq 2500 at LC Sciences. A proprietary pipeline script, ACGT101‐miR (LC Sciences) was used for small RNA sequencing data analysis. All miRNAs were annotated from pre‐miRNA and mature miRNA sequences listed in the latest release of miRbase 22.0. For the Gene Ontology (GO) enrichment analysis of target genes, two computational target prediction algorithms TargetScan and Miranda 3.3a were used. The GO terms of most abundant miRNAs and miRNA targets were annotated in the colonic mucosa of mir‐10b KO mice compared to wild type (WT) mice to enable functional interpretation of miR‐sequence data. The scatterplot of enriched GO terms was generated using the R software package.
Human specimens
All human serum samples from healthy controls (HC), patients with constipation‐predominant irritable bowel syndrome (IBS‐C) and type 2 diabetes (T2D), and clinical data were commercially obtained from the Precision for Medicine or through research collaboration with Loyola University Chicago (Table S1). The research participants included in this study were adults 45–68 years of age. All human subjects provided informed consent, and all study procedures were approved by Precision for Medicine, Loyola University Chicago, and University of Nevada, Reno institutional review boards.
Statistical analyses
The experimental data are shown as the mean ± standard deviation (SD). Two‐tailed unpaired Student's t‐test, AUC calculations, and one‐way or two‐way analysis of variance (ANOVA) were used for mouse and human experiments using GraphPad Prism 9 software. For all tests, p‐values less than 0.05 were considered statistically significant.
RESULTS
Generation of global mir‐10b knockout mice
In order to create a global (g) mir‐10b knockout (KO) mouse model that did not disrupt the host gene exons (Figure 1a), we used the Mb3Cas12a/Mb3Cpf1 endonuclease and one crRNA harboring three 23‐nt spacers separated by three 20 nt direct repeats (DRs) (Figure 1b) to target the mir‐10b locus. mir‐10b KO pups were then screened for deletion in the mir‐10b gene using Sanger sequencing (Figure 1c). The founder was selected because it had deletions in the portion of the mir‐10b gene that encodes for the mature 3’ and 5’ miRNAs. Further confirmation of the KO mice was accomplished using genotyping PCR (Figure 1d). Figure 1e represents the gross body image of the WT and KO mice. miR‐10a‐5p and miR‐10b‐5p belong to the miR‐10 family, differing only by a single nucleotide in the middle of their sequences. 35 The two miRNAs are indispensable in regulating diabetes and GI dysmotility. 16 We confirmed the miR‐10b‐5p deficiency through miRNA‐seq analysis in the colonic mucosa from mir‐10b KO mice and healthy WT mice, while miR‐10a‐5p was slightly increased in mir‐10b KO mice possibly indicating compensatory response (Figure 1f, Table S2, miR‐seq profile, public database link: https://www.ncbi.nlm.nih.gov/sra/PRJNA992019 and https://www.ncbi.nlm.nih.gov/geo/query/acc.cgi?acc=GSE236981).
FIGURE 1.
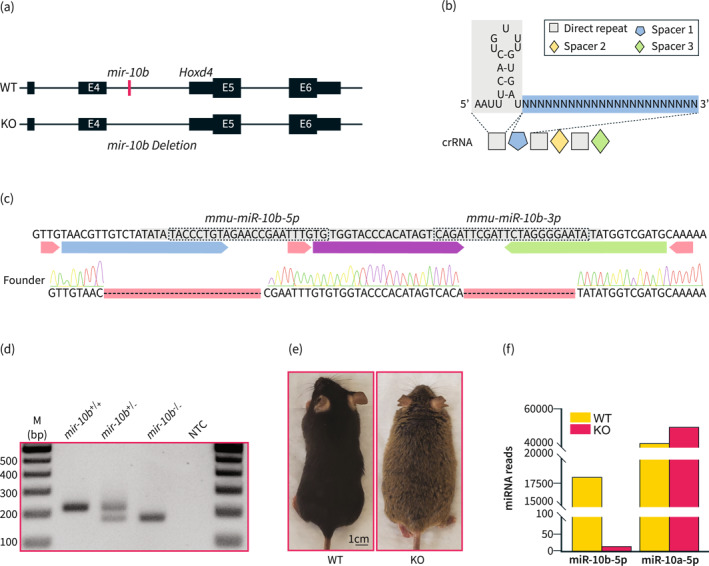
Generation of global mir‐10b knockout mice. (a) Schematic of the deletion of mir‐10b. mir‐10b is located within the intron of Hoxd4. (b) Schematic of the crRNA used to create the mir‐10b knockout (KO) mouse. (c) Sequencing results confirming the deletion of both miR‐10b‐5p and miR‐10b‐3p. (d) PCR confirmation of the mir‐10b KO mice. (e) Gross body image of 5‐month‐old male WT and 5‐month‐old male mir‐10b KO mice, which are from the same C57BL6J background. (f) miRNA reads of miR‐10b‐5p and miR‐10a‐5p in the colonic mucosa from WT and KO mice obtained by miRNA‐seq (n = 3). WT, wild type.
Knockout of mir‐10b leads to body weight gain and impaired glucose homeostasis
Further, we wanted to see if the global loss of mir‐10b leads to obesity and hyperglycemia similar to the Kit+ cell specific conditional mir‐10b KO mice. We found that male mice had significantly increased body weight gain when compared to their WT counterparts (Figure 2a). However, while we do see an increase in body weight in the female mir‐10b KO mice, the change was not significant compared to WT mice (Figure 2a). Additionally, we found that both male and female mir‐10b KO mice developed significantly increased blood glucose levels after 20 weeks of age, possibly indicating a hyperglycemic condition (Figure 2b). To further confirm if the mir‐10b KO mice developed impaired glucose homeostasis, we performed GTT and ITT, respectively (Figure 2c–f). While only males had significantly impaired glucose tolerance, both male and female mir‐10b KO mice developed insulin resistance, as evidenced by significantly increased AUC (Figure 2d,f). GTT analysis of female mir‐10b KO mice also showed that these mice have impaired glucose tolerance at 60, 90 and 120 min after glucose injection. Taken together, these data suggest that a global loss of mir‐10b leads to the development of impaired glucose homeostasis in both male and female mice. Furthermore, we investigated the susceptibility of mir‐10b KO mice to high‐fat and high‐sucrose diet (HFHD), a typical western diet, induction of obesity and hyperglycemia. We fed both WT and KO mice with a HFHSD for a period of 12 weeks and measured their body weight and fasting blood glucose levels (Figure S1a,b). Our findings demonstrated that KO mice fed with HFHSD gain body weight at a faster rate and experience an earlier onset of hyperglycemia compared with WT mice fed with HFHSD. These results suggest that mir‐10b KO mice are more susceptible to developing obesity and hyperglycemia when exposed to a HFHSD diet.
FIGURE 2.
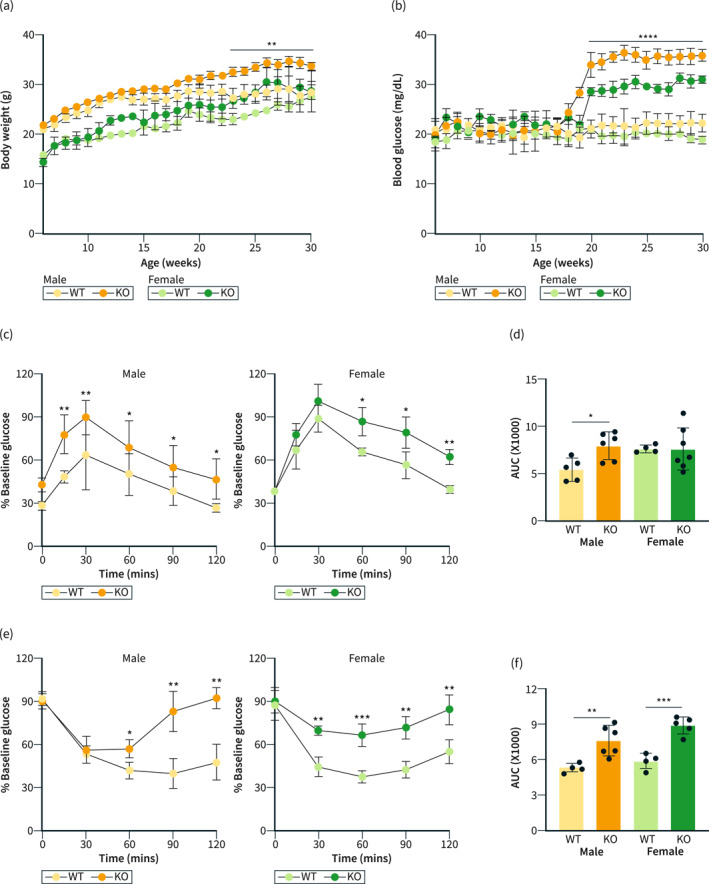
Knockout of mir‐10b leads to body weight gain and impaired glucose homeostasis. (a) Body weight comparison of both male and female mir‐10b knockout (KO) and WT mice. (b) Fasting blood glucose comparison of both male and female KO and WT mice. (c) Glucose tolerance tests of both male and female KO and WT mice. (d) AUC from (c). (e) Insulin tolerance tests of both male and female KO and WT mice. (f) AUC from (e). n = 4–7 per condition for each experiment. Error bar indicates mean ± SD, 2‐way analysis of variance (ANOVA). *p < 0.05; **p < 0.01; ***p < 0.001; ****p < 0.0001. WT, wild type.
mir‐10b KO mice develop delayed gut transit
It is well understood that the hyperglycemic condition is linked to gut dysmotility. 2 Therefore, we investigated whether mir‐10b KO mice also developed impaired gut motility. Interestingly, both male and female mir‐10b KO mice developed extensively delayed whole gut transit when compared to their WT counterparts, as evidenced by their significantly increased whole gut transit times (Figure 3a). Furthermore, we found that both male and female mir‐10b KO mice developed slow transit constipation, which was indicated by significantly delayed colonic transit time (Figure 3b). Finally, the significantly reduced percentage of gastric emptying in both male and female mir‐10b KO mice (Figure 3c,d) indicated the development of impaired gastric emptying. Therefore, these data indicate that KO of mir‐10b causes the onset of gut dysmotility.
FIGURE 3.
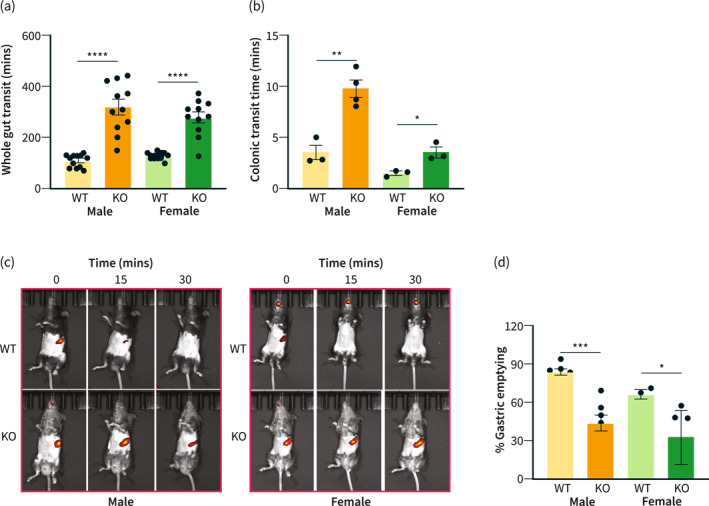
mir‐10b knockout (KO) mice develop delayed gut transit. (a) Whole gut transit time comparison of both male and female mir‐10b KO and WT mice. (b) Colonic transit time comparison of both male and female KO and WT mice. (c) Gastric emptying images of both male and female KO and WT mice. (d) Quantification of percent gastric emptying after 30 min of both male and female KO and WT mice. n = 3–11 per condition for each experiment. Error bar indicates mean ± SD. *p < 0.05; **p < 0.01; ***p < 0.001; ****p < 0.0001. WT, wild type.
Leaky gut links hyperglycemia and gut dysmotility phenotypes
Intestinal barrier dysfunction, known as leaky gut, is a common co‐occurrence with hyperglycemia and gut dysmotility. 36 , 37 Recently, leaky gut has been proposed as a core pathophysiological mechanism linking these two conditions. 2 Therefore, we hypothesized that mir‐10b KO mice may develop the leaky gut phenotype. First, we observed H&E staining of the distal colon in mir‐10b KO mice and found that the epithelium was extensively blunted, likely caused by a breakdown of the epithelial barrier and infiltration of immune cells, when compared to their WT counterparts (Figure 4a). Moreover, significant colon inflammation was observed after histology score analysis of H&E stained images of colonic tissue from WT and mir‐10b KO mice (Figure 4b), evidenced by more severe epithelial erosion, marked crypt damage, and increased inflammatory cell infiltration. Additionally, we imaged cross sections stained with the Villin and 4', 6‐diamidino‐2‐phenylindole (DAPI) antibodies of colon tissue from WT and mir‐10b KO mice (Figure 4c) and found that there was decreased Villin expression in the epithelium in mir‐10b KO mice when compared to their WT counterparts. To test the function of the epithelial barrier, we performed gut permeability assays and found that the mir‐10b KO mice had significantly increased gut permeability compared to WT mice as shown by increased FITC‐dextran in the blood serum of the mice (Figure 4d). Further, we found that there was a significant reduction of the Tight junction protein‐1, also known as Zonula occludens‐1 (ZO‐1), in the colon of mir‐10b KO mice (Figure 4e,f). Moreover, we performed a GO term analysis in the colonic mucosa of mir‐10b KO mice compared to WT mice (Figure S2). The GO term analysis of mir‐10b KO versus WT mice revealed a reduction in GO terms related to cell junction, phosphorylation, ATP binding, synapse, signal transduction, and integral component of the plasma membrane in the colonic mucosa of mir‐10b KO mice compared with WT mice. These GO terms are linked to the pathologies observed in the mir‐10b KO mice. We also performed an analysis of the correlation between miR‐10b levels, FITC gut permeability, WGTT, blood glucose levels, as well as ZO‐1 expression in KO mice compared with WT mice. We found that the miR‐10b levels were negatively correlated with gut permeability, WGTT, and blood glucose levels and positively correlated with ZO‐1 expression (Figure S3). In agreement with the mir‐10b KO constipation predominant and hyperpermeable phenotype, we found that patients with IBS‐C, a known gut motility disorder that is linked to the leaky gut, and patients with T2D had significantly reduced miR‐10b‐5p expression in serum samples as compared to healthy controls (HC) (Figure 4g,h). Taken together, these data suggest that global loss of mir‐10b leads to the development of the leaky gut phenotype, and this may also be the case for the patients with T2D and IBS‐C.
FIGURE 4.
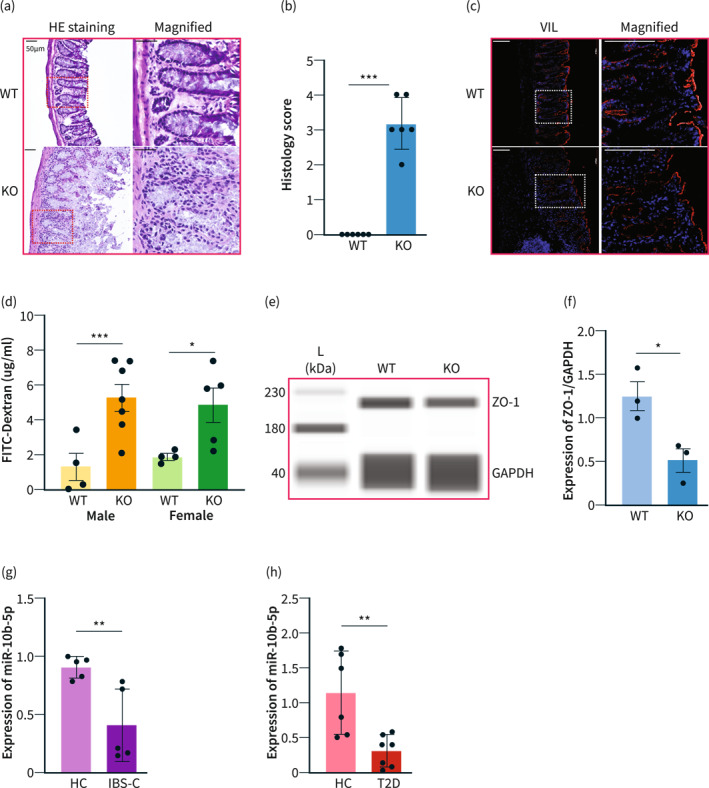
mir‐10b knockout (KO) mice develop the leaky gut phenotype. (a) H&E staining of colon cross sections from mir‐10b KO and WT 5‐month‐old male mice. Scale bars are 50 μm. (b) Histology score comparison of KO and WT 5‐month‐old male mice (n = 3) (c) Villin (red) and DAPI (blue) staining of colon cross sections from KO and WT mice. Scale bars are 100 μm. (d) Amount of FITC‐Dextran found in serum from both male and female KO and WT mice. (e), (f) Western blot and quantification of ZO‐1 expression from the colon of KO and WT male mice. (g), (h) miR‐10b‐5p expression in serum samples from patients with constipation‐predominant irritable bowel syndrome (IBS‐C) and type 2 diabetes (T2D), and healthy controls (HC) normalized by Snord15a expression (qPCR). n = 3–12 per condition for each experiment. Error bar indicates mean ± SD. *p < 0.05; ***p < 0.001.
Treatment with the miR‐10b mimic rescues the hyperglycemic, gut dysmotility, and leaky gut phenotypes
For a gain of function studies, a miR‐10b‐5p mimic was injected into 5‐month‐old mir‐10b KO mice. Additionally, a scramble (SCR) injection was given to mir‐10b KO mice as a negative control. We analyzed body weight of the mice and discovered that mir‐10b KO mice did not have significant weight reduction 2 week after the mimic injection (Figure 5a); however, there was a significant reduction in blood glucose levels 2‐week post‐injection when compared to SCR injected mice (Figure 5b). Further, the gut dysmotility phenotype was rescued by the mimic injection as evidenced by significantly improved whole gut transit time (Figure 5c), colonic transit time (Figure 5d), and percent gastric emptying (Figure 5e) when compared to the SCR injected mir‐10b KO mice. Additionally, to confirm any effect of miR‐10b mimic on whole gut transit time (WGTT) in WT mice, we injected mice biweekly with a miR‐10b‐5p mimic (500 ng/g) and performed WGTT thereafter over a 12‐week period on a bi‐weekly basis (Figure S4). We found that WT mice injected with a miR‐10b‐5p mimic maintained normal gut motility. Interestingly, the mimic injection improved gut permeability of the mir‐10b KO mice to similar levels as their WT counterparts (Figure 5f). Further, the intestinal epithelial barrier integrity and histology score was restored following the mimic injection (Figure 5f–h). Further, we found that levels of the proinflammatory cytokine TNF‐α were reduced in mir‐10b KO mice injected with the mimic as compared to non‐injected mir‐10b KO mice (Figure S5). Moreover, ZO‐1 expression was restored in mir‐10b KO mice following the mimic injection (Figure 5i,j).
FIGURE 5.
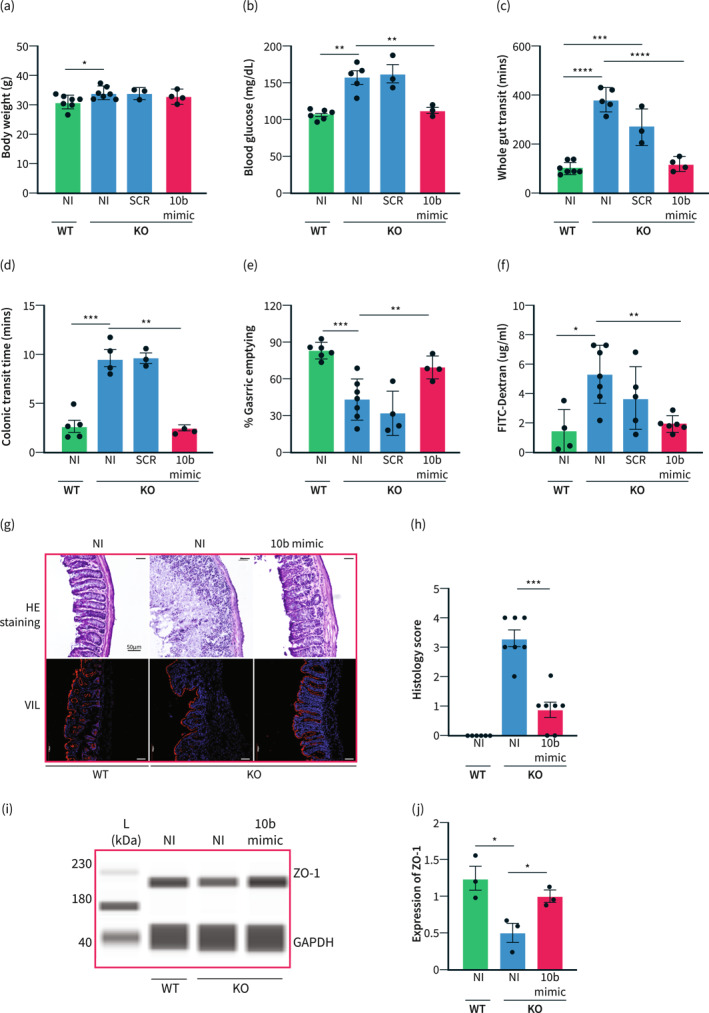
Treatment with the miR‐10b mimic rescues the hyperglycemic, gut dysmotility, and leaky gut phenotypes. (a) Body weight comparison between WT non‐injected (NI) 5‐month‐old male mice, mir‐10b knockout (KO) 5‐month‐old male mice either injected with the scramble (SCR) RNA or the miR‐10b (10b) mimic, and NI KO 5‐month‐old male mice. (b) Blood glucose comparison between NI WT, NI KO, SCR KO, and 10b mimic injected KO mice. (c) Comparison of whole gut transit time between NI WT, NI KO, SCR KO, and 10b mimic injected KO mice. (d) Colonic transit time comparison between NI WT, NI KO, SCR KO, and 10b mimic injected KO mice. (e) Comparison of percent gastric emptying between NI WT, NI KO, SCR KO, and 10b mimic injected KO mice. (f) Amount of FITC‐Dextran found in serum from NI WT, NI KO, and 10b mimic injected KO mice. (g) Top: H&E staining of colon cross sections from WT, KO, and mimic injected KO mice. Scale bars are 50 μm. Bottom: Villin (red) and DAPI (blue) staining of colon cross sections from WT, KO, and mimic injected KO mice. Scale bars are 100 μm. (h) Histology score comparison NI WT, NI KO, and 10b mimic injected KO mice (n = 3) (i), (j) Western blot and quantification of ZO‐1 expression from the colon of WT, KO, and mimic injected KO mice. n = 3‐7 per condition for each experiment. Error bar indicates mean ± SD, 1‐way ANOVA. *p < 0.05; **p < 0.01; ***p < 0.001; ****p < 0.0001.
Moreover, miRNA‐seq analysis of leaky and recovered colonic mucosa from mir‐10b KO mice injected with the mimic showed a dozen of dysregulated miRNAs that are associated with the key pathophysiological mechanisms of DGBIs such as gut dysmotility (miR‐222, ‐551b, let‐7f, −143, −145, −28a, and −375), intestinal barrier dysfunction (miR‐144, 21a, −16, −148b, −200b, −200c, and −30e), gut immune dysfunction (miR‐ 200c and −128) as well as visceral hypersensitivity (miR‐200a), highlighting the important role of miR‐10b in maintaining these pathophysiological mechanisms 12 , 13 , 14 , 15 , 16 , 17 , 23 (Figure 6a–c and Table 1). As expected, miR‐10b‐5p, but not miR‐10a‐5p, was slightly restored in mir‐10b KO mice following the miR‐10b‐5p mimic injection (Figure 6a,b; Table S2). Interestingly, the dysregulated miRNAs were restored in the colonic mucosa of mir‐10b KO mice injected with the miR‐10b‐5p mimic, reinforcing the potential translational aspects of the miR‐10b‐5p mimic in resolving these pathologies present in DGBIs (Figure 6b,c and Table 1). Most miRNAs (16 out of 21 miRNAs) dysregulated in leaky colonic mucosa in mir‐10b KO mice were restored in the mimic injected mice and are consistent with miRNAs that are known to regulate GI dysmotility, intestinal barrier dysfunction, and gut immune dysfunction. However, expression profiles of 5 miRNAs (miR‐143‐3p, 490‐3p, 29a‐3p, 125b‐3p, and 219a‐5p) are in discordance with the constipation predominant mir‐10b KO mice, suggesting that these miRNAs are specific to their pathological mechanisms in diarrhea‐predominant IBS (IBS‐D).
FIGURE 6.
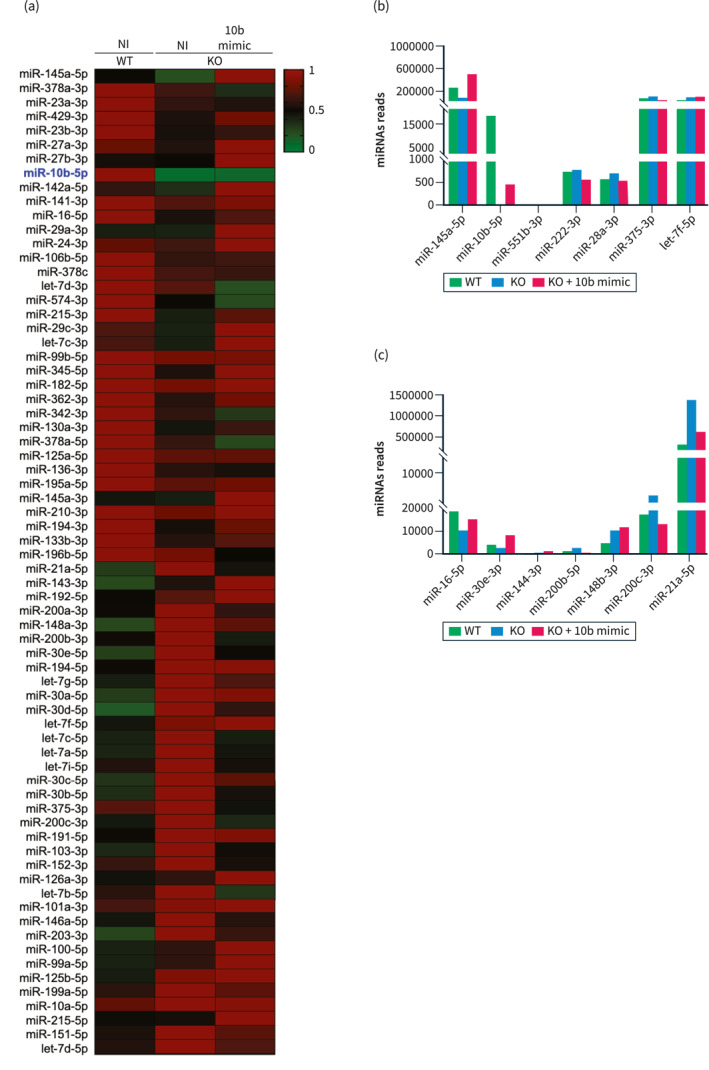
Dysregulated and restored miRNAs in the leaky gut of mir‐10b knockout (KO) male mice. (a) Heat map showing the normalized expression of differentially expressed miRNAs in the colonic mucosa from mir‐10b WT and KO 5‐month‐old mice injected with miR‐10b‐5p mimic or given no injection (NI), obtained by miRNA‐seq analysis. A heat map colors range from dark green to dark red, representing low and high expressions, respectively. (b) Dysregulated and restored miRNAs in the leaky gut of the mir‐10b KO mice and in the pathogenesis of gut dysmotility. (c) Dysregulated and restored miRNAs in the leaky gut of the mir‐10b KO mice and in the pathogenesis of intestinal barrier dysfunction.
TABLE 1.
Dysregulated and restored miRNAs in the leaky gut of the mir‐10b knockout (KO) mice and in the pathogenesis of gut dysmotility, impaired barrier function, gut immune dysfunction, and visceral hypersensitivity.
| miRNA levels in 10b KO phenotype | miRNA levels in GI disease | |||||||
|---|---|---|---|---|---|---|---|---|
| miRNA | WT | KO | KO + 10b | miRNA expression | GI disease | Species | Pathophysiological mechanisms | PMID |
| let‐7f‐5p | 51,022 | 105,438 | 112,419 | Up | STC | Human | GI dysmotility | 31757880 |
| miR‐10b‐5p | 18,057 | 14 | 469 | Down | Gastroparesis/STC | Human | GI dysmotility | 33421511 |
| miR‐28a‐3p | 589 | 719 | 556 | Up | Gastroparesis | Murine | GI dysmotility | 30285465 |
| miR‐128‐3p | 863 | 1042 | 263 | Up | STC | Human | Gut immune dysfunction | 25749934 |
| miR‐145a‐5p | 261,621 | 83,319 | 529,831 | Down | STC | Murine | GI dysmotility | 26633717 |
| miR‐222‐3p | 765 | 811 | 591 | Up | STC | Murine | GI dysmotility | 33792838 |
| miR‐375‐3p | 93,198 | 115,315 | 54,757 | Up | STC | Murine | GI dysmotility | 24507550 |
| miR‐551b‐3p | 17 | 0 | 9 | Down | STC | Murine | GI dysmotility | 31966602 |
| miR‐21a‐5p | 319,136 | 1,360, 772 | 626,341 | Up | IBS | Murine | Intestinal barrier dysfunction | 28760826 |
| miR‐148b‐5p | 99 | 169 | 165 | Up | IBS | Human | Intestinal barrier dysfunction | 34221007 |
| miR‐30e‐3p | 3650 | 2828 | 8105 | Down | ‐ | IECs | Intestinal barrier dysfunction | 27261459 |
| miR‐200b‐5p | 912 | 2681 | 783 | Up | ‐ | IECs | Intestinal barrier dysfunction | 27979826 |
| miR‐200c‐3p | 17,423 | 39,162 | 13,609 | Up | UC | Human | Intestinal barrier dysfunction gut immune dysfunction | 32569770 |
| miR‐143‐3p a | 294,225 | 954,512 | 1655.929 | Down | STC | Murine | GI dysmotility | 26633717 |
| miR‐490‐3p a | 295 | 217 | 402 | Up | IBS | Mast cells | Gut immune dysfunction | 28104984 |
| miR‐16‐5p | 19,832 | 11,045 | 15,507 | Down | IBS‐D | Human | Intestinal barrier dysfunction | 28082316 |
| miR‐144‐3p | 324 | 689 | 725 | Up | IBS‐D | Murine | Intestinal barrier dysfunction | 29258088 |
| miR‐200a‐3p | 380,522 | 754,583 | 498,181 | Up | IBS‐D | Murine | Visceral hypersensitivity | 30347941 |
| miR‐29a‐3p a | 101,418 | 95,703 | 255,114 | Up | IBS‐D | Human/mouse | Intestinal barrier dysfunction | 33093893 |
| miR‐125b‐3p a | 156 | 171 | 304 | Down | IBS‐D | Human | Intestinal barrier dysfunction | 28082316 |
| miR‐219a‐5p a | 74 | 168 | 25 | Down | IBS‐D | Human | Intestinal barrier dysfunction | 33617890 |
Abbreviations: IBS‐C, constipation‐predominant irritable bowel syndrome; IBS‐D, diarrhea‐predominant irritable bowel syndrome; STC, slow transit constipation; UC, ulcerative colitis.
In previous GI disease studies, these miRNA expression levels are in discordance with our study.
Taken together, these data suggest that the miR‐10b mimic injection is able to rescue impaired glucose homeostasis, gut dysmotility, and the leaky gut in mir‐10b KO mice. Additionally, the mimic might have potential for the treatment of diabetes, gut motility disorders, as well as other disorders linked to the leaky gut.
DISCUSSION
It has been well established that hyperglycemia and gut dysmotility have a substantial co‐occurrence 38 ; however, how these two disorders are related to the leaky gut or intestinal hyperpermeability has been largely elusive. Here we have identified a possible pathophysiological mechanism linking the two disorders to the leaky gut. Our data suggest that global loss of mir‐10b leads to impaired gut barrier function, which links the hyperglycemia and gut dysmotility phenotypes. Additionally, we have identified miR‐10b‐5p as a therapeutic target for these conditions; restoration of which might be beneficial to patients suffering from conditions linked to the leaky gut (e.g., IBS‐C).
mir‐10b KO mice have substantial weight gain likely due to the role of miR‐10b in regulating expression of apolipoprotein L6 (Apol6), which is a lipid binding protein that plays a key role in adipogenesis. 39 The observed increase in blood glucose levels, impaired glucose tolerance, as well as insulin resistance indicates the development of impaired glucose homeostasis, which may be caused by the degeneration of pancreatic β‐cells through the KLF11‐KIT pathway. 16 Further, these mice develop severe gut dysmotility as evidenced by significantly increased whole gut transit time and colonic transit time as well as delayed gastric emptying, which could be caused by the loss of KIT expression in ICCs, 16 along with degeneration of smooth muscle cells, macrophages, enteric neurons, and other cells that function to maintain gut homeostasis. Both the global mir‐10b KO and conditional KO mouse 16 models exhibited diabetes and gut dysmotility, in contrast the leaky gut phenotype was present only in global KO mice. Regarding cellular changes, the conditional KO model displayed the degeneration of KIT‐expressing cells (ICCs and pancreatic β cells), while global KO mice exhibited remodeled enterocytes and impaired barrier integrity. Most importantly, the diabetic and gut dysmotility phenotypes are linked by the development of the leaky gut phenotype as shown with the development of a disorganized epithelial barrier, increased gut permeability, and reduced ZO‐1 expression in mir‐10b KO mice.
The leaky gut phenotype might further lead to gut immune dysfunction as evidenced by upregulated miR‐200c in the colonic mucosa of mir‐10b KO mice. Our findings are in accordance with the remarkable study that demonstrated intestinal tissues from patients with ulcerative colitis and mice with colitis had increased levels of miR‐200c‐3p, which further reduced expression of occludin in enterocytes and thereby increased gut permeability. 40 Overexpression of miR‐21a‐3p, miR‐200b, and miR‐30e in the colonic mucosa from mir‐10b KO mice further reinforces that the leaky gut phenotype is associated with cellular remodeling of the epithelial barrier. Furthermore, our mir‐10b KO mice had a dysregulation of miRNAs that are associated with the key pathophysiological mechanisms of DGBIs, such as gut dysmotility and visceral hypersensitivity (Table 1). Taken together, the mir‐10b KO mouse model is likely a reliable model for studying the leaky gut and its associated conditions.
Additionally, we found that injection with a miR‐10b‐5p mimic rescued the hyperglycemic, gut dysmotility, and leaky gut phenotypes. This was evidenced by significantly improved blood glucose levels, whole gut transit time, gastric emptying, colonic transit time as well as restored gut barrier integrity, decreased gut permeability, and increased ZO‐1 expression 2‐week post‐injection. This highlights the potential of the miR‐10b‐5p mimic as a treatment option for patients suffering from conditions linked to the leaky gut, such as IBS and diabetic gastroparesis.
We found that patients with IBS‐C had reduced miR‐10b‐5p expression as compared to healthy controls, likely contributing to the intestinal barrier dysfunction. Studies have shown miRNA dysregulation in patients with IBS‐D, elucidating how dysregulated miRNAs modulate the leaky gut phenotype. Down‐regulation of miR‐16‐5p and miR‐125b‐3p aggravate intestinal barrier function in IBD‐D patients via targeting claudin‐2 (CLDN2) and cingulin (CGN), respectively. 15 miR‐144 increases intestinal permeability in IBS‐D rats via targeting occludin (OCLN) and ZO‐1. 41 miR‐200a increases visceral hyperalgesia in IBS‐D rats via targeting cannabinoid receptor 1 (CNR1) and serotonin transporter (SERT). 42 miR‐29a‐3p increases intestinal permeability in IBS‐D patients by targeting CLDN1 and nuclear factor‐κB–repressing factor (NKRF). 13 miR‐219‐5p regulates intestinal barrier function in IBS‐D by altering the expression of permeability‐associated genes including TJP1/ZO‐1, E‐cadherin (CDH1), carcinoembryonic antigen‐related cell adhesion molecule 5 (CEA‐CAM5), and catenin delta 1 (CTNND1). 17 Elucidation of miR‐10b regulation for other tight junction proteins, which are involved in both paracellular and transcellular routes regulating the leaky gut pathway and micro‐anatomical validation of these proteins in colonic tissue of patients with IBS‐C and T2D, warrants further investigation. Exploring the interplay between miRNAs and tight junction proteins would open a window for putative therapeutic candidates that might reinforce the gut barrier integrity, consequently preventing or ameliorating inflammatory reactions and potentially re‐establishing gut‐metabolic homeostasis.
Leaky gut has also been associated with immune cell infiltration. 43 , 44 The gut epithelial barrier is the front‐line defender against pathogens and their associated molecules. 45 When there is a breakdown in this defense, it allows for infiltration of these harmful bacteria and molecules, leading to an inflammatory response. 13 , 17 , 45 , 46 This chronic low‐grade inflammatory response causes the development of diabetes, gut dysmotility, as well as Parkinson's disease and has even been implicated in the exacerbated symptoms of Lupus. 47 , 48 Furthermore, once the intestinal barrier function is disturbed, food antigens and pathogens cross the gut epithelium and activate a T helper 2 cell response that results in immune activation mediated via mast cells and eosinophils. 49 , 50 Previous studies noted that in patients with IBS, an elevated number of colonic mast cells correlates with impaired intestinal barrier function and visceral hypersensitivity. 51 , 52 , 53 Therefore, it is imperative to focus future research on elucidating if mir‐10b KO mice also develop this inflammatory response and how miR‐10b regulates mast cell function. A recent study demonstrated that deficiency of miR‐10b increased susceptibility to DSS‐induced colitis. 54 This study also revealed increased intestinal permeability in mir‐10b KO mice after DSS treatment. Moreover, the study found that miR‐10b deficiency exacerbated the immune response, including infiltration of macrophages and Ly6G+ neutrophils in colon tissue, elevated serum levels of LPS, DAO, D‐LA, TNF‐α, IL‐1β, IFN‐γ, IgM, IgA, and IgG in mir‐10b KO mice after DSS treatment. 54 We confirmed the elevated TNF‐α expression in mir‐10b KO mice compared to WT. These findings, together with our study, suggest that miR‐10b deficiency leads to intestinal permeability, dysregulation of tight junctions, and gut immune dysfunction. Additionally, it is of paramount importance to uncover the role of miR‐10b‐5p in other cells essential to proper gut function and maintenance, such as neurons, PDGFRα cells, smooth muscle cells, etc. 55 , 56 , 57 , 58 , 59 , 60 Furthermore, the leaky gut phenotype should be assessed using an Ussing chamber, which is currently the gold standard for measuring epithelial barrier permeability. Moreover, the validation of the leaky gut phenotype should be conducted using a larger number of patients.
Gut microbial alterations are extensively prevalent in patients with IBS and metabolic disorders. 2 , 23 , 61 Studies noted the role of host miRNAs in shaping the gut microbiota, which might further modulate the altered gut microbiota‐linked pathophysiological mechanisms such as gut motility, gut immune dysfunction, impaired gut barrier function, and insulin resistance. 62 , 63 , 64 A landmark study showed that host fecal miRNA directly regulates gut microbial gene expression and growth. 62 This study showed that human and mouse feces contained specific miRNAs, such as miR‐155 and miR‐1224. Mice deficient in the miRNA‐processing enzyme Dicer, restricted only to intestinal epithelial cells (IECs), had reduced levels of fecal miRNA, suggesting that IECs are a significant source of miRNA in feces. Further, the authors showed that mice with Dicer knocked out specifically in IECs had gut microbiota dysbiosis and were more susceptible to induced colitis than wild‐type mice. This study provides evidence that the host can actively modulate gut microbes through miRNAs. Further, one study compared the miRNA profile of IECs from conventional and germ‐free mice and demonstrated that miR‐21‐5p is induced by commensal bacteria, with implications for intestinal barrier function regulation. 65 miR‐21‐5p is also dysregulated in our mir‐10b KO mice and might be involved in the development gut microbiota dysbiosis. Future studies are warranted to provide significant clinical insights into different facets of the host miRNA‐gut microbiota interplay and to elucidate the role of the host miRNAs in shaping gut microbial composition in gut and metabolic health.
Overall, our study has provided evidence linking diabetes and gut dysmotility to the leaky gut phenotype, with miR‐10b being a key player. This may provide new treatment options for millions of patients suffering from conditions associated with the leaky gut.
AUTHOR CONTRIBUTIONS
Conceptualization: Hannah Zogg, Rajan Singh, Seungil Ro; methodology: Hannah Zogg, Rajan Singh, Se Eun Ha; investigation: Hannah Zogg, Rajan Singh, Se Eun Ha, Zhuqing Wang, Byungchang Jin, Mariah Ha, Mirabel Dafinone, Tylar Batalon, Nicholas Hoberg, Brian T. Layden, Lara R. Dugas; writing: Hannah Zogg, Rajan Singh, Se Eun Ha, Linda Nguyen, Brian T. Layden, Lara R. Dugas, Kenton M. Sanders, Seungil Ro; resources: serum samples from healthy controls and patients with IBS‐C were commercially obtained from the Precision for Medicine and serum samples from healthy controls and participants with T2D were obtained from Loyola University Chicago, and funding acquisition: Seungil Ro, Kenton M. Sanders, Lara R. Dugas.
CONFLICT OF INTEREST STATEMENT
This author discloses the following: Seungil Ro and the University of Nevada Reno Office of Technology Transfer (serial no. 62/837,988, filed 24 April 2019) have published a PCT International Patent WO/2020/219872 entitled “Methods and compositions of miR‐10 mimics and targets thereof.” Seungil Ro is an employee and a member of the board of directors of RosVivo Therapeutics. Rajan Singh and Se Eun Ha are members of the board of directors of RosVivo Therapeutics. The remaining authors disclose no conflicts.
Supporting information
Supporting Information S1
Table S1
Table S2
Table S3
Figure S1
Figure S2
Figure S3
Figure S4
Figure S5
ACKNOWLEDGMENTS
We would like to thank Benjamin J Weigler, Doctor of Veterinary Medicine and Walt Mandeville, Doctor of Veterinary Medicine for their excellent animal services provided to the mice. Research was supported by RosVivo Therapeutics (AWD‐01‐00003158 to Seungil Ro), NIDDK (DK103055 to Seungil Ro, P01 DK41315 to Kenton M. Sanders and Seungil Ro), NIH R01‐DK111848 to Lara R. Dugas.
Zogg H, Singh R, Ha SE, Wang Z, Jin B, Ha M, et al. miR‐10b‐5p rescues leaky gut linked with gastrointestinal dysmotility and diabetes. United European Gastroenterol J. 2023;11(8):750–766. 10.1002/ueg2.12463
Hannah Zogg and Rajan Singh contributed equally to this work.
DATA AVAILABILITY STATEMENT
The data supporting this study's findings are available on request from the corresponding author. We deposited the miRNA‐sequencing data to the National Center for Biotechnology Information BioProject under accession number: PRJNA992019 (https://www.ncbi.nlm.nih.gov/sra/PRJNA992019) and Gene Expression Omnibus under accession number: GSE236981 (https://www.ncbi.nlm.nih.gov/geo/query/acc.cgi?acc=GSE236981). The miRNA sequencing profile can be accessed through the accession numbers GSM7592653 and SRX20911024 (colonic mucosa from WT mice), GSM7592654 and SRX20911019 (colonic mucosa from global mir‐10b knockout mice), and GSM7592655 and SRX20911022 (colonic mucosa global mir‐10b knockout mice injected with miR‐10b‐5p mimic), respectively.
REFERENCES
- 1. Ogurtsova K, Guariguata L, Barengo NC, Ruiz PLD, Sacre JW, Karuranga S, et al. IDF diabetes Atlas: global estimates of undiagnosed diabetes in adults for 2021. Diabetes Res Clin Pract. 2022;183:109118. 10.1016/j.diabres.2021.109118 [DOI] [PubMed] [Google Scholar]
- 2. Singh R, Zogg H, Wei L, Bartlett A, Ghoshal UC, Rajender S, et al. Gut microbial dysbiosis in the pathogenesis of gastrointestinal dysmotility and metabolic disorders. J Neurogastroenterol Motil. 2021;27(1):19–34. 10.5056/jnm20149 [DOI] [PMC free article] [PubMed] [Google Scholar]
- 3. Singh R, Zogg H, Ghoshal UC, Ro S. Current treatment options and therapeutic insights for gastrointestinal dysmotility and functional gastrointestinal disorders. Front Pharmacol. 2022;13:808195. 10.3389/fphar.2022.808195 [DOI] [PMC free article] [PubMed] [Google Scholar]
- 4. Camilleri M, Kuo B, Nguyen L, Vaughn VM, Petrey J, Greer K, et al. ACG clinical guideline: gastroparesis. Am J Gastroenterol. 2022;117(8):1197–1220. 10.14309/ajg.0000000000001874 [DOI] [PMC free article] [PubMed] [Google Scholar]
- 5. Chen RY, Kung VL, Das S, Hossain MS, Hibberd MC, Guruge J, et al. Duodenal microbiota in stunted undernourished children with enteropathy. N Engl J Med. 2020;383(4):321–333. 10.1056/NEJMoa1916004 [DOI] [PMC free article] [PubMed] [Google Scholar]
- 6. Thaiss CA, Levy M, Grosheva I, Zheng D, Soffer E, Blacher E, et al. Hyperglycemia drives intestinal barrier dysfunction and risk for enteric infection. Science. 2018;359(6382):1376–1383. 10.1126/science.aar3318 [DOI] [PubMed] [Google Scholar]
- 7. Keszthelyi D. Irritable bowel syndrome and functional dyspepsia: different ends of the same spectrum of intestinal barrier dysfunction? Am J Gastroenterol. 2021;116(7):1556. 10.14309/ajg.0000000000001174 [DOI] [PubMed] [Google Scholar]
- 8. Gehrig JL, Venkatesh S, Chang HW, Hibberd MC, Kung VL, Cheng J, et al. Effects of microbiota‐directed foods in gnotobiotic animals and undernourished children. Science. 2019;365(6449):eaau4732. 10.1126/science.aau4732 [DOI] [PMC free article] [PubMed] [Google Scholar]
- 9. Martin A, Devkota S. Hold the door: role of the gut barrier in diabetes. Cell Metab. 2018;27(5):949–951. 10.1016/j.cmet.2018.04.017 [DOI] [PubMed] [Google Scholar]
- 10. Wei L, Singh R, Ha SE, Martin AM, Jones LA, Jin B, et al. Serotonin deficiency is associated with delayed gastric emptying. Gastroenterology. 2021;160(7):2451–2466.e2419. 10.1053/j.gastro.2021.02.060 [DOI] [PMC free article] [PubMed] [Google Scholar]
- 11. Mori MA, Ludwig RG, Garcia‐Martin R, Brandão BB, Kahn CR. Extracellular miRNAs: from biomarkers to mediators of physiology and disease. Cell Metab. 2019;30(4):656–673. 10.1016/j.cmet.2019.07.011 [DOI] [PMC free article] [PubMed] [Google Scholar]
- 12. Mazzone A, Strege PR, Gibbons SJ, Alcaino C, Joshi V, Haak AJ, et al. microRNA overexpression in slow transit constipation leads to reduced NaV1.5 current and altered smooth muscle contractility. Gut. 2020;69(5):868–876. 10.1136/gutjnl-2019-318747 [DOI] [PMC free article] [PubMed] [Google Scholar]
- 13. Zhou Q, Costinean S, Croce CM, Brasier AR, Merwat S, Larson SA, et al. MicroRNA 29 targets nuclear factor‐kappaB‐repressing factor and Claudin 1 to increase intestinal permeability. Gastroenterology. 2015;148:158–169.e158. 10.1053/j.gastro.2014.09.037 [DOI] [PMC free article] [PubMed] [Google Scholar]
- 14. Zhou Q, Yang L, Larson S, Basra S, Merwat S, Tan A, et al. Decreased miR‐199 augments visceral pain in patients with IBS through translational upregulation of TRPV1. Gut. 2016;65(5):797–805. 10.1136/gutjnl-2013-306464 [DOI] [PMC free article] [PubMed] [Google Scholar]
- 15. Martinez C, Rodino‐Janeiro BK, Lobo B, Stanifer ML, Klaus B, Granzow M, et al. miR‐16 and miR‐125b are involved in barrier function dysregulation through the modulation of claudin‐2 and cingulin expression in the jejunum in IBS with diarrhoea. Gut. 2017;66(9):1537–1538. 10.1136/gutjnl-2016-311477 [DOI] [PMC free article] [PubMed] [Google Scholar]
- 16. Singh R, Ha SE, Wei L, Jin B, Zogg H, Poudrier SM, et al. miR‐10b‐5p rescues diabetes and gastrointestinal dysmotility. Gastroenterology. 2021;160(5):1662–1678.e1618. 10.1053/j.gastro.2020.12.062 [DOI] [PMC free article] [PubMed] [Google Scholar]
- 17. Mahurkar‐Joshi S, Rankin CR, Videlock EJ, Soroosh A, Verma A, Khandadash A, et al. The colonic mucosal MicroRNAs, MicroRNA‐219a‐5p, and MicroRNA‐338‐3p are downregulated in irritable bowel syndrome and are associated with barrier function and MAPK signaling. Gastroenterology. 2021;160(7):2409–2422.e2419. 10.1053/j.gastro.2021.02.040 [DOI] [PMC free article] [PubMed] [Google Scholar]
- 18. Zogg H, Singh R, Ro S. Current advances in RNA therapeutics for human diseases. Int J Mol Sci. 2022;23(5):2736. 10.3390/ijms23052736 [DOI] [PMC free article] [PubMed] [Google Scholar]
- 19. Matsui M, Corey DR. Non‐coding RNAs as drug targets. Nat Rev Drug Discov. 2017;16(3):167–179. 10.1038/nrd.2016.117 [DOI] [PMC free article] [PubMed] [Google Scholar]
- 20. Winkle M, El‐Daly SM, Fabbri M, Calin GA. Noncoding RNA therapeutics ‐ challenges and potential solutions. Nat Rev Drug Discov. 2021;20(8):629–651. 10.1038/s41573-021-00219-z [DOI] [PMC free article] [PubMed] [Google Scholar]
- 21. Yu AM, Choi YH, Tu MJ. RNA drugs and RNA targets for small molecules: principles, progress, and challenges. Pharmacol Rev. 2020;72(4):862–898. 10.1124/pr.120.019554 [DOI] [PMC free article] [PubMed] [Google Scholar]
- 22. Paunovska K, Loughrey D, Dahlman JE. Drug delivery systems for RNA therapeutics. Nat Rev Genet. 2022;23(5):265–280. 10.1038/s41576-021-00439-4 [DOI] [PMC free article] [PubMed] [Google Scholar]
- 23. Singh R, Zogg H, Ro S. Role of microRNAs in disorders of gut‐brain interactions: clinical insights and therapeutic alternatives. J Pers Med. 2021;11(10):11. 10.3390/jpm11101021 [DOI] [PMC free article] [PubMed] [Google Scholar]
- 24. Beckett EA, Ro S, Bayguinov Y, Sanders KM, Ward SM. Kit signaling is essential for development and maintenance of interstitial cells of Cajal and electrical rhythmicity in the embryonic gastrointestinal tract. Dev Dyn. 2007;236(1):60–72. 10.1002/dvdy.20929 [DOI] [PubMed] [Google Scholar]
- 25. Neve B, Fernandez‐Zapico ME, Ashkenazi‐Katalan V, Dina C, Hamid YH, Joly E, et al. Role of transcription factor KLF11 and its diabetes‐associated gene variants in pancreatic beta cell function. Proc Natl Acad Sci U S A 2005;102(13):4807–4812. 10.1073/pnas.0409177102 [DOI] [PMC free article] [PubMed] [Google Scholar]
- 26. Grover M, Bernard CE, Pasricha PJ, Lurken MS, Faussone‐Pellegrini MS, Smyrk TC, et al. Clinical‐histological associations in gastroparesis: results from the gastroparesis Clinical Research Consortium. Neuro Gastroenterol Motil. 2012;24(6):531–539.e249. 10.1111/j.1365-2982.2012.01894.x [DOI] [PMC free article] [PubMed] [Google Scholar]
- 27. Sanders KM, Ordog T, Ward SM. Physiology and pathophysiology of the interstitial cells of Cajal: from bench to bedside. IV. Genetic and animal models of GI motility disorders caused by loss of interstitial cells of Cajal. Am J Physiol Gastrointest Liver Physiol. 2002;282(5):G747–G756. 10.1152/ajpgi.00362.2001 [DOI] [PubMed] [Google Scholar]
- 28. Pasricha PJ, Grover M, Yates KP, Abell TL, Koch KL, McCallum RW, et al. Progress in gastroparesis ‐ a narrative review of the work of the Gastroparesis Clinical Research Consortium. Clin Gastroenterol Hepatol. 2022;20(12):2684–2695.e3. 10.1016/j.cgh.2022.05.022 [DOI] [PMC free article] [PubMed] [Google Scholar]
- 29. Gong X, Chao R, Wang P, Huang X, Zhang J, Zhu X, et al. Interplay of transcription factors and microRNAs during embryonic hematopoiesis. Sci China Life Sci. 2017;60(2):168–177. 10.1007/s11427-016-0168-0 [DOI] [PubMed] [Google Scholar]
- 30. Ge G, Yang D, Tan Y, Chen Y, Jiang D, Jiang A, et al. miR‐10b‐5p regulates C2C12 myoblasts proliferation and differentiation. Biosci Biotechnol Biochem. 2019;83(2):291–299. 10.1080/09168451.2018.1533805 [DOI] [PubMed] [Google Scholar]
- 31. Yang J, Wang S, Wang F, Mu X, Qu Y, Zhao Z, et al. Downregulation of miR‐10b promotes osteoblast differentiation through targeting Bcl6. Int J Mol Med. 2017;39(6):1605–1612. 10.3892/ijmm.2017.2955 [DOI] [PubMed] [Google Scholar]
- 32. Wang Z, Wang Y, Wang S, Gorzalski AJ, McSwiggin H, Yu T, et al. Efficient genome editing by CRISPR‐Mb3Cas12a in mice. J Cell Sci. 2020;133(9):133. 10.1242/jcs.240705 [DOI] [PMC free article] [PubMed] [Google Scholar]
- 33. Ito R, Shin‐Ya M, Kishida T, Urano A, Takada R, Sakagami J, et al. Interferon‐gamma is causatively involved in experimental inflammatory bowel disease in mice. Clin Exp Immunol. 2006;146(2):330–338. 10.1111/j.1365-2249.2006.03214.x [DOI] [PMC free article] [PubMed] [Google Scholar]
- 34. Rao M, Rastelli D, Dong L, Chiu S, Setlik W, Gershon MD, et al. Enteric glia regulate gastrointestinal motility but are not required for maintenance of the epithelium in mice. Gastroenterology. 2017;153(4):1068–1081.e1067. 10.1053/j.gastro.2017.07.002 [DOI] [PMC free article] [PubMed] [Google Scholar]
- 35. Griffiths‐Jones S, Grocock RJ, van Dongen S, Bateman A, Enright AJ. miRBase: microRNA sequences, targets and gene nomenclature. Nucleic Acids Res. 2006;34(90001):D140–D144. 10.1093/nar/gkj112 [DOI] [PMC free article] [PubMed] [Google Scholar]
- 36. You Q, Shen Y, Wu Y, Li Y, Liu C, Huang F, et al. Neutrophil extracellular traps caused by gut leakage trigger the autoimmune response in nonobese diabetic mice. Front Immunol. 2021;12:711423. 10.3389/fimmu.2021.711423 [DOI] [PMC free article] [PubMed] [Google Scholar]
- 37. Camilleri M, Vella A. What to do about the leaky gut. Gut. 2022;71(2):424–435. 10.1136/gutjnl-2021-325428 [DOI] [PMC free article] [PubMed] [Google Scholar]
- 38. Bytzer P, Talley NJ, Leemon M, Young LJ, Jones MP, Horowitz M. Prevalence of gastrointestinal symptoms associated with diabetes mellitus: a population‐based survey of 15,000 adults. Arch Intern Med. 2001;161(16):1989–1996. 10.1001/archinte.161.16.1989 [DOI] [PubMed] [Google Scholar]
- 39. Tan Y, Gan M, Fan Y, Li L, Zhong Z, Li X, et al. miR‐10b‐5p regulates 3T3‐L1 cells differentiation by targeting Apol6. Gene 2019;687:39–46. 10.1016/j.gene.2018.11.028 [DOI] [PubMed] [Google Scholar]
- 40. Rawat M, Nighot M, Al‐Sadi R, Gupta Y, Viszwapriya D, Yochum G, et al. IL1B increases intestinal tight junction permeability by up‐regulation of MIR200C‐3p, which degrades occludin mRNA. Gastroenterology. 2020;159(4):1375–1389. 10.1053/j.gastro.2020.06.038 [DOI] [PubMed] [Google Scholar]
- 41. Hou QK, Huang YQ, Zhu SL, Li P, Chen X, Hou Z, et al. MiR‐144 increases intestinal permeability in IBS‐D rats by targeting OCLN and ZO1. Cell Physiol Biochem. 2017;44(6):2256–2268. 10.1159/000486059 [DOI] [PubMed] [Google Scholar]
- 42. Hou QK, Huang YQ, Zhang CR, Zhu S, Li P, Chen X, et al. MicroRNA‐200a targets cannabinoid receptor 1 and serotonin transporter to increase visceral hyperalgesia in diarrhea‐predominant irritable bowel syndrome rats. J Neurogastroenterol. 2018;24(4):656–668. 10.5056/jnm18037 [DOI] [PMC free article] [PubMed] [Google Scholar]
- 43. Jang YJ, Kim WK, Han DH, Lee K, Ko G. Lactobacillus fermentum species ameliorate dextran sulfate sodium‐induced colitis by regulating the immune response and altering gut microbiota. Gut Microb. 2019;10(6):696–711. 10.1080/19490976.2019.1589281 [DOI] [PMC free article] [PubMed] [Google Scholar]
- 44. Niesler B, Kuerten S, Demir IE, Schäfer KH. Disorders of the enteric nervous system ‐ a holistic view. Nat Rev Gastroenterol Hepatol. 2021;18(6):393–410. 10.1038/s41575-020-00385-2 [DOI] [PubMed] [Google Scholar]
- 45. Shin A, Preidis GA, Shulman R, Kashyap PC. The gut microbiome in adult and pediatric functional gastrointestinal disorders. Clin Gastroenterol Hepatol. 2019;17(2):256–274. 10.1016/j.cgh.2018.08.054 [DOI] [PMC free article] [PubMed] [Google Scholar]
- 46. Marshall GUC, Warren L. A paradigm shift in pathophysiological basis of irritable bowel syndrome and its implication on treatment. J Gastroenterol Hepatol. 2019;35:712–721. 10.1111/jgh.15032 [DOI] [PubMed] [Google Scholar]
- 47. Chen QQ, Haikal C, Li W, Li JY. Gut inflammation in association with pathogenesis of Parkinson's disease. Front Mol Neurosci. 2019;12:218. 10.3389/fnmol.2019.00218 [DOI] [PMC free article] [PubMed] [Google Scholar]
- 48. Charoensappakit A, Sae‐Khow K, Leelahavanichkul A. Gut barrier damage and gut translocation of pathogen molecules in Lupus, an impact of innate immunity (macrophages and neutrophils) in autoimmune disease. Int J Mol Sci. 2022;23(15):23. 10.3390/ijms23158223 [DOI] [PMC free article] [PubMed] [Google Scholar]
- 49. Wilcz‐Villega EM, McClean S, O'Sullivan MA. Mast cell tryptase reduces junctional adhesion molecule‐A (JAM‐A) expression in intestinal epithelial cells: implications for the mechanisms of barrier dysfunction in irritable bowel syndrome. Am J Gastroenterol. 2013;108(7):1140–1151. 10.1038/ajg.2013.92 [DOI] [PubMed] [Google Scholar]
- 50. Wouters MM, Vicario M, Santos J. The role of mast cells in functional GI disorders. Gut. 2016;65(1):155–168. 10.1136/gutjnl-2015-309151 [DOI] [PubMed] [Google Scholar]
- 51. Aguilera‐Lizarraga J, Florens MV, Viola MF, Jain P, Decraecker L, Appeltans I, et al. Local immune response to food antigens drives meal‐induced abdominal pain. Nature. 2021;590(7844):151–156. 10.1038/s41586-020-03118-2 [DOI] [PMC free article] [PubMed] [Google Scholar]
- 52. Bertiaux‐Vandaele N, Youmba SB, Belmonte L, Lecleire S, Antonietti M, Gourcerol G, et al. The expression and the cellular distribution of the tight junction proteins are altered in irritable bowel syndrome patients with differences according to the disease subtype. Am J Gastroenterol. 2011;106(12):2165–2173. 10.1038/ajg.2011.257 [DOI] [PubMed] [Google Scholar]
- 53. Grover M, Berumen A, Peters S, Wei T, Breen‐Lyles M, Harmsen WS, et al. Intestinal chemosensitivity in irritable bowel syndrome associates with small intestinal TRPV channel expression. Aliment Pharmacol Ther. 2021;54(9):1179–1192. 10.1111/apt.16591 [DOI] [PubMed] [Google Scholar]
- 54. Wu Z, Pi G, Song W, Li Y. Investigation of the expression pattern and functional role of miR‐10b in intestinal inflammation. Anim (Basel). 2023;13(7):13. 10.3390/ani13071236 [DOI] [PMC free article] [PubMed] [Google Scholar]
- 55. Yarandi SS, Kulkarni S, Saha M, Sylvia KE, Sears CL, Pasricha PJ. Intestinal bacteria maintain adult enteric nervous system and nitrergic neurons via toll‐like receptor 2‐induced neurogenesis in mice. Gastroenterology. 2020;159(1):200–213.e208. 10.1053/j.gastro.2020.03.050 [DOI] [PMC free article] [PubMed] [Google Scholar]
- 56. Drumm BT, Cobine CA, Baker SA. Insights on gastrointestinal motility through the use of optogenetic sensors and actuators. J Physiol. 2022;600(13):3031–3052. 10.1113/JP281930 [DOI] [PMC free article] [PubMed] [Google Scholar]
- 57. Ha SE, Jin B, Jorgensen BG, Zogg H, Wei L, Singh R, et al. Transcriptome profiling of subepithelial PDGFRalpha cells in colonic mucosa reveals several cell‐selective markers. PLoS One. 2022;17(5):e0261743. 10.1371/journal.pone.0261743 [DOI] [PMC free article] [PubMed] [Google Scholar]
- 58. Ji S, Traini C, Mischopoulou M, Gibbons SJ, Ligresti G, Faussone‐Pellegrini M, et al. Muscularis macrophages establish cell‐to‐cell contacts with telocytes/PDGFRalpha‐positive cells and smooth muscle cells in the human and mouse gastrointestinal tract. Neuro Gastroenterol Motil. 2021;33(3):e13993. 10.1111/nmo.13993 [DOI] [PMC free article] [PubMed] [Google Scholar]
- 59. Park C, Hennig GW, Sanders KM, Cho JH, Hatton WJ, Redelman D, et al. Serum response factor‐dependent MicroRNAs regulate gastrointestinal smooth muscle cell phenotypes. Gastroenterology. 2011;141(1):164–175. 10.1053/j.gastro.2011.03.058 [DOI] [PMC free article] [PubMed] [Google Scholar]
- 60. Lee MY, Ha SE, Park C, Park PJ, Fuchs R, Wei L, et al. Transcriptome of interstitial cells of Cajal reveals unique and selective gene signatures. PLoS One. 2017;12(4):e0176031. 10.1371/journal.pone.0176031 [DOI] [PMC free article] [PubMed] [Google Scholar]
- 61. Barbara G, Feinle‐Bisset C, Ghoshal UC, Santos J, Vanner SJ, Vergnolle N, et al. The intestinal microenvironment and functional gastrointestinal disorders. Gastroenterology. 2016;150(6):1305–1318.e8. 10.1053/j.gastro.2016.02.028 [DOI] [PubMed] [Google Scholar]
- 62. Liu S, da Cunha AP, Rezende RM, Cialic R, Wei Z, Bry L, et al. The host shapes the gut microbiota via fecal MicroRNA. Cell Host Microbe. 2016;19(1):32–43. 10.1016/j.chom.2015.12.005 [DOI] [PMC free article] [PubMed] [Google Scholar]
- 63. Aguilar C, Mano M, Eulalio A. MicroRNAs at the host‐bacteria interface: host defense or bacterial offense. Trends Microbiol. 2019;27(3):206–218. 10.1016/j.tim.2018.10.011 [DOI] [PubMed] [Google Scholar]
- 64. Liu S, Weiner HL. Control of the gut microbiome by fecal microRNA. Microb Cell. 2016;3(4):176–177. 10.15698/mic2016.04.492 [DOI] [PMC free article] [PubMed] [Google Scholar]
- 65. Nakata K, Sugi Y, Narabayashi H, Kobayakawa T, Nakanishi Y, Tsuda M, et al. Commensal microbiota‐induced microRNA modulates intestinal epithelial permeability through the small GTPase ARF4. J Biol Chem. 2017;292(37):15426–15433. 10.1074/jbc.M117.788596 [DOI] [PMC free article] [PubMed] [Google Scholar]
Associated Data
This section collects any data citations, data availability statements, or supplementary materials included in this article.
Supplementary Materials
Supporting Information S1
Table S1
Table S2
Table S3
Figure S1
Figure S2
Figure S3
Figure S4
Figure S5
Data Availability Statement
The data supporting this study's findings are available on request from the corresponding author. We deposited the miRNA‐sequencing data to the National Center for Biotechnology Information BioProject under accession number: PRJNA992019 (https://www.ncbi.nlm.nih.gov/sra/PRJNA992019) and Gene Expression Omnibus under accession number: GSE236981 (https://www.ncbi.nlm.nih.gov/geo/query/acc.cgi?acc=GSE236981). The miRNA sequencing profile can be accessed through the accession numbers GSM7592653 and SRX20911024 (colonic mucosa from WT mice), GSM7592654 and SRX20911019 (colonic mucosa from global mir‐10b knockout mice), and GSM7592655 and SRX20911022 (colonic mucosa global mir‐10b knockout mice injected with miR‐10b‐5p mimic), respectively.