Abstract
Strain energy and kinetic energy in the human brain were estimated by magnetic resonance elastography (MRE) during harmonic excitation of the head, and compared to characterize the effect of loading direction and frequency on brain deformation. In brain MRE, shear waves are induced by external vibration of the skull and imaged by a modified MR imaging sequence; the resulting harmonic displacement fields are typically “inverted” to estimate mechanical properties, like stiffness or damping. However, measurements of tissue motion from MRE also illuminate key features of the response of the brain to skull loading. In this study, harmonic excitation was applied in two different directions and at five different frequencies from 20 to 90 Hz. Lateral loading induced primarily left-right head motion and rotation in the axial plane; occipital loading induced anterior-posterior head motion and rotation in the sagittal plane. The ratio of strain energy to kinetic energy (SE/KE) depended strongly on both direction and frequency. The ratio of SE/KE was approximately four times larger for lateral excitation than for occipital excitation and was largest at the lowest excitation frequencies studied. These results are consistent with clinical observations that suggest lateral impacts are more likely to cause injury than occipital or frontal impacts, and also with observations that the brain has low-frequency (∼10 Hz) natural modes of oscillation. The SE/KE ratio from brain MRE is potentially a simple and powerful dimensionless metric of brain vulnerability to deformation and injury.
Introduction
Traumatic brain injury (TBI) is widespread and important, but incompletely understood. In particular, despite a number of computational modeling studies that suggest that some people are more vulnerable to TBI than others [1–3] and that the direction of head motion and the nature of the impact affects the likelihood of injury [4–6], these predictions have not yet been confirmed by experimental observations of human brain motion in vivo. Previous studies using computational models of head impacts have identified rotation in the transverse (axial) plane as inducing higher maximum principal strains [7–10]. Using human cadaver heads, Alshareef et al. [11] used sonomicrometers to investigate the relation between impact angular velocity, impact duration, and brain displacement finding that angular rotation about the transverse plane resulted in the largest amplitude of brain displacement. However, experimental data directly assessing the effect of skull motion direction on in vivo human brain deformation remains lacking.
Magnetic resonance elastography (MRE) is a type of magnetic resonance imaging (MRI) that provides a noninvasive way to measure dynamic deformation of soft tissue in the living human brain caused by controlled, external motion of the skull [12]. In MRE, images encode harmonic displacement by phase-contrast. MRE displacement images are typically used to estimate tissue mechanical properties [13–15] but they can also be analyzed to determine patterns of brain motion and interactions between non-neural structures and the brain [15–17].
Head injury is typically associated with skull impact and MRE involves harmonic skull motion. In any dynamic system, the impulse response (in the time domain) and the response to harmonic motion (in the frequency domain) are directly related mathematically. Like other such systems, the brain exhibits dominant frequencies and oscillatory modes [18,19]. Recent work has shown that the dominant oscillatory mode occurs at a lower frequency when the head motion consists of rotation of the neck (i.e., signaling “no”; rotation in the axial plane) rather than extension of the neck (i.e., nodding “yes”; rotation in the sagittal plane) [19].
In this study, we analyze and compare strain energy and kinetic energy in the brain from MRE displacement data obtained by harmonic excitation of the head at five frequencies and in two different directions. The two directions are: (i) occipital excitation applied to the back of the skull, which produces anterior-posterior skull displacement and rotation in the sagittal plane (“yes” nodding motion); and (ii) lateral excitation applied to the right temple which produces left-right skull displacement and rotation in the axial plane (“no” neck rotation). The kinetic energy of the brain closely reflects the amplitude of loading, while strain energy is a global measure of brain deformation with the same units. When SE and KE are computed using the same harmonic displacement data, the SE/KE ratio serves as a nondimensional “transfer function” between excitation and deformation. While both SE and KE depend on loading amplitude, their ratio is expected to be relatively insensitive to differences in the amplitude of excitation between frequencies and between participants, and is applicable to both linear and angular excitation. In this study, the SE/KE ratio is a potentially simple and powerful dimensionless metric that can be used to compare the brain's response to different types of loading.
Methods
Thirty-two healthy participants without self-reported neurological conditions (16F, 16M; 20–68 years old) provided written informed consent approved by the Institutional Review Board at Washington University in St. Louis. Each participant completed an imaging session on a Siemens 3T Prisma MRI scanner while laying supine with the head positioned in a 20-channel head coil. Skull vibrations were induced with a deformable actuator placed in either the lateral or occipital position, as described in the following section, with equal numbers of male and female participants for each excitation direction (see Table 1). The total scan time, including anatomical imaging, was 45–50 min.
Table 1.
Participant characteristics grouped by excitation direction and sex. Mean±1 standard deviation with range given in parentheses
| Excitation direction | Sex | N | Age (year) | Heighta (m) | Weighta (kg) |
|---|---|---|---|---|---|
| Occipital | F | 8 | 34 ± 16 (21–65) | 1.64 ± 0.08 (1.52–1.80) | 72 ± 22 (48–116) |
| Occipital | M | 8 | 37 ± 16 (21–59) | 1.78 ± 0.05 (1.70–1.85) | 75 ± 9 (64–88) |
| Lateral | F | 8 | 27 ± 12 (20–57) | 1.66 ± 0.07 (1.52–1.73) | 69 ± 11 (59–91) |
| Lateral | M | 8 | 43 ± 15 (26–68) | 1.77 ± 0.07 (1.70–1.90) | 82 ± 10 (72–98) |
Self-reported.
Image Acquisition.
Structural images were acquired prior to application of skull vibrations. T1-weighted images were acquired using a magnetization-prepared rapid acquisition gradient echo (MPRAGE) sequence. The echo time, inversion time, and repetition time were 2.22 ms, 1000 ms, and 2400 ms, respectively. The image volume was 166 × 240 × 256 mm3 with 0.8 mm isotropic voxels. T2-weighted images were acquired using a spin echo sequence (TE = 563 ms, TR = 3200 ms) with the same imaging resolution and image volume, and with fat saturation on.
Skull vibrations were induced at 20, 30, 50, 70, and 90 Hz by acoustic pressure waves (Resoundant™, Rochester, MN) transmitted by a deformable actuator placed either at the back of the skull (occipital excitation, see Fig. 1(a)) [17] or at the right temple (lateral excitation, see Fig. 1(b)) [20]. Phase-contrast and magnitude images of the harmonically-varying displacement field were obtained at each frequency using an echo-planar imaging (EPI) sequence [12] with motion encoding gradients (MEG). Imaging parameters included 3.0 × 3.0 × 3.0 mm3 isotropic resolution; field-of-view = 240 × 240 mm2; 44 slices and 4 temporal samples acquired per period of harmonic motion. Image volumes were acquired with transverse slices relative to the MRI scanner bore and without in-plane rotation about that axis. Differences in head and neck anatomy caused slight differences in the position and orientation of the actuator relative to each participant's head. The positions and extent of the MRE imaging volumes for two representative participants are shown in Figs. 1(c) and 1(d).
Fig. 1.

Positions of the occipital actuator (a) and lateral actuator (b) are shown in the 20 channel head coil. (c, d): T1-weighted images in midsagittal plane showing approximate location of occipital actuator (OA) or lateral actuator (LA), respectively. The extent of the MRE imaging volume is denoted by solid lines and the locations of reduced MEG strength image planes used to temporally unwrap MRE phase data are denoted by dashed lines.
Immediately following this acquisition, we used the same EPI sequence to acquire MRE displacement data with reduced MEG strength on six slices within the same volume (3 mm isotropic voxels, 18 mm slice spacing, shown as dashed lines in Figs. 1(c) and 1(d) and 8 temporal samples per period. These lower-sensitivity images have minimal or no phase wrapping and were used to temporally unwrap full MEG-strength images [21]. MEG strength was adjusted at each frequency to provide appropriate motion sensitivity (μm/rad). Sensitivity values are provided in Table S2 available in the Supplemental Materials on the ASME Digital Collection. MRE acquisition time decreased with frequency: 5.25 min. for 20 Hz or 30 Hz to ∼2.75 min. at 90 Hz. Total MRE acquisition time for the five frequencies was approximately 25 min.
Image Data Processing.
Phase-contrast and magnitude MRE image sets were processed using custom Matlab code (matlab v2020a, Mathworks, Natick, MA) to provide displacement fields throughout the brain.
First, the reduced MEG strength MRE image sets were processed to estimate rigid-body motion. The brain region was isolated by applying a threshold to the voxels of MRE magnitude images to obtain a brain “mask”. The mask was applied to the corresponding MRE phase images, which were spatially unwrapped using PRELUDE [22] from FMRIB's Software Library (FSL) [23] if required. Example MRE magnitude and phase images are included in Fig. S1 available in the Supplemental Materials. The mean phase of the masked image volume was computed for each temporal sample and direction.
Next, the full MEG strength image sets were processed similarly. The brain region was identified from the MRE magnitude images obtained at 50 Hz for each participant and manually corrected using ITK-SNAP [24]. The voxels in the corresponding MRE phase images were spatially unwrapped using FSL PRELUDE for each temporal sample and direction. Full MEG strength image data was temporally unwrapped [21]. The mean phase of the masked image volume was plotted and compared to the mean phase obtained from the reduced MEG strength data. When phase differences close to multiples of 2π were observed, the phase of the entire full MEG strength image volume for that temporal sample and direction was adjusted by the appropriate multiple of 2π. This process is illustrated in Fig. S2 available in the Supplemental Materials.
After temporal unwrapping, the total displacement fields, , (80 × 80 × 44 × 3 arrays, corresponding to the complex vector at each voxel) were obtained by converting MRE phase to displacement using the motion sensitivity an extracting the first harmonic using a temporal Fourier transform. Total displacement was separated into rigid-body (bulk) displacement ( ) and wave displacement ( ) fields following Badachhape et al. [21]. The rigid-body motion was characterized by three components of rigid-body translation of a selected reference point and three components of angular displacement , where the subscript denotes x, y, or z directions—these correspond to anatomical right-left ( ), anterior-posterior ( ), and inferior-superior ( ) directions of the human head, respectively.
Wave displacement fields were smoothed using a Gaussian filter with a filter size of 3 3 3 voxels and a standard deviation of 1 voxel. Examples of total displacement and wave displacement fields are shown in Fig. 2 for representative participants undergoing occipital or lateral excitation at 50 Hz.
Fig. 2.

Relationships between total motion, rigid-body motion and wave motion. Schematics show trends in rigid- body motion for occipital excitation (a) and lateral excitation (b). Images show T1-weighted axial slices at the level of the corpus callosum, three components of total displacement at 50 Hz, and three components of wave motion ( ) after removal of rigid-body motion for two representative participants. Note different values for total motion of occipital and lateral excitation. Directions of motion are denoted by x (RL: right-left), y (AP: anterior-posterior), and z (IS: inferior-superior), computed with respect to the MRE image volume. “Head anatomy anterior lateral views” by Patrick Lynch, used under CC BY 2.5/ modified from original.
Strain ( ) was calculated from the spatial derivatives of the smoothed wave displacement field, using a quadratic polynomial fit over a 3 3 3 voxel fitting region [17]. Time-averaged octahedral shear strain (OSS) and octahedral normal strain (ONS) were calculated following McGarry et al. [25], as standard scalar measures of the magnitude of the deviatoric and volumetric strains. The components of the deviatoric shear strain tensor, were calculated by subtracting 1/3 of the trace of , i.e.
| (1) |
T1-weighted and T2-weighted images were intensity normalized [26], rigidly aligned to a standardized space (MNI-152) [27], skull-stripped [28], and processed with a deep learning-based segmentation algorithm (Spatially Localized Atlas Network Tile (SLANT)) to generate 132 brain labels, followed by a multi-atlas cortical reconstruction algorithm to refine the cortical labels [29]. These images and the brain segmentation labels were used to reconstruct the falx and tentorium [30] creating high-resolution (0.8 mm isotropic voxels) image volumes (T1-weighted, T2-weighted, and segmented) of each participant's brain, rigidly aligned to the standardized space, as shown in Figs. 3(a)–3(c). A high-resolution brain mask was created from the combined brain, falx, and tentorium image volumes. We estimated brain volume by summing the number of voxels in this high-resolution mask and multiplying by the voxel volume of 5.12 10−10 m3/voxel.
Fig. 3.
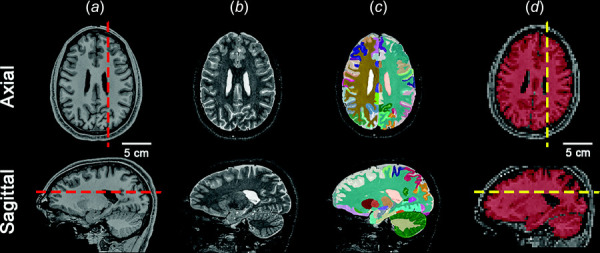
High resolution images of a representative participant's brain, rigidly registered to MNI-152 space. (a) T1-weighted, (b) T2-weighted, and (c) labeled brain, all with 0.8 mm isotropic voxels. (d) The labeled brain is rigidly registered to the MRE magnitude image volume and labels are used to create the brain tissue mask (red overlay) with 3 mm isotropic voxels. Dashed lines in (a) and (d) denote the location of the sagittal and axial slices. Slice planes in panel (d) are defined with respect to the scanner coordinate system in which images were acquired. Slice planes approximate anatomical planes but differ in each scan due to slight differences in head orientation. “Head anatomy anterior lateral views” by Patrick Lynch, used under CC BY 2.5/ modified from original.
The T2-weighted images in the standardized space (Fig. 3(b)) were then rigidly registered to the corresponding 50 Hz magnitude images using Advanced Normalization Tools (ANTs, version 2.4.0)2. The rigid registration was applied to the segmented image volume (Fig. 3(c)) with multilabel interpolation, providing a segmented image that labeled voxels in the MRE image volume. A mask was created from the registered segmented images that removed voxels identified as cerebro-spinal fluid (CSF), including the ventricles, as well as voxels identified as falx or tentorium. The intersection of this mask with the MRE mask generated a brain tissue mask (BTM) as shown in Fig. 3(d).
We applied the BTM to displacement and strain fields prior to computing energy quantities. Representative images of masked shear strain components and OSS for participants undergoing occipital or lateral excitation are shown in Fig. 4. Mean OSS was computed for each participant at each frequency and used to normalize the amplitudes of the shear strain components.
Fig. 4.
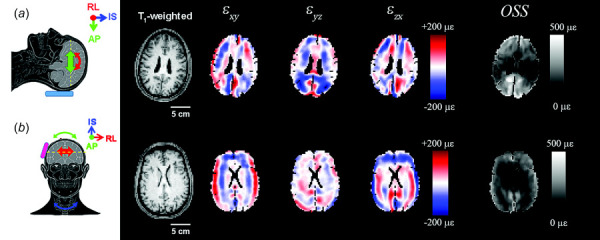
Strain components for (a) occipital and (b) lateral excitation computed from shown in Fig. 2. Images show T1-weighted axial slices at the level of the corpus callosum, three components of shear strain and time-averaged octahedral shear strain (OSS) at 50 Hz. The brain tissue mask (BTM) for each participant has been applied to the strain images.
Energy Quantities.
In a previous study [17], we observed a linear relation between the median amplitude of AP rigid-body motion and the median amplitude of OSS in participants undergoing occipital excitation at 50 Hz. We also observed that OSS decreased with frequency in four participants undergoing occipital excitation at 30, 50, and 70 Hz. We hypothesized that deviatoric strain energy, which is proportional to the square of OSS, would also be proportional to kinetic energy, which is proportional to the squared amplitude of total velocity. Both energy measures are relevant to brain injury; strain energy is a global measurement of brain deformation and thus a feature of the response associated with injury, and kinetic energy reflects the amplitude of external loading (the magnitude of the insult).
Time-averaged kinetic energy density [31], (J/m3), was computed at each voxel within the BTM, from the tensor inner product (denoted by: ) of the complex-valued harmonic velocity, and its complex conjugate,
| (2) |
and f (Hz) is the actuation frequency and the tissue density = 1000 kg/m3.
The total kinetic energy, KE (J), was computed by multiplying by the voxel volume, (2.7 10−8 m3) and summing over the voxels in the BTM
| (3) |
The time-averaged deviatoric strain energy density [31], (J/m3), is the real portion of the tensor inner product of the complex-valued deviatoric stress, and the complex conjugate of deviatoric strain, , where and and are the shear storage modulus and shear loss modulus respectively
| (4) |
Since the displacement data in this study were not optimized for determining individual brain tissue properties, we used brain mechanical property data collected at the University of Delaware [12] to estimate a mean value for at 30, 50, and 70 Hz as described in the Supplemental Materials on the ASME Digital Collection. A linear fit of these mean values as a function of frequency was used to extrapolate values for at 20 and 90 Hz (Fig. S3 available in the Supplemental Materials). The mean value for each frequency was used to estimate at each brain voxel in all participants. The total deviatoric strain energy, , was computed by multiplying by and summing over the voxels in the BTM
| (5) |
To investigate how SE and KE were related as a function of frequency and excitation direction, the dimensionless ratio of strain energy to kinetic energy, , was computed for each participant at each frequency. We used a linear mixed effects model (LMEM) [32] to analyze the effect of frequency and actuator type on . The LMEM was selected because we had repeated measurements of at different frequencies in each participant. Since is a ratio greater than 0 and because calculated SE/KE values spanned over an order of magnitude, we applied a logarithmic transformation to SE/KE. We also found that logarithmic transformation of frequency provided an approximately linear relationship between and , so we used a regression equation with as the dependent variable and and excitation direction as independent fixed variables. The model is described by the following equation
| (6) |
where the subscript refers to the participant, and subscript refers to the excitation direction used for participant . The fitted parameters are , the intercepts for excitation direction and , the slope with respect to frequency. The error term represents the residual error when fitting data from participant at the frequency s. In our study, there were only two excitation directions, so this model fits the data to three parameters and ( assumed to be the same for both actuators). Coefficients and statistics for this LMEM were determined using the fitlme function in the matlab Statistics Toolbox in matlab (v. 2020a, Mathworks, Natick, MA).
Results
Rigid-Body Displacements.
The amplitude of the AP component of rigid-body translation, was largest for occipital excitation (Fig. 5(a)) at all frequencies, while amplitudes of the RL component of were largest for lateral excitation (Fig. 5(c)). Rigid-body rotation of the brain about the RL axis was largest for occipital excitation (Fig. 5(b)) while it was larger about the AP (y) and IS (z) axes for lateral excitation (Fig. 5(d)). Components of rigid-body displacement decreased with frequency. This is a consequence of both the frequency-dependence of the force produced by each actuator, and the direct relationship between harmonic force and acceleration, which leads to displacement amplitudes that decrease with the square of the frequency for a given acceleration.
Fig. 5.
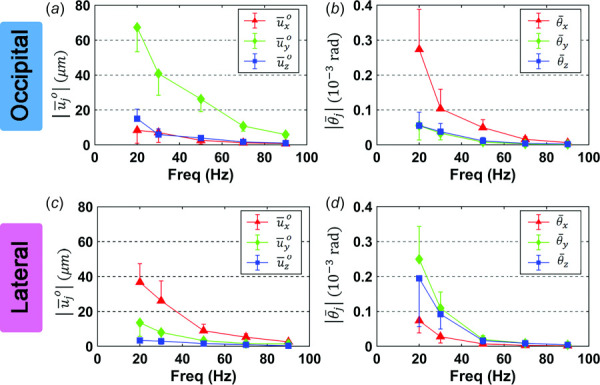
Mean amplitudes of bulk translation components and bulk rotation components for occipital excitation (a,b) and lateral excitation (c,d). Error bars indicate one standard deviation in all panels. N = 16 participants for each excitation direction.
Wave Displacements and Strains.
The amplitudes of mean wave displacement components were approximately 10–50% of the amplitudes of bulk translation at corresponding frequencies. For occipital excitation (Fig. 6(a)), the mean amplitudes and were comparable, and both were larger than . In contrast, for lateral excitation (Fig. 6(c)), the mean amplitude was larger than and . The amplitudes of all components of wave displacement decreased with frequency, as did the amplitudes of strains. The mean values of shear strain components also differed with excitation direction. The component was largest for occipital excitation (Fig. 6(b)) but smallest for lateral excitation (Fig. 6(d)), where then were the largest.
Fig. 6.
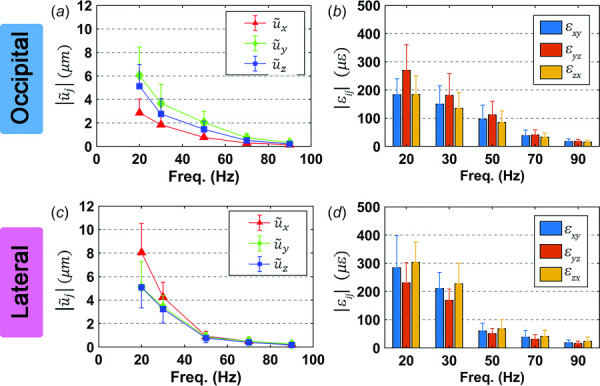
Mean amplitudes of wave displacement components and shear strains for occipital excitation (a,b) and lateral excitation (c,d). Error bars indicate one standard deviation. N = 16 participants for each excitation direction.
We compared mean OSS for each participant and frequency, grouped by excitation direction (Fig. 7(a)). Since there were substantial differences in OSS between participants and between frequencies, we normalized the shear strain components computed for each participant at each frequency by the respective mean OSS (Figs. 7(b) and 7(c)). While mean shear strain amplitudes decrease markedly with frequency for both excitation directions, the normalized amplitudes of the shear strain components are consistent across the frequencies studied but are markedly different between the two excitation directions.
Fig. 7.

(a) Mean octahedral shear strain (OSS) for occipital excitation and lateral excitation at each frequency. Mean amplitudes of each shear strain component, normalized by mean OSS for occipital excitation (b) and lateral excitation (c). Error bars indicate one standard deviation. N = 16 participants for each excitation direction.
Energy Quantities.
Kinetic energy (KE) of the brain was 4 to 5 times larger for occipital excitation than for lateral excitation (Fig. 8(a)) and decreased with frequency. The distribution of kinetic energy density, , is also more uniform within the brain for occipital excitation due to the larger values of (Fig. 8(b)), compared to lateral excitation (Fig. 8(c)). Strikingly, and in contrast, deviatoric strain energy (SE) values are higher for lateral excitation than for occipital excitation at 20 Hz, 30 Hz, and 70 Hz (Figs. 9(a) and 10(b)). The magnitude of decreases toward the center of the cerebrum; this decrease is more apparent at high frequencies, consistent with viscous damping leading to wave attenuation [16], for both types of excitation (Figs. 9(b) and 9(c)).
Fig. 8.
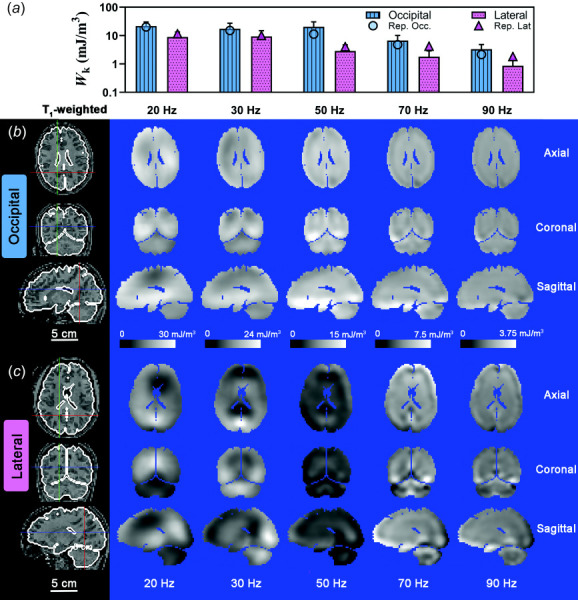
(a) Mean kinetic energy density, Wk, for each frequency and excitation direction. Error bars represent one standard deviation. A log scale is used in (a) for clarity. Symbols represent the mean for the participant data shown in (b) and (c). Spatial distribution of for representative participants due to (B) occipital excitation and (c) lateral excitation shown on three orthogonal slice planes. Note that the color scale decreases from 30 mJ/m3 at 20 Hz to 3.75 mJ/m3 at 90 Hz. Scale bar applies to all images. Locations of axial slice, coronal slice and sagittal slice are denoted by blue, red, and green line, respectively, in the corresponding T1-weighted images. Participant IDs are U01_WUSTL_0015_01 (b) and U01_WUSTL_0014_01 (c).
Fig. 9.
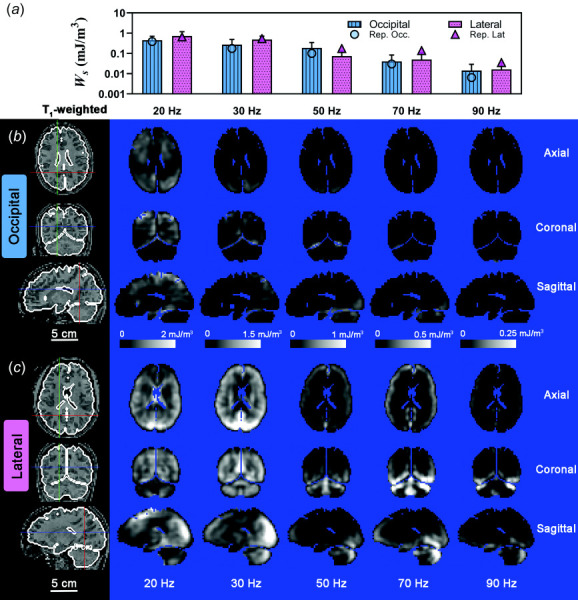
(a) Mean deviatoric strain energy density ( ), for each frequency and excitation direction. Error bars represent one standard deviation. A log scale is used in (a) for clarity. Symbols represent the mean for the participant data shown in (b) and (c). Spatial distribution of for representative participants due to (B) occipital excitation and (c) lateral excitation shown on three orthogonal slice planes. Note scale decreases from 2.0 mJ/m3 at 20 Hz to 0.25 mJ/m3 at 90 Hz. Scale bar applies to all images. Participant IDs are the same as Fig. 8.
Fig. 10.
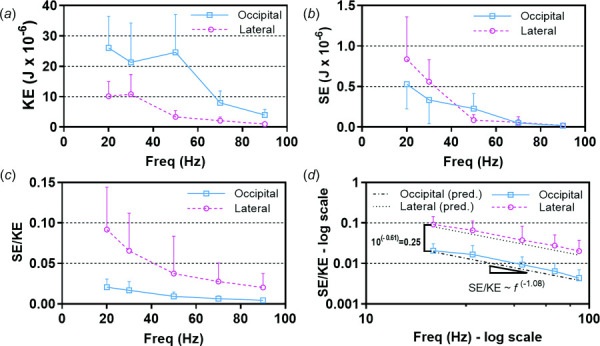
(a) Kinetic energy (KE) and (b) strain energy (SE) computed for each participant for occipital excitation and lateral excitation. (c) ratio on a linear scale and (d) ratio on a log–log scale. Dashed lines show predicted with best-fit model parameters: , , and . In all panels, values are mean for 16 participants and error bars indicate plus or minus one standard deviation.
SE decreases faster than KE with frequency for both excitation directions (Figs. 10(a) and 10(b)), so the SE/KE ratio decreases with frequency (Fig. 10(c)). When plotted on a log–log scale, the difference in SE/KE ratio between lateral excitation and occipital excitation is even more apparent (Fig. 10(d)). The parameters of the LMEM model are shown; , and . The values of and give the power law relation between SE/KE and frequency for each actuator type, i.e., and . The difference corresponds to a ratio of 100.604 = 4.02, so the SE/KE ratio for lateral excitation is about four times the SE/KE ratio for occipital excitation. The values and the slope were both significantly different from 0 (p < 0.0001) based on the F-statistic. Patterns of the SE/KE ratio for each voxel (i.e., Ws/Wk), shown in Fig. 11, illustrate how deformations in different brain regions are affected by the direction and frequency of skull motion (images are plotted on a log scale due to the large range of values).
Fig. 11.
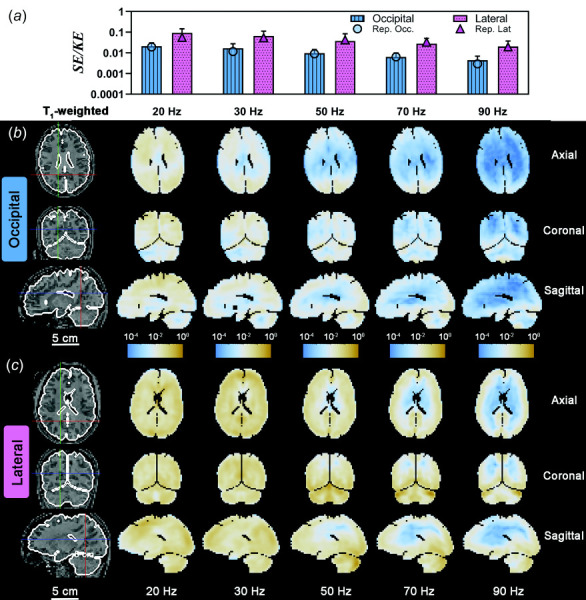
(a) Strain energy/kinetic energy ratio (SE/KE) for each frequency and excitation direction. Error bars represent one standard deviation. A log scale is used in (a) for clarity. Symbols represent the SE/KE values for the participant data shown in (b) and (c). Spatial distribution of Ws/Wk due to (b) occipital excitation and (c) lateral excitation shown on three orthogonal slice planes. Due to the large range of values, a log scale is used for image color values. Participant IDs are the same as Figs. 8 and 9.
The range of estimated brain volumes for the participants in this study was 1004–1531 cm3 and the mean brain volume was significantly lower for females than males (p < 0.05) but was not significantly different between excitation directions (see Table S1 available in the Supplemental Materials on the ASME Digital Collection). The ratio of BTM volume to estimated brain volume was 94–98%, due to removal of voxels segmented as ventricular CSF, falx, and tentorium. We tested LMEMs that included brain volume, BTM volume, and other participant-level parameters shown in Table 1 (age, sex, height, weight); these parameters were found to be nonsignificant (p > 0.2) based on the F-statistic, as described which is available in the Supplemental Materials.
Discussion
The SE/KE ratio is a simple but revealing index of the brain's mechanical vulnerability to skull motion. This ratio indicates that brain deformation is larger in response to lateral skull motion (“no” neck rotation) compared to occipital excitation (“yes” nodding). This observation implies that the brain may be more vulnerable to lateral impacts that include rotation about the IS (z) axis, as suggested by Zhang et al. [10] and Wu et al. [2].
Most computational models of TBI are time-domain simulations of skull impacts. Model predictions are typically compared to specific impacts where brain motion is recorded by imaging [33,34], high-speed biplanar X-ray of implanted markers [35], or sono-micrometers [11], and scored based on similarity to measured displacements or strains [36–41]. A similar approach should be useful in the frequency domain, as computational models of TBI can be subjected to low-amplitude vibrations over a range of frequencies and excitation directions. Strain and energy quantities such as SE, KE, and the SE/KE ratio can be compared to values observed in this study. While the current measurements (and MRE generally) are limited to very small harmonic displacements, we recently observed that such low-amplitude, harmonic displacement fields recapitulate patterns observed in impacts with much higher deformation levels [42].
The higher values of the SE/KE ratio at lower frequencies suggest that eliminating high-frequency components of impact (which are represented in peak acceleration) may be less important than reducing low-frequency components in the impulse. The decrease in SE/KE ratio with increasing frequency reflects the distribution of strain energy density. Inwardly propagating shear waves dissipate over shorter distances at higher frequencies due to the viscoelastic properties of brain tissue. Thus, shear strain amplitudes and strain energy also decrease toward the center of the brain. At low frequencies, longer shear waves propagate to the center of the brain, suggesting that injuries to interior regions of the brain [43] are more likely when impacts are of longer duration. Also noteworthy are regions of higher strain energy neighboring the stiff interior membranes, the falx cerebri and tentorium cerebelli, indicating their important role in mediating deformation.
We acknowledge some limitations. While KE is computed directly from measured displacements, SE is estimated from numerically-computed quantities. The numerical differentiation of the displacement field can introduce noise in the strain field; this noise is reduced by spatial smoothing, which may reduce computed strain energy, depending on smoothing parameters. In this study, all data were smoothed using the same smoothing kernel. We also assumed that the shear storage modulus of brain tissue is isotropic and a function of frequency only; i.e., we used the same modulus values for all participants and at all voxels. Hiscox et al. [44] developed a standard-space atlas of the viscoelastic brain tissue properties using high-resolution MRE at 50 Hz and found cortical gray matter to be less stiff than white matter or subcortical gray matter. Incorporating a heterogeneous spatial distribution of G' would alter the spatial distribution of Ws shown in Fig. 9. Thus, specific values of SE/KE may depend on smoothing parameters, voxel size, the spatial distribution of shear storage moduli, or image contrast-to-noise characteristics. Since MR image data was acquired and processed similarly for both excitation directions, we expect that the difference in SE/KE ratio between excitation directions would remain significant.
The SE/KE ratio clearly illustrates how brain deformation (strain energy, relative to the total energy transmitted to the brain) depends on the direction of excitation and on the frequency of excitation. This ratio thus has intriguing potential as a metric of vulnerability to brain injury. In this study, with a limited number of participants, brain volume, age, and sex were not identified as significant factors affecting the SE/KE ratio. Some of these parameters, such as brain volume, a surrogate measure of head size, have been predicted by computer models to affect brain deformation [1–3]. Future work, with larger cohorts specifically chosen to address the effects of head size or head shape parameters, would be warranted to further investigate the effects of these variables on the SE/KE ratio.
Funding Data
National Institute of Biomedical Imaging and Bioengineering (Grant No. R01-EB027577; Funder ID: 10.13039/100000070).
National Institute of Neurological Disorders and Stroke (Grant No. U01-NS112120; Funder ID: 10.13039/100000065).
Data Availability Statement
The image data used in this study are available for download from the Brain Biomechanics Imaging Resource website3 [12]. A complete list of participant demographics, including participant age, sex, height, weight, brain volume, and excitation direction is given in the Table S1 available in the Supplemental Materials on the ASME Digital Collection. In addition to imaging data described in this paper, diffusion-weighted images were acquired on each participant during the same imaging session. Details on the acquisition and processing of the diffusion-weighted images are provided in the Supplemental Materials.
Supplementary Material
Supplementary PDF
Footnotes
References
- [1]. Giudice, J. S. , Druzgal, T. J. , and Panzer, M. B. , 2023, “ Investigating the Effect of Brain Size on Deformation Magnitude Using Subject-Specific Finite Element Models,” J. Neurotrauma, epub. [DOI] [PubMed] [Google Scholar]
- [2]. Wu, T. , Rifkin, J. A. , Rayfield, A. C. , Anderson, E. D. , Panzer, M. B. , and Meaney, D. F. , 2022, “ Concussion Prone Scenarios: A Multi-Dimensional Exploration in Impact Directions, Brain Morphology, and Network Architectures Using Computational Models,” Ann. Biomed. Eng., 50(11), pp. 1423–1436. 10.1007/s10439-022-03085-x [DOI] [PubMed] [Google Scholar]
- [3]. Wu, S. , Zhao, W. , Wu, Z. , McAllister, T. , Hu, J. , and Ji, S. , 2023, “ Approximating Subject-Specific Brain Injury Models Via Scaling Based on Head-Brain Morphological Relationships,” Biomech. Model. Mechanobiol., 22(1), pp. 159–175. 10.1007/s10237-022-01638-6 [DOI] [PubMed] [Google Scholar]
- [4]. Bian, K. , and Mao, H. , 2020, “ Mechanisms and Variances of Rotation-Induced Brain Injury: A Parametric Investigation Between Head Kinematics and Brain Strain,” Biomech. Model. Mechanobiol., 19(6), pp. 2323–2341. 10.1007/s10237-020-01341-4 [DOI] [PubMed] [Google Scholar]
- [5]. Zhao, W. , and Ji, S. , 2017, “ Brain Strain Uncertainty Due to Shape Variation in and Simplification of Head Angular Velocity Profiles,” Biomech. Model. Mechanobiol., 16(2), pp. 449–461. 10.1007/s10237-016-0829-7 [DOI] [PMC free article] [PubMed] [Google Scholar]
- [6]. Ji, S. , Wu, S. , and Zhao, W. , 2022, “ Dynamic Characteristics of Impact-Induced Brain Strain in the Corpus Callosum,” Brain Multiphysics, 3, p. 100046. 10.1016/j.brain.2022.100046 [DOI] [Google Scholar]
- [7]. Weaver, A. A. , Danelson, K. A. , and Stitzel, J. D. , 2012, “ Modeling Brain Injury Response for Rotational Velocities of Varying Directions and Magnitudes,” Ann. Biomed. Eng., 40(9), pp. 2005–2018. 10.1007/s10439-012-0553-0 [DOI] [PubMed] [Google Scholar]
- [8]. Takhounts, E. G. , Craig, M. J. , Moorhouse, K. , McFadden, J. , and Hasija, V. , 2013, “ Development of Brain Injury Criteria (BrIC),” Stapp Car Crash J., 57, pp. 243–266. 10.4271/2013-22-0010 [DOI] [PubMed] [Google Scholar]
- [9]. Gabler, L. F. , Crandall, J. R. , and Panzer, M. B. , 2018, “ Development of a Metric for Predicting Brain Strain Responses Using Head Kinematics,” Ann. Biomed. Eng., 46(7), pp. 972–985. 10.1007/s10439-018-2015-9 [DOI] [PubMed] [Google Scholar]
- [10]. Zhang, J. , Yoganandan, N. , Pintar, F. A. , and Gennarelli, T. A. , 2006, “ Role of Translational and Rotational Accelerations on Brain Strain in Lateral Head Impact,” Biomed. Sci. Instrum., 42, pp. 501–506.https://pubmed.ncbi.nlm.nih.gov/16817658/ [PubMed] [Google Scholar]
- [11]. Alshareef, A. , Giudice, J. S. , Forman, J. , Shedd, D. F. , Reynier, K. A. , Wu, T. , Sochor, S. , Sochor, M. R. , Salzar, R. S. , and Panzer, M. B. , 2020, “ Biomechanics of the Human Brain During Dynamic Rotation of the Head,” J. Neurotrauma, 37(13), pp. 1546–1555. 10.1089/neu.2019.6847 [DOI] [PMC free article] [PubMed] [Google Scholar]
- [12]. Bayly, P. V. , Alshareef, A. , Knutsen, A. K. , Upadhyay, K. , Okamoto, R. J. , Carass, A. , Butman, J. A. , et al., 2021, “ MR Imaging of Human Brain Mechanics In Vivo: New Measurements to Facilitate the Development of Computational Models of Brain Injury,” Ann. Biomed. Eng., 49(10), pp. 2677–2692. 10.1007/s10439-021-02820-0 [DOI] [PMC free article] [PubMed] [Google Scholar]
- [13]. Sack, I. , Beierbach, B. , Hamhaber, U. , Klatt, D. , and Braun, J. , 2008, “ Non-Invasive Measurement of Brain Viscoelasticity Using Magnetic Resonance Elastography,” NMR Biomed., 21(3), pp. 265–271. 10.1002/nbm.1189 [DOI] [PubMed] [Google Scholar]
- [14]. McGarry, M. D. J. , Van Houten, E. E. W. , Johnson, C. L. , Georgiadis, J. G. , Sutton, B. P. , Weaver, J. B. , and Paulsen, K. D. , 2012, “ Multiresolution MR Elastography Using Nonlinear Inversion,” Med. Phys., 39(10), pp. 6388–6396. 10.1118/1.4754649 [DOI] [PMC free article] [PubMed] [Google Scholar]
- [15]. Yin, Z. , Romano, A. J. , Manduca, A. , Ehman, R. L. , and Huston, J. , 2018, “ Stiffness and Beyond: What MR Elastography Can Tell us About Brain Structure and Function Under Physiologic and Pathologic Conditions,” Top. Magn. Reson. Imag., 27(5), pp. 305–318. 10.1097/RMR.0000000000000178 [DOI] [PMC free article] [PubMed] [Google Scholar]
- [16]. Clayton, E. H. , Genin, G. M. , and Bayly, P. V. , 2012, “ Transmission, Attenuation and Reflection of Shear Waves in the Human Brain,” J. R. Soc. Interface, 9(76), pp. 2899–2910. 10.1098/rsif.2012.0325 [DOI] [PMC free article] [PubMed] [Google Scholar]
- [17]. Okamoto, R. J. , Romano, A. J. , Johnson, C. L. , and Bayly, P. V. , 2019, “ Insights Into Traumatic Brain Injury From MRI of Harmonic Brain Motion,” J. Exp. Neurosci., 13, p. 117906951984044. 10.1177/1179069519840444 [DOI] [PMC free article] [PubMed] [Google Scholar]
- [18]. Laksari, K. , Wu, L. C. , Kurt, M. , Kuo, C. , and Camarillo, D. C. , 2015, “ Resonance of Human Brain Under Head Acceleration,” J. R. Soc. Interface, 12(108), p. 20150331. 10.1098/rsif.2015.0331 [DOI] [PMC free article] [PubMed] [Google Scholar]
- [19]. Escarcega, J. D. , Knutsen, A. K. , Okamoto, R. J. , Pham, D. L. , and Bayly, P. V. , 2021, “ Natural Oscillatory Modes of 3D Deformation of the Human Brain In Vivo,” J. Biomech., 119, p. 110259. 10.1016/j.jbiomech.2021.110259 [DOI] [PMC free article] [PubMed] [Google Scholar]
- [20]. Smith, D. R. , Caban-Rivera, D. A. , McGarry, M. D. J. , Williams, L. T. , McIlvain, G. , Okamoto, R. J. , Van Houten, E. E. W. , et al., 2022, “ Anisotropic Mechanical Properties in the Healthy Human Brain Estimated With Multi-Excitation Transversely Isotropic MR Elastography,” Brain Multiphys., 3, p. 100051. 10.1016/j.brain.2022.100051 [DOI] [PMC free article] [PubMed] [Google Scholar]
- [21]. Badachhape, A. A. , Okamoto, R. J. , Durham, R. S. , Efron, B. D. , Nadell, S. J. , Johnson, C. L. , and Bayly, P. V. , 2017, “ The Relationship of Three-Dimensional Human Skull Motion to Brain Tissue Deformation in Magnetic Resonance Elastography Studies,” ASME J. Biomech. Eng., 139(5), p. 051002. 10.1115/1.4036146 [DOI] [PMC free article] [PubMed] [Google Scholar]
- [22]. Jenkinson, M. , 2003, “ Fast, Automated, N-Dimensional Phase-Unwrapping Algorithm,” Magn. Reson. Med., 49(1), pp. 193–197. 10.1002/mrm.10354 [DOI] [PubMed] [Google Scholar]
- [23]. Jenkinson, M. , Beckmann, C. F. , Behrens, T. E. J. , Woolrich, M. W. , and Smith, S. M. , 2012, “ Fsl,” NeuroImage, 62(2), pp. 782–790. 10.1016/j.neuroimage.2011.09.015 [DOI] [PubMed] [Google Scholar]
- [24]. Yushkevich, P. A. , Piven, J. , Hazlett, H. C. , Smith, R. G. , Ho, S. , Gee, J. C. , and Gerig, G. , 2006, “ User-Guided 3D Active Contour Segmentation of Anatomical Structures: Significantly Improved Efficiency and Reliability,” Neuroimage, 31(3), pp. 1116–1128. 10.1016/j.neuroimage.2006.01.015 [DOI] [PubMed] [Google Scholar]
- [25]. McGarry, M. D. J. , Van Houten, E. E. W. , Perriñez, P. R. , Pattison, A. J. , Weaver, J. B. , and Paulsen, K. D. , 2011, “ An Octahedral Shear Strain-Based Measure of SNR for 3D MR Elastography,” Phys. Med. Biol., 56(13), pp. N153–N164. 10.1088/0031-9155/56/13/N02 [DOI] [PMC free article] [PubMed] [Google Scholar]
- [26]. Reinhold, J. C. , Dewey, B. E. , Carass, A. , and Prince, J. L. , 2019, “ Evaluating the Impact of Intensity Normalization on MR Image Synthesis,” Proc. SPIE Int. Soc. Opt. Eng., 10949, p. 109493H. 10.1117/12.2513089 [DOI] [PMC free article] [PubMed] [Google Scholar]
- [27]. Fonov, V. S. , Evans, A. C. , McKinstry, R. C. , Almli, C. R. , and Collins, D. L. , 2009, “ Unbiased Nonlinear Average Age-Appropriate Brain Templates From Birth to Adulthood,” Neuroimage, 47(47), p. S102. 10.1016/S1053-8119(09)70884-5 [DOI] [Google Scholar]
- [28]. Iglesias, J. E. , Liu, C.-Y. , Thompson, P. M. , and Tu, Z. , 2011, “ Robust Brain Extraction Across Datasets and Comparison With Publicly Available Methods,” IEEE Trans. Med. Imag., 30(9), pp. 1617–1634. 10.1109/TMI.2011.2138152 [DOI] [PubMed] [Google Scholar]
- [29]. Huo, Y. , Xu, Z. , Xiong, Y. , Aboud, K. , Parvathaneni, P. , Bao, S. , Bermudez, C. , Resnick, S. M. , Cutting, L. E. , and Landman, B. A. , 2019, “ 3D Whole Brain Segmentation Using Spatially Localized Atlas Network Tiles,” Neuroimage, 194, pp. 105–119. 10.1016/j.neuroimage.2019.03.041 [DOI] [PMC free article] [PubMed] [Google Scholar]
- [30]. Glaister, J. , Carass, A. , Pham, D. L. , Butman, J. A. , and Prince, J. L. , 2017, “ Automatic Falx Cerebri and Tentorium Cerebelli Segmentation From Magnetic Resonance Images,” Proc. SPIE Int. Soc. Opt. Eng, 10137, p. 101371D. 10.1117/12.2255640 [DOI] [PMC free article] [PubMed] [Google Scholar]
- [31]. Auld, B. A. , 1990, Acoustic Fields and Waves in Solids, Krieger Publishing Company, Malabar, FL. [Google Scholar]
- [32]. Gelman, A. , and Hill, J. , 2006, Data Analysis Using Regression and Multilevel/Hierarchical Models, Cambridge University Press, New York. [Google Scholar]
- [33]. Knutsen, A. K. , Magrath, E. , McEntee, J. E. , Xing, F. , Prince, J. L. , Bayly, P. V. , Butman, J. A. , and Pham, D. L. , 2014, “ Improved Measurement of Brain Deformation During Mild Head Acceleration Using a Novel Tagged MRI Sequence,” J. Biomech., 47(14), pp. 3475–3481. 10.1016/j.jbiomech.2014.09.010 [DOI] [PMC free article] [PubMed] [Google Scholar]
- [34]. Sabet, A. A. , Christoforou, E. , Zatlin, B. , Genin, G. M. , and Bayly, P. V. , 2008, “ Deformation of the Human Brain Induced by Mild Angular Head Acceleration,” J. Biomech., 41(2), pp. 307–315. 10.1016/j.jbiomech.2007.09.016 [DOI] [PMC free article] [PubMed] [Google Scholar]
- [35]. Hardy, W. N. , Mason, M. J. , Foster, C. D. , Shah, C. S. , Kopacz, J. M. , Yang, K. H. , King, A. I. , Bishop, J. , Bey, M. , Anderst, W. , and Tashman, S. , 2007, “ A Study of the Response of the Human Cadaver Head to Impact,” Stapp Car Crash J., 51, pp. 17–80. 10.4271/2007-22-0002 [DOI] [PMC free article] [PubMed] [Google Scholar]
- [36]. Miller, L. E. , Urban, J. E. , and Stitzel, J. D. , 2017, “ Validation Performance Comparison for Finite Element Models of the Human Brain,” Comput. Methods Biomech. Biomed. Eng., 20(12), pp. 1273–1288. 10.1080/10255842.2017.1340462 [DOI] [PMC free article] [PubMed] [Google Scholar]
- [37]. Ganpule, S. , Daphalapurkar, N. P. , Ramesh, K. T. , Knutsen, A. K. , Pham, D. L. , Bayly, P. V. , and Prince, J. L. , 2017, “ A Three-Dimensional Computational Human Head Model That Captures Live Human Brain Dynamics,” J. Neurotrauma, 34(13), pp. 2154–2166. 10.1089/neu.2016.4744 [DOI] [PMC free article] [PubMed] [Google Scholar]
- [38]. Zhou, Z. , Li, X. , Kleiven, S. , Shah, C. S. , and Hardy, W. N. , 2018, “ A Reanalysis of Experimental Brain Strain Data: Implication for Finite Element Head Model Validation,” Stapp Car Crash J., 62, pp. 293–318. 10.4271/2018-22-0007 [DOI] [PubMed] [Google Scholar]
- [39]. Zhao, W. , and Ji, S. , 2020, “ Displacement- and Strain-Based Discrimination of Head Injury Models Across a Wide Range of Blunt Conditions,” Ann. Biomed. Eng., 48(6), pp. 1661–1677. 10.1007/s10439-020-02496-y [DOI] [PMC free article] [PubMed] [Google Scholar]
- [40]. Giudice, J. S. , Alshareef, A. , Wu, T. , Knutsen, A. K. , Hiscox, L. V. , Johnson, C. L. , and Panzer, M. B. , 2021, “ Calibration of a Heterogeneous Brain Model Using a Subject-Specific Inverse Finite Element Approach,” Front. Bioeng. Biotechnol., 9, p. 664268. 10.3389/fbioe.2021.664268 [DOI] [PMC free article] [PubMed] [Google Scholar]
- [41]. Menghani, R. R. , Das, A. , and Kraft, R. H. , 2023, “ A Sensor-Enabled Cloud-Based Computing Platform for Computational Brain Biomechanics,” Comput. Methods Programs Biomed., 233, p. 107470. 10.1016/j.cmpb.2023.107470 [DOI] [PubMed] [Google Scholar]
- [42]. Escarcega, J. , Knutsen, A. K. , Alshareef, A. A. , Johnson, C. L. , Okamoto, R. J. , Pham, D. L. , and Bayly, P. V. , 2023, “ Comparison of Oscillatory Deformation Patterns Excited in the Human Brain In Vivo by Harmonic and Impulsive Skull Motion,” ASME J. Biomech. Eng., 145(8), p. 081006. 10.1115/1.4062809 [DOI] [PMC free article] [PubMed] [Google Scholar]
- [43]. Gale, S. D. , Baxter, L. , Roundy, N. , and Johnson, S. C. , 2005, “ Traumatic Brain Injury and Grey Matter Concentration: A Preliminary Voxel Based Morphometry Study,” J. Neurol. Neurosurg. Psychiatry, 76(7), pp. 984–988. 10.1136/jnnp.2004.036210 [DOI] [PMC free article] [PubMed] [Google Scholar]
- [44]. Hiscox, L. V. , McGarry, M. D. J. , Schwarb, H. , Van Houten, E. E. W. , Pohlig, R. T. , Roberts, N. , Huesmann, G. R. , et al., 2020, “ Standard-Space Atlas of the Viscoelastic Properties of the Human Brain,” Hum. Brain Mapp., 41(18), pp. 5282–5300. 10.1002/hbm.25192 [DOI] [PMC free article] [PubMed] [Google Scholar]
Associated Data
This section collects any data citations, data availability statements, or supplementary materials included in this article.
Supplementary Materials
Supplementary PDF
Data Availability Statement
The image data used in this study are available for download from the Brain Biomechanics Imaging Resource website3 [12]. A complete list of participant demographics, including participant age, sex, height, weight, brain volume, and excitation direction is given in the Table S1 available in the Supplemental Materials on the ASME Digital Collection. In addition to imaging data described in this paper, diffusion-weighted images were acquired on each participant during the same imaging session. Details on the acquisition and processing of the diffusion-weighted images are provided in the Supplemental Materials.


