

Abstract
Establishing robust structure–activity relationships (SARs) is key to successful drug discovery campaigns, yet it often remains elusive due to screening and hit validation artifacts (false positives and false negatives), which frequently result in unproductive downstream expenditures of time and resources. To address this issue, we developed an integrative biophysics-driven strategy that expedites hit-to-lead discovery, mitigates false positives/negatives and common hit validation errors, and provides a robust approach to obtaining accurate binding and affinity measurements. The advantage of this method is that it vastly improves the clarity and reproducibility for affinity-driven SAR by monitoring and eliminating confounding factors. We demonstrate the ease at which high-quality micromolar binders can be generated from the initial millimolar fragment screening hits against an “undruggable” protein target, HRas.
1. Introduction
Most early-stage drug discovery efforts begin with one or more compound screening campaigns. These may include high-throughput biochemical screens (HTS), virtual/computational screens, or biophysics-based screens such as X-ray crystallography, surface plasmon resonance (SPR), nuclear magnetic resonance (NMR), differential scanning fluorimetry (DSF), and so forth. The objective of HTS and virtual screening efforts is to identify relatively strong binders to a given disease-relevant target (protein or nucleic acid). In contrast, many biophysics-based screening approaches tend to identify relatively weak binding ligands, such as fragments, that are subsequently elaborated and optimized across repeated rounds of analoging to improve potency. The challenge, no matter what type of screening strategy is taken, is that most of these approaches are susceptible to high numbers of false positives, which can confound not only initial hit identification but also follow-up validation studies by misleading interpretations of structure–activity relationships. The result is that significant resources can often be invested on nonproductive hit optimization pathways. In addition, most follow-up studies for initial hits involve orthogonal evaluation of the hit potency or affinity, often followed by efforts to obtain a structure of the ligand bound to the target in order to support or mount rational design efforts at the very early stages of a program. Applying these criteria onto initial screening hits can be a significant problem given the aforementioned false positives along with the fact that many of the initial hits from most biophysical screening campaigns are weak binders, have poor solution behavior, or are identified under solution conditions different from those needed for biophysical follow-up characterization studies.
An alternative approach, which aims to circumvent the previously mentioned challenges, is to establish early on a biophysics-based SAR cycle that closely monitors and tightly controls factors that contribute to false positives, negatives, and common issues that arise in screening and hit validation assays. This is achieved by a comprehensive monitoring of the ligand solution behavior, aqueous solubility, structure, and stability, while simultaneously evaluating the target stability and conformation in the presence of the ligand. This platform aims to provide a rapid and robust framework from which systematic improvements in the potency of the binders are evaluated via simple, sensitive, one-dimensional nuclear magnetic resonance (NMR) experiments. We demonstrate our NMR for SAR biophysics strategy with an “undruggable” protein target, HRas, and show the ease with which high-quality μM binders can be developed from an initial ∼7–10 mM fragment screening hit.
Harvey-Ras (HRas) belongs to the Ras family of small GTPases that activate the RAS–RAF–MEK–ERK pathway. HRas functions as a molecular switch in signaling pathways involved in cell growth, proliferation, and differentiation.1,2 As an oncogene, HRas mutations predominate in bladder cancer and neck squamous cell carcinoma, with substitutions on residues G12, G13, and Q61 being the most common.3 Ras family proteins are notoriously difficult to drug, with one of the challenges being few and shallow binding pockets to target.4 Currently, no drugs that directly inhibit HRas have been approved. The lead-optimizable protein–protein interaction (PPI) inhibitors we developed are shown to inhibit a key interaction between Ras and a physiologically relevant binding partner, SOS (Son-of-Sevenless). We demonstrate this mechanism via a functional assay which monitors the disruption of SOS-mediated nucleotide exchange.
Our strategy is unlike the previously described SAR by NMR approaches,5 in that our method: (i) is built upon a core set of one-dimensional NMR experiments which afford a vastly higher throughput, (ii) focuses on monitoring the ligand solution behavior, structure, and solubility—key to the quality control process—and facilitates robust interpretations of SAR, (iii) captures a much larger set of information that describes both the ligand and target and how they interact (all using the same sample), (iv) is not limited by the target size given that it does not rely exclusively on multidimensional NMR methods, nor does it require labeled proteins, and finally (v) requires far less material—one can perform robust experiments at volumes of only 200 μL and at target protein concentrations of 10–15 μM.
From ∼200 compounds, our approach has delivered inhibitors that serve as suitable entry points for subsequent lead optimization (LO). Overall, the NMR for SAR strategy is an efficient means to fast-track early-stage drug discovery efforts for a wide variety of protein targets and has been vetted within the context of contract research organization (CRO) services provided to >70 pharma/biotech clients.
2. Results and Discussion
2.1. 19F Fragment Screen
The fluorine nucleus is extremely sensitive to chemical environment, making it ideal as a probe for ligand-binding interactions,6,7 especially for difficult-to-drug targets such as Ras family GTPases. The NMX Classic Fluorine (19F) library8,9 of 461 compounds was screened as cocktails of 11–15 compounds per pool against GDP-HRasG12V (hereafter “HRas”). The initial screen yielded a low hit rate, which was expected given the shallowness of the available surface pockets for this target, and the magnitudes of the binding effects were thus very subtle, even for the best screening hit. The screen was therefore repeated at a higher protein concentration of 50 μM (instead of the initial 15 μM), highlighting one of the advantages of fragment screening by 19F NMR, namely, that there is no interference from the signal arising from the protein in 19F NMR. In contrast, this high protein concentration would have affected the reliability of screening by 1H NMR due to the protein resonance overlap with the ligand. The fragment screens were performed in a matter of ∼5 h each and led to the identification of 14 hits by 19F differential line width (DLW) (Figure 1). All 14 hits were submitted for subsequent testing as singletons, and two of those hits exhibited binding scores (magnitude of changes in line broadening (DLW) between compounds in the absence and presence of protein) that justified a more thorough follow-up.
Figure 1.

Identification of initial hits from a19F NMR fragment screen against GDP-HRasG12V. 1D 19F spectra of a pool of fragments in the absence (blue) and presence (red) of protein. The spectrum of each fragment present in the pool is shown. A zoom is presented on the right for the series 1 hit.
Note that screening by 19F NMR was crucial to the success of this program, as no binding was observed by ligand-detected 1H NMR experiments for the initial hits (Figure S1). This phenomenon can be attributed to the relative sensitivity of the fluorine nucleus, which is far more susceptible to subtle differences in the chemical environment and relaxation effects than proton. It should be noted, however, that the NMR for SAR strategy is equally feasible using 1H ligand-detected NMR experiments when the sensitivity of the assay permits; the use of fluorine was necessitated here due to the shallowness of the HRas binding pocket which resulted in very weak initial fragment hits under the conditions used.
2.2. Early Analoging
The best binding fragment was used as a template for subsequent analoging efforts. The first round of analogs was procured from commercially available sources, and one of the two identified binders (series 1 discussed here) was prioritized for further elaboration to explore SAR. Figure 2 summarizes some of the results obtained using our strategy. Binding scores for both 19F DLW and 19F T2-CPMG ligand-detected NMR methods were extracted and used to monitor the improvements in binding affinity and guide the interpretations of SAR. Ranking of compounds by the magnitude of ligand-detected changes in this way is valid as the scores are directly related to the fraction of bound ligand, provided the fast-exchange condition is satisfied.10−13 The ligand concentrations are directly measured by 1H NMR acquired on the same samples using the ERETIC method14 (which provides an electronic concentration reference), in order to control the variations between nominal and true ligand concentrations in aqueous solution. Concentrations were measured for both the free ligand samples and the samples containing ligand and protein, where appropriate. Compound aggregation is also monitored on each sample within this workflow using a previously reported 1H T2-CPMG assay.15,16
Figure 2.

Systematic improvements in relative binding affinity. Top: table reporting the measured concentration, aggregation status, and binding scores extracted for each ligand. Protein concentration was 50 μM for early analoging and subsequently reduced to 15 μM for later NMR binding assays. Note that the ligand:protein ratio is key to the accurate interpretations of rank order. The measured concentration was taken into consideration throughout each round of analoging. Aggregator status was established using a previously reported NMR assay.14 The T2-CPMG score is above the limit of quantitation for NMX-10002 (exceeding the maximum binding score) at the concentrations tested. Bottom: 1D 19F NMR data obtained for a series of analogs showing sequential improvement of the relative binding affinity, with free ligand spectra (blue) and ligand with protein (red).
2.3. Solution Behavior
Accurate affinity measurements are often confounded by, and are highly susceptible to, differences between the nominal and true solution concentrations of the ligand. The importance of this cannot be overstated as the majority of dose–response assays performed in laboratories employ nominal ligand concentrations which often do not accurately reflect the realities of the compound solution behavior or the true stock solution concentrations.15−17 By precisely measuring the true aqueous ligand concentrations throughout a titration (Figure S2), we can significantly reduce the experimental error and correct dose–response curves such that they accurately reflect the affinity of the ligand for the target of interest. Failure to correct dose–response curves according to true aqueous concentrations can lead to large errors in common biophysical affinity measurements and often mislead the interpretations of relative affinities and SAR.
2.4. Orthogonal Biophysical Methods for KD
To validate our strategy, KD values were also orthogonally obtained for select compounds using NMR, microscale thermophoresis (MST), and SPR, demonstrating excellent agreement with the relative rank order established by the ligand-detected NMR data (Figures 3A and S7).
Figure 3.

NMR for SAR strategy (A) rank ordering by ligand-detected NMR correlates with the affinity constants determined by NMR. Maximum solubility is also assessed by NMR on the compounds selected for follow-up in order to guide subsequent experiments. (B–G) Examples of 19F ligand-detected methods used to rank the compounds in (A). (B, D, F) 19F DLW and (C,E,G) 19F T2-CPMG spectra for series 1 hit, 10018 and 10095, respectively. DLW: differential line width; CPMG: Carr–Purcell–Meiboom–Gill. Protein concentration used was 15 μM. DLW scores approaching 17 and T2-CPMG scores approaching 40 are near the limit at which subtle differences in relative affinity can be discerned, under the conditions tested. This can be ameliorated by changing the ligand:protein ratio to make the assay more or less sensitive, for the resolution of weaker or stronger binders, respectively. Conditions were optimized for evaluating binding across a wide range of relative affinities.
2.5. 1H Ligand- and Protein-Detected NMR
Using the same NMR samples as for the 19F ligand-detected NMR experiments, we also recorded both 1H 1D ligand- and 1H 1D protein-detected NMR spectra to (i) accurately quantify ligand concentration in solution and (ii) monitor changes in the protein conformation in the presence of ligand, respectively. Compounds that induced larger magnitude changes in the protein spectrum were prioritized. Likewise, by tracking the systematic differences in the protein “fingerprint”, we were able to obtain dose–response curves upon ligand titration (Figure S4).
The 1D protein-detected NMR experiments have the added advantage of providing exquisite insights into protein stability, as protein precipitation, aggregation, or loss (significant sources of false positives or negatives in binding assays) can be easily monitored and controlled for each sample. The protein requirements are no different from that of our standard ligand-detected NMR experiments (∼15 μM) and take 11 min to complete with the usual one-dimensional proton NMR techniques, using unlabeled protein.
2.6. 2D NMR for Monitoring Binding Sites
Note that while the NMR for the SAR workflow can be successfully employed to drive the improvements in potency in the absence of structural information, we opted to employ 2D NMR to confirm the binding site for the most promising compounds from each round of analoging. This was not a requirement but did offer orthogonal validation for the hits and ensured that the binding site was preserved throughout the SAR optimizations. Backbone amide chemical shift assignments were available for HRasG12V and were readily transferred to the 2D 1H,15N HSQC.18 Chemical shift perturbations (CSPs) were then used to map the binding site of the compounds (Figure 4A) which was found to be in agreement with a conserved Ras-GTPase pocket, previously reported for KRas.19−22
Figure 4.

Assessment of binding site and affinity ranking by 2D NMR. (A) 2D 15N,1H HSQC spectra reveal the binding site of the initial screening hit as the protein is tested against the increasing concentrations of the ligand. Three backbone residues showing the largest CSPs, indicated by arrows, are highlighted in blue on the protein surface (PDB: 3OIW). Measured ligand concentrations: 0, 760, 1470, 2620, and 3690 μM. The nucleotide-binding pocket, which can be observed at the top of the protein structure, is occluded and inaccessible to small-molecule ligands due to the presence of either GDP or GTP under physiological conditions. (B) Magnified regions of 2D 15N,1H HSQC spectra for analogs with the best binding scores from each round of analoging. Compounds were tested at the same ligand-to-protein ratios (5:1 depicted here) to evaluate both the ligand-binding sites and to prioritize based on the magnitude of target engagement.
Following each round of optimization, the solution properties of the best scoring analogs were further evaluated across a range of concentrations to ensure that they would be amenable for titration studies by 1D and 2D NMR, as well as other orthogonal biophysical experiments. Based on the results of these experiments, the maximum concentration used for the compound in any of the subsequent assays was set to maintain good compound behavior in solution; that is, concentrations were used at which there was no evidence of aggregation by T2-CPMG (example application in Figure S3) and where linear relationships between nominal and observed concentrations were maintained (Figure S2).
To prioritize compounds that would be tested by subsequent 2D NMR dose–response titrations (and for orthogonal biophysical validation), 1H,15N HSQC experiments were performed with a fixed compound concentration to achieve equivalent ligand-to-protein ratios (Figure 4B) across the analog series. Compounds that exhibited the largest chemical shift perturbations (CSPs) in these comparative experiments were then prioritized for KD determination by NMR.
2.7. KD by 1D and 2D NMR Analysis
KD measurements were obtained via both (i) 1D NMR by monitoring the changes in 1H upfield methyl protein resonances (Figure S4) and (ii) 2D NMR (where appropriate) (Figure S5).
The lower protein concentration requirements for 1H 1D protein-observed experiments reduce the concentration of ligands needed to achieve the sufficient saturation of the protein and can therefore be used to measure KD across a wide range of affinities (μM–mM). The use of lower protein concentrations also permits KD evaluation for more poorly soluble compounds. For low μM to pM binders, 1H 1D protein-detected NMR can also be used as a way of validating productive binding to the target simply by monitoring the changes in the protein spectrum “fingerprint” relative to the apo protein (Figure 5). These experiments have the added advantage of not requiring isotopically labeled proteins and can therefore be done using proteins expressed from mammalian cells, yeast, bacteria, or any other expression system. These 1H 1D protein-detected experiments were performed in parallel to the 1D NMR ligand-observed binding assays (on the same samples).
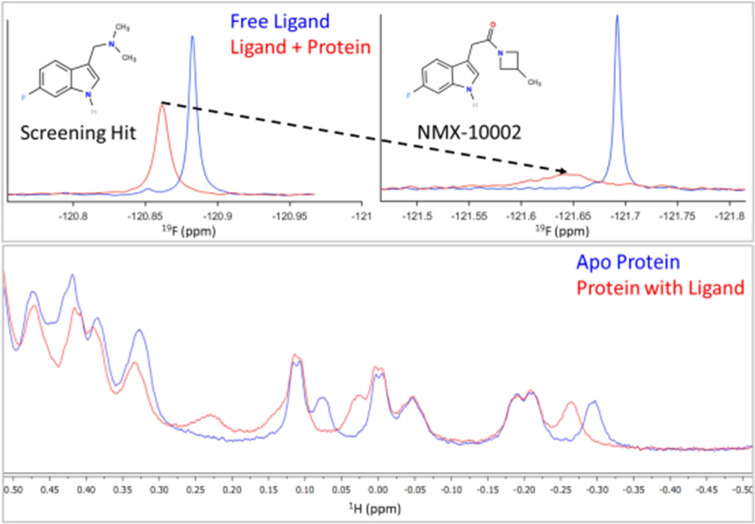
Figure 5.

Identification of a low-micromolar binder. (A) 1H protein-detected NMR changes for a relatively potent low μM binder to HRas. Apo protein spectrum in blue, protein + ligand spectrum in red, and free ligand spectrum in green. (B) 15N,1H HSQC spectrum of apo HRas (blue) and protein with inhibitor at equimolar stoichiometry (red) demonstrating significant conformational perturbation. Inlays show ligand-detected 19F 1D spectra of free ligand (blue) vs ligand + protein (red), where significant broadening of the ligand signal is consistent with the intermediate chemical exchange. Leftmost inlay corresponds to a ligand:protein ratio of ∼7:1, whereas the rightmost inlay corresponds to a ligand:protein ratio of 1:1. At a lower stoichiometry of ligand:protein, the broadening of the ligand resonance is greater.
2.8. Biochemical/Functional Assay
Systematic improvements in binding affinity were thus established and ultimately led to the development of low μM binders toward a key binding site that is important for a physiologically relevant binding event between SOS and HRas. Ligands were tested according to a previously established functional assay that monitors SOS-mediated release of fluorescently labeled (BODIPY) nucleotide.20,23 We demonstrate that our binders can act as functional PPIs by impeding SOS-mediated nucleotide exchange (Figure 6A). Compounds that were most active in the nucleotide exchange assay were tested in cell proliferation assays. Figure 6B illustrates that NMX-10095 exhibits differential inhibition of cell proliferation between T24 and 5637 bladder cancer cell lines and healthy bladder epithelial cells (BdECs). These results suggest that this early lead compound possesses some selectivity against cancerous cells over their healthy counterparts.
Figure 6.

Evaluation of the effect of compounds on biochemical and cellular activities. (A) SOScat-catalyzed nucleotide release assay showing the potency of compounds. Experiments were performed in duplicate with 500 nM SOScat and 1 μM HRasG12V-BODIPY-GDP, and plots show the release rates normalized to that of the DMSO control. (B) Antiproliferative activity of NMX-10095 against T24 (bladder carcinoma), 5637 (bladder carcinoma), and BdEC (healthy, primary bladder epithelial) cell lines. Inhibition curves are normalized to the DMSO control. Error bars: SEM.
2.9. Distinctive Features of NMR for SAR Strategy
Our approach to compound screening and hit validation satisfies a number of key criteria that are often overlooked by more traditional strategies: (i) by evaluating early SAR (mM−μM range), we can establish clear systematic changes in binding affinity and build confidence in productive ligand–target engagement; (ii) by monitoring the solution behavior and structure of the ligand at all stages of follow-up, we ensure that the binding event is not a false positive (i.e., aggregation-induced or degraded compound); (iii) the accuracy and reproducibility of affinity measurements are significantly improved by correcting nominal concentrations for true aqueous solubilities; (iv) by building up from fragment-sized scaffolds, this approach affords a direct forward-driven approach to improving the potency. This is in contrast to HTS hits which are often potent (whether productive binders or simply nonspecific) but are usually non-optimized (poor ligand efficiency) and may need to be deconstructed into the minimal binding scaffold, (v) the target is monitored under truly “label-free” conditions (unlike many other biophysical methods that require tethering of the target or ligand or fluorophore labeling, which can alter the behavior of the protein target relative to its nonimmobilized/nontagged state),24 (vi) the techniques employed here provide direct, atomic-level insights into conformational changes in the target protein upon ligand binding and can be simultaneously used to monitor target stability, even for unlabeled proteins at low concentrations, and (vii) the approach is high-throughput (comparable to other biophysical methods), requiring only a reference sample and a test sample per compound while providing a far greater wealth of information on both the compound and target than that is offered by orthogonal techniques—all within <1 h of experiment time per hit/analog.
3. Conclusions
Using the NMR for SAR strategy, we have been successful in guiding medicinal chemistry efforts to improve the binding affinity from an initial ∼7–10 mM fragment screening hit to potent μM binders showing PPI inhibition between HRas and SOS as well as selective inhibition of cancerous cell proliferation. The compounds bind to an allosteric site in HRas and disrupt SOS-mediated nucleotide release, which is critical for the cycling of Ras between its inactive and active conformations. Key to our approach are precise control and monitoring of the compound solution behavior, aqueous solubility, and target conformational changes; accurate relative affinity measurements; and robust high-throughput 1D NMR assays. Nearly all measurements are done on single matched pair samples of free ligand and ligand with protein, affording clear insights into true binding events and structure–activity relationships. We demonstrate that the relative binding affinities obtained by ligand-detected NMR binding assays agree exquisitely well with the affinity rank order obtained using orthogonal biophysical measurements and, in combination with 1D protein-detected NMR, provide much greater insight and control than traditional strategies for ranking by affinity or potency. This strategy has been developed specifically to address many of the challenges encountered in early-stage drug discovery and screening, for both academic and industrial clients alike. We believe this approach can significantly expedite hit-to-lead discovery and help mitigate attrition and waste expenditures for a wide range of drug discovery programs.
4. Experimental Section
4.1. Fragment Library
Fragment screening was performed using a library containing 461 fragments that had been designed within the Rule of Three constraints25 and filtered to remove undesirable members, including common pan-assay interference compound (PAINS) substructures.26 All fragments have been curated by 1H and 19F NMR for structure verification, purity, solubility in phosphate buffer, and lack of apparent aggregation under these conditions. Fragments were pooled based on chemical compatibility and sufficient separation of 19F NMR signals, resulting in 31 different pools to increase the screening throughput. The library was provided by NMX Research and Solutions Inc. (https://www.nmxresearch.com/). Further information about this library is available through Key Organics (https://www.keyorganics.net/bionet-products/fragment-libraries/) as the BIONET Fluorine Fragment Library.
4.2. NMR
NMR experiments were performed with the following hardware: a 600 MHz Bruker Avance III NMR spectrometer equipped with a QCI HFCN helium cryoprobe, SampleJet, and ATMA autotune system. All samples were prepared in 3 mm Bruker SampleJet tubes to volumes of 180–200 μL with assay buffer (25 mM sodium phosphate, pH 7.4, 150 mM NaCl, 5 mM MgCl2, 1 mM TCEP-d16, 10% D2O). DMSO-d6 content was kept constant at 3.6%.
19F screening was performed using the standard 19F 1D NMR pulse sequence zgfhigqn.2 (1D sequence for F-19 observed with inverse-gated H-1 decoupling). Protein concentration was 50 μM, and fragment pools were added such that each ligand (∼10–15 per pool) was ∼240 μM in solution.
19F 1D Ligand-detected NMR was performed using the zgfhigqn.2 sequence. Protein concentration was 50 μM for the initial round of analoging but was subsequently reduced to 15 μM when the magnitude of ligand-binding effects (line broadening) exceeded that observed for compound 10002.
The 19F T2-CPMG sequence was a modified version of a 1D CPMG pulse sequence with broad-band excitation and refocusing shaped pulses.
The 19F excitation and refocusing pulses were generated using the gradient ascent pulse engineering (GRAPE) framework for designing NMR shaped pulses.27 Specifically, we followed the methodology that is outlined in the work of Coote et al.28 for generating 19F T2-CPMG pulses tailored to specific sets of NMR resonance frequencies.
We optimized the two pulses to achieve high-fidelity excitation and refocusing for the populated spectral locations (NMR peak positions) present in our 19F fragment library. An ensemble of resonance frequencies was selected based on our in-house library characterization data. Each pulse was optimized for the desired point-to-point rotation (for excitation) or universal rotation (for refocusing) over the selected ensemble of resonance frequencies. These pulses are not intended to function correctly for other resonance frequencies that are not populated in our fragment library.
Pulse durations are 300 μs (excitation) and 600 μs (refocusing), with an average RF amplitude of 8.5 kHz and peak amplitude of 22.7 kHz. The peak amplitude is equivalent to an 11 μs hard pulse excitation and within hardware specifications.
1H 1D Protein-detected NMR was performed using the zgesgp pulse sequence.29 Since these experiments were performed on the same sample used for the ligand-detected experiment for each compound, the protein concentration matched those (typically 15 μM, but 50 μM for early analogs).
2D 1H,15N NMR experiments were performed using the fHSQC sequence.30
Software: Topspin 3.5pl7 was used to control the spectrometer for data acquisition and processing. Figures were prepared with one or more of the following software: MestreNova, CCPNMR Analysis, Bruker Topspin, Pymol, Microsoft Excel, and NMX’s in-house software packages. NMX’s custom software were employed in automated and semisupervised analysis of both fluorine screening and 1H/19F ligand-binding data.
4.3. DLW Score
Each 19F peak is fit by least-squares to a series of common NMR multiplet peak shapes corresponding to different coupling topologies (singlet Lorentzian, doublet, triplet, quartet, doublet-of-doublets, and triplet-of-doublets). The other peak shapes are superpositions of singlets that are shifted left and right according to the couplings. The highest quality (lowest-squares error) fit is chosen, and the others are discarded. The fit yields measurements of NMR parameters such as resonance frequency, line width, peak amplitude, and J-splitting(s). The 19F differential line width (DLW) score has units of Hz and is defined as the difference of fit line width, in the presence versus absence of the protein. Normalization of scores can be done with respect to a known binder (control compound) but is not obligatory when comparing scores obtained within the same preparation (using identical sample conditions).
The score is directly related to the fraction of bound ligands via the following relationship:13
where xb is the fraction of bound ligand, wobs is the line width of the ligand in the presence of protein, wfree is the line width of the free ligand, and wbound is the line width of the ligand when bound to the target protein.
Likewise, the fraction of the ligand bound can be related to the measured T2 relaxation rate (and thus the T2-CPMG score), given that the line width (w) at half-height (fwhm) is inversely proportional to T2 via:
where w is the line width at half-height (“full width at half-maximum”).
The fraction of the bound ligand is equal to the ratio of bound versus total ligand, and this can be described in terms of protein–ligand complex by
where [Lb] is the concentration of bound ligand, [Lt] is the total concentration of ligand, and [PL] is the concentration of the protein–ligand complex.
Assuming the fast exchange condition whereby ligands exhibit fast off-rates (koff), a reasonable assumption for most μM to mM binders, and where ligand concentrations are in significant excess relative to protein (such that Lf ≅ Lt), we can then invoke a simplified 1:1 binding model to relate the amount of protein–ligand complex (PL) to KD:
Thus, we can relate the fraction of bound ligand to KD by the relation:
In cases where the amount of free ligand does not closely approximate the total ligand (Lf ≠ Lt), a more complete solution is required:
Solving for [PL] gives
In the same way, Xb can be related to KD via [PL] and is therefore a direct measure of relative affinity.13
The equation that correlates chemical shift changes to KD is written as follows (for the 1:1 binding model):
For target-detected NMR:31
4.4. T2-CPMG Score
The CPMG score has units of seconds and is obtained by taking the difference between the observed R2 relaxation rate for the ligand in the presence of the protein and R2 of the free ligand. As with the DLW score, normalization can be done with a known binder (control).
The score is determined using two samples, one with a free ligand and one with a ligand in the presence of the target. For each sample, a series of NMR spectra are acquired with eight different relaxation delays (1, 25, 50, 100, 200, 300, 500, and 800 ms). NMR regions of interest (ROIs) containing peaks, multiplets, or clusters of peaks are extracted. Within each ROI, the signal from the first spectrum is projected onto each of the other seven spectra, to create a series of scalar projection weights (Mk for k = 1–8). These are fit by least-squares to the theoretical relaxation equation, i.e., a standard exponential decay curve:
where t is the CPMG relaxation delay for each of the eight spectra, and R2 and A are free parameters that are determined by the fitting routine.
This is calculated separately for each ROI, and then, it is averaged to generate an overall score for each ligand.
4.5. 2D 1H,15N HSQC Analysis
1H,15N Fast HSQC experiments30 were recorded at a protein concentration of 50 or 100 μM. Dissociation constants were obtained by monitoring the changes in chemical shifts as a function of ligand concentration. The weighted average changes in chemical shifts (d) were calculated according to the following equation:31,32
where δ is the change in chemical shift in ppm for 1H and 15N, and the correction factor (α) was set at 0.15.
4.6. Biochemical Assay
Nucleotide release rates were measured using 1 μM BODIPY GDP-loaded HRasG1V in 25 mM Tris, pH 7.4, 50 mM NaCl, 1 mM DTT, and 10 mM MgCl2. The nucleotide release reaction was then initiated by the addition of either DMSO (control) or compounds in DMSO (across a range of concentrations), SOScat, and unlabeled GTP to the final concentrations of 500 nM and 20 μM, respectively. The DMSO content was kept constant at 3% in all conditions.
Changes in fluorescence were measured by a fluorescence spectrometer (Tecan Infinite M1000 Pro) in a black 384-well plate (Greiner). Fluorescence excitation was carried out at λ = 485 nm, and emission was measured at λ = 510 nm every 30 s for 30 min at 28 °C. Release rates were determined by fitting the decrease in fluorescence over time to a single exponential decay. The derived rates were normalized to the DMSO-treated sample and plotted against compound concentration as mean ± SEM. The IC50 value for each compound was calculated by fitting the normalized rates to a four-parameter dose response curve.
4.7. Cloning, Expression, and Purification of Proteins
The codon-optimized sequences for HRasG12V (aa 1–166) and human SOS1 (SOScat, aa 564–1049) were prepared and cloned into the pET-28a(+) plasmid at GenScript (https://www.genscript.com). Proteins were expressed using E. coli BL21 (DE3) cells in Terrific Broth (TB) medium and induced with 0.5 mM IPTG at 25 °C overnight. Cells were harvested by centrifugation (5000g for 20 min at 4 °C), and cell pellets were extracted by sonication in 50 mM Tris, pH 8, 500 mM NaCl, and 5 mM Tris(2-carboxyethyl)phosphine hydrochloride (TCEP). Cell lysates were centrifuged at 20,000g for 30 min at 4 °C, and the supernatant was diluted in TCEP-free lysis buffer to reduce the TCEP concentration to 1 mM. The diluted solution was loaded onto a HisTrap HP column (GE Healthcare). The column was washed (50 mM Tris, pH 8, 500 mM NaCl, 1 mM TCEP), and the bound proteins were eluted using a linear gradient of elution buffer (50 mM Tris, pH 8, 500 mM NaCl, 1 mM TCEP, 300 mM imidazole). For HRas NMR studies, HRas N-terminal His-tag was cleaved by incubation with tobacco etch virus protease (TEV) overnight at 4 °C in SnakeSkin Dialysis Tubing (Thermo Scientific) to remove excess imidazole. TEV was removed using a nickel column, and the proteins were further purified on a size-exclusion (SEC) Superdex 75 column (GE Healthcare) in buffers containing 25 mM sodium phosphate, pH 7.4, 150 mM NaCl, 5 mM MgCl2, and 1 mM TCEP and 25 mM Tris, pH 7.4, 50 mM NaCl, and 1 mM dithiothreitol (DTT) for HRas and SOS, respectively. Fractions containing the respective proteins were pooled, concentrated using Amicon centrifugal filters (Millipore), flash-frozen in liquid nitrogen, and stored at −80 °C. The purity of HRas and SOS was greater than 95% by SDS-PAGE.
Uniformly 15N-labeled HRas was purified using the same steps, as described above, but was expressed in M9 minimal media with 15NH4Cl as the sole nitrogen source.
For biophysical assessments, HRas was loaded with GDP before the size-exclusion chromatography step by incubating the protein with 20 mM EDTA and 5 mM GDP at room temperature for 30 min. The solution was then buffer-exchanged in EDTA- and nucleotide-free buffer with 5 mM MgCl2 before being loaded into the SEC column.
For the nucleotide release assay, HRas was buffer-exchanged in MgCl2-free buffer and incubated with 20 mM EDTA and 2 mM BODIPY FL GDP (Invitrogen) for 1.5 h at room temperature. The reaction was then supplemented with 10 mM MgCl2 and incubated for another 30 min at room temperature. EDTA and the excess nucleotides were removed by desalting the protein into 25 mM Tris, pH 7.4, 50 mM NaCl, 1 mM DTT, and 10 mM MgCl2.
4.8. Cell Lines and Cell Culture
Bladder cancers (T24 and 5637) and primary bladder epithelial/normal cells (BdEC) were obtained from the American Type Culture Collection (ATCC). T24 cells were cultured in McCoy’s medium, and 5637 cells were cultured in RPMI-1640, supplemented with 10% FBS. BdEC cells were cultured in healthy bladder epithelial basal medium supplemented with a growth kit, as recommended by the manufacturer. Cells were incubated in a humidified atmosphere of 5% CO2 at 37 °C to ensure growth and viability.
4.9. Proliferation Assay
Antiproliferative effects were evaluated by using an MTT (3-(4,5-dimethylthiazolyl-2)-2,5-diphenyltetrazolium bromide) assay. When cells reached 80–90% confluency, they were transferred and cultured overnight in 96-well plates, in a humidified atmosphere of 5% CO2 at 37 °C. Cells were then starved with media without FBS for 4 h. After starvation, the cells were treated with various concentrations of each compound diluted in fresh media without FBS for 72 h. DMSO was used as a vehicle control for each cell type for normalization of the data. After incubation, 20 μL of MTT solution (prepared at 5 mg/mL) was then added to each well and incubated for 4 h in the dark at 37 °C. The formazan crystals were then solubilized by removing the media and adding DMSO. Cell viability was determined by measuring the absorbance at 570 nm and subtracting the 650 nm background absorbance. Relative proliferation for each cancer/normal cell line was plotted using GraphPad Prism.
4.10. Compound Preparation and Characterization
All commercially available reagents and anhydrous solvents were used without further purification. Purity assessments for final compounds were determined by analytical HPLC: 4.6 × 50 mm Waters YMC Pro-C18, 5 μm column, 120A. Mobile phases were as follows: A, H2O with 0.2% formic acid; B, acetonitrile with 0.2% formic acid. Gradient: 10–90% B in 3 min with a 5 min run time. The flow rate was 1.5 mL/min. Unless specified otherwise, all compounds were ≥95% pure. Mass spectrometry samples were analyzed on a Micro Mass ZQ, ZMD, Quattro LC, or Quattro II mass spectrometer operated in single MS mode with electrospray ionization. Samples were introduced into the mass spectrometer by using flow injection (FIA) or chromatography. The mobile phase for all mass analyses consisted of acetonitrile–water mixtures with either 0.2% formic acid or ammonium formate. 1H NMR spectra were recorded using either a Bruker Avance 400 (400 MHz) or a Bruker Avance II- 300 (300 MHz) instrument. Column chromatography was performed using Teledyne ISCO RediSep Normal Phase (35–70 μm) or RediSep Gold Normal Phase (25–40 μm) silica flash columns using a Teledyne ISCO Combiflash Companion or Combiflash Rf purification system. Preparative reverse-phase chromatography was carried out using a Gilson 215 liquid handler coupled to a UV–vis 156 Gilson detector and an Agilent Zorbax SB-C18 column, 21.2 × 100 mm. A linear gradient from 10 to 90% CH3CN in H2O over 10 min (0.1% trifluoroacetic acid) was used; the flow rate was 20 mL/min.
High-resolution mass spectrometry data were collected on a Thermo Scientfic QExactive mass spectrometer coupled to a Waters Acquity UPLC system. Samples were analyzed from a 100 μM DMSO solution with a 3 μL injection volume. The chromatographic column was a Waters Acquity CSH C18, 2.1 × 50 mm, 1.7 μm particle size. Gradient elution was employed using 0.1% formic acid in water as mobile phase A and 0.1% formic acid in CH3CN as mobile phase B. The gradient began at 10% B and increased to 60% B over 0.8 min and to 100% B over the next 0.2 min, followed by a 0.5 min re-equilibration under the initial conditions. The mass spectrometer was run in full MS mode, positive polarity, with the resolution set to 35 000. A heated electrospray source was used with settings of 3.5 kV and 400 °C.
All compounds shown in Figures 1 and FS-1255 and NMX-10001 to NMX-10011 were purchased from Key Organics Limited and Enamine Limited.
4.11. Synthesis
Synthesis of indole amides such as NMX-10021 relied on readily accessible 2-(6-fluoro-1H-indol-3-yl) acetic acid 4. This intermediate was prepared on a multigram scale by the two-step cyanomethylation of 6-fluoro indole 1, followed by nitrile hydrolysis to the corresponding pivotal acid intermediate 4, as outlined in Scheme 1.
Scheme 1. Synthesis of 2-(1H-Indol-3-yl)-N-methyl-acetamide Series.

Compounds NMX- 10014, 10016, 10018, 10021, 10040, 10041, 10078, 10086, 10095, and 10097 were prepared via amide couplings under standard conditions using indole acid 4 and the corresponding amines (ex. aniline) in the presence of HATU in dichloromethane, as shown for compound NMX-10021 (Scheme 1).
Indole ketone NMX-10076 was prepared according to Scheme 2. For the synthesis of NMX-10076, 3-acylation of 6-fluoro indole 1 with 2-chloroacetyl chloride afforded the chloromethyl ketone intermediate 5, which upon N alkylation with piperidine furnished the desired analog NMX-10076.
Scheme 2. Synthesis of 1-(1H-Indol-3-yl)-2-(amino)ethenone Series.

4.12. 1-(6-Fluoro-1H-indol-3-yl)-N,N-dimethylmethanamine (2)
A solution of 40% aq. dimethylamine (9.1 g, 80.7 mmol) was cooled to 5 °C, and glacial acetic acid (6.1 mL) was added dropwise while maintaining the temperature at ∼10 °C. After stirring for 20 min, 37% aqueous formaldehyde (6.1 mL, 80.7 mmol) was slowly added to the above solution while keeping the temperature between 0 and 10 °C, followed by the addition of 6-fluoroindole 1 (10 g, 74.0 mmol). The reaction was exothermic and reached a final temperature of ∼40 °C, and it was then cooled down to ∼20 °C. The reaction solution was then slowly added to 160 mL of aqueous NaOH solution (3 M). The suspension was stirred for about 30 min and then collected by filtration. The cake was rinsed with water (50 mL × 2) and dried to afford a yellow solid (12.1 g, >99%).
1H NMR (400 MHz, CDCl3) δ 8.22 (br s, 1H), 7.63–7.59 (m, 1H), 7.08–7.07 (m, 1H), 7.03–7.00 (m, 1H), 6.91–6.86 (m, 1H), 3.60 (s, 2H), 2.28 (s, 6H).
4.13. 2-(6-Fluoro-1H-indol-3-yl)acetonitrile (3)
A solution of 1-(6-fluoro-1H-indol-3-yl)-N,N-dimethylmethanamine 2 (12 g, 62.4 mmol) and KCN (6.7 g, 102.9 mmol) in DMF (36 mL) and water (19 mL) was heated to 105 °C for 10 h. The reaction mixture was then cooled to 25 °C, and water (145 mL) and toluene (80 mL) were added and stirred for 3 h. The organic and aqueous layers were separated. The organic layer was washed with aqueous sodium bicarbonate (80 mL) and brine (80 mL) and then dried over sodium sulfate. After filtration, the filtrate was concentrated, and the residue was purified by flash column chromatography on silica gel to get the desired product as a yellow oil (5.7 g, 52.4% yield).
1H NMR (400 MHz, CDCl3) δ: 8.19 (s, 1H), 7.52–7.49 (m, 1H), 7.22–7.21 (m, 1H), 7.08 (dd, J = 9.4, 2.2 Hz, 1H), 6.98–6.93 (m, 1H), 3.82 (d, J = 1.1 Hz, 2H).
4.14. 2-(6-Fluoro-1H-indol-3-yl)acetic acid (4)
A mixture of 2-(6-fluoro-1H-indol-3-yl)acetonitrile 3 (2 g, 11.5 mmol), sodium hydroxide (2.6 g, 65.0 mmol), methanol (15 mL), and water (45 mL) was stirred at 100 °C for 3 h. The reaction mixture was then cooled to 0 °C and acidified with 6 N aqueous HCl to pH ∼ 1. The solid formed was collected by filtration, which was then washed twice with water and dried to give the title compound 4 as a yellow solid (1.7 g, 76.6% yield).
MS (ESI+) m/z 194 (M+H)+.
1H NMR (400 MHz, DMSO-d6) δ 12.18 (s, 1H), 10.97 (s, 1H), 7.50–7.46 (m, 1H), 7.23–7.22 (m, 1H), 7.12 (dd, J = 10.2, 2.3 Hz, 1H), 6.87–6.82 (m, 1H), 3.63 (s, 2H).
4.15. 2-(6-Fluoro-1H-indol-3-yl)-N-phenylacetamide (NMX-10021)
A solution of 2-(6-fluoro-1H-indol-3-yl)acetic acid 4 (100 mg, 0.52 mmol), aniline (53.0 mg, 0.57 mmol), HATU (216.5 mg, 0.57 mmol), and Et3N (68.1 mg, 0.67 mmol) in DCM (8 mL) was stirred at room temperature for 16 h. The mixture was diluted with dichloromethane (30 mL), washed with HCl (15 mL, 1.0 N) and brine (20 mL), and dried over sodium sulfate. After filtration, the filtrate was concentrated, and the residue was purified by flash column chromatography on silica gel to obtain the desired product NMX-10021 as a colorless oil (80 mg, 57.6% yield).
MS (ESI+) m/z: 269 (M+H)+.
1H NMR (400 MHz, DMSO-d6) δ 10.98 (s, 1H), 10.09 (s, 1H), 7.76–7.48 (m, 3H), 7.38–7.20 (m, 3H), 7.12 (dd, J = 10.2, 2.3 Hz, 1H), 7.08–6.96 (m, 1H), 6.88–6.83 (m, 1H), 3.71 (s, 2H).
Using the above procedures, the following compounds were prepared.
4.16. N-(3-Acetamidophenyl)-2-(6-fluoro-1H-indol-3-yl)acetamide (NMX-10014)
MS (ESI+) m/z 326 (M + H)+.
1H NMR (400 MHz, DMSO-d6) δ 10.97 (s, 1H), 10.09 (s, 1H), 9.90 (s, 1H), 7.90 (s, 1H), 7.61–7.57 (m, 1H), 7.41–7.02 (m, 5H), 6.87–6.82 (m, 1H), 3.70 (s, 2H), 2.02 (s, 3H).
4.17. 2-(6-Fluoro-1H-indol-3-yl)-1-morpholino-ethanone (NMX-10016)
MS (ESI+) m/z = 263 (M + H)+.
1H NMR (400 MHz, CDCl3) δ 8.14 (s, 1H), 7.53 (dd, J = 8.7, 5.3 Hz, 1H), 7.06–7.02 (m, 2H), 6.92–6.87 (m, 1H), 3.82 (s, 2H), 3.65 (s, 4H), 3.49 (s, 4H).
4.18. 2-(6-Fluoro-1H-indol-3-yl)-N-(1-isopropyl-4-piperidyl)acetamide (NMX-10018)
MS (ESI+) m/z: 318 (M + H)+.
1H NMR (400 MHz, CDCl3) δ: 8.70 (s, 1H), 7.45–7.42 (m, 1H), 7.15–6.99 (m, 2H), 6.92–6.87 (m, 1H), 5.54 (d, J = 7.9 Hz, 1H), 3.80–3.75 (m, 1H), 3.68 (s, 2H), 2.68–2.65 (m, 3H), 2.22–2.16 (m, 2H), 1.85–1.81 (m, 2H), 1.26–1.16 (m, 2H), 0.96 (d, J = 6.6 Hz, 6H).
4.19. 1-(4-Acetylpiperazin-1-yl)-2-(6-fluoro-1H-indol-3-yl)ethanone (NMX-10040)
MS (ESI+) m/z 304 (M + H)+.
1H NMR (400 MHz, DMSO-d6) δ 10.97 (s, 1H), 7.54 (s, 1H), 7.29–7.06 (m, 2H), 6.95–6.74 (m, 1H), 3.79 (s, 2H), 3.65–3.43 (m, 8H), 1.98 (s, 3H).
4.20. N-[(3S)-1-[2-(6-Fluoro-1H-indol-3-yl)acetyl]pyrrolidin-3-yl]acetamide (NMX-10041)
MS (ESI+) m/z: 304 (M + H)+.
1H NMR (400 MHz, CDCl3) δ: 8.46–8.31 (m, 1H), 7.60–7.51 (m, 1H), 7.10–6.99 (m, 2H), 6.92–6.85 (m, 1H), 5.85–5.81 (m, 0.5H), 5.76–5.69 (m, 0.5H), 4.48–4.36 (m, 1H), 3.79–3.65 (m, 3H), 3.64–3.52 (m, 2H), 3.44–3.34 (m, 1H), 2.24–2.00 (m, 1H), 1.94–1.86 (m, 3H), 1.82–1.72 (m, 1H).
4.21. 2-(6-Fluoro-1H-indol-3-yl)-1-(4-hydroxy-1-piperidyl)ethanone (NMX-10086)
MS (ESI+) m/z: 277 (M + H)+.
1H NMR (400 MHz, DMSO-d6) δ 10.95 (s, 1H), 7.58–7.49 (m, 1H), 7.22–7.16 (m, 1H), 7.15–7.05 (m, 1H), 6.89–6.75 (m, 1H), 4.66 (d, J = 4.1 Hz, 1H), 3.99–3.86 (m, 1H), 3.84–3.68 (m, 3H), 3.65–3.55 (m, 1H), 3.21–3.09 (m, 1H), 3.01–2.89 (m, 1H), 1.69–1.49 (m, 2H), 1.23–1.02 (m, 2H).
4.22. N-(3-(2-(Dimethylamino)ethoxy)phenyl)-2-(6-fluoro-1H-indol-3-yl)acetamide (NMX-10095)
MS (ESI+) m/z: 356 (M + H)+.
1H NMR (400 MHz, DMSO-d6) δ 10.98 (s, 1H), 10.10–10.03 (m, 1H), 7.61–7.54 (m, 1H), 7.34–7.29 (m, 1H), 7.25 (d, J = 2.3 Hz, 1H), 7.20–7.07 (m, 3H), 6.89–6.81 (m, 1H), 6.63–6.57 (m, 1H), 3.98 (t, J = 5.8 Hz, 2H), 3.70 (s, 2H), 2.59 (t, J = 5.8 Hz, 2H), 2.19 (s, 6H).
N-[3-[[2-(Dimethylamino)acetyl]amino]phenyl]-2-(6-fluoro-1H-indol-3-yl)acetamide (NMX-10097)
MS (ESI+) m/z 369 (M + H)+.
1H NMR (400 MHz, CD3OD) δ 10.97 (s, 1H), 10.10 (s, 1H), 9.66 (s, 1H), 8.00–7.93 (m, 1H), 7.63–7.54 (m, 1H), 7.36–7.31 (m, 1H), 7.28–7.23 (m, 2H), 7.21–7.15 (m, 1H), 7.12 (dd, J = 10.2, 2.3 Hz, 1H), 6.89–6.80 (m, 1H), 3.70 (s, 2H), 3.04 (s, 2H), 2.26 (s, 6H).
Procedures for indole ketone NMX-10076 are shown in Scheme 2.
4.24. 2-Chloro-1-(6-fluoro-1H-indol-3-yl)ethan-1-one (5)
To a stirred solution of 6-fluoro-1H-indole 1 (1 g, 7.4 mmol) and pyridine (0.3 mL, 7.4 mmol) in toluene (12 mL) at 60 °C was added 2-chloroacetyl chloride (0.84 g, 7.4 mmol) dropwise. After the addition was complete, the reaction mixture was stirred at 60 °C for 1 h. After the mixture was cooled to room temperature, H2O (18 mL) and MeOH (4 mL) were added. The mixture was stirred at room temperature for an additional 1 h. The precipitate was filtered through a sintered glass funnel and washed with H2O to obtain compound 5 as a brown solid (300 mg, 19% yield).
4.25. 1-(6-Fluoro-1H-indol-3-yl)-2-(1-piperidyl)ethanone (NMX-10076)
To a solution of 2-chloro-1-(6-fluoro-1H-indol-3-yl)ethan-1-one 5 (200 mg, 0.94 mmol) and piperidine (120 mg, 1.42 mmol) in tetrahydrofuran (6 mL) was added DIPEA (0.3 mL, 1.9 mmol) dropwise, and the resulting mixture was stirred at room temperature for 16 h. The solvent was removed under vacuum (<25 °C), and the residue was treated with ethyl acetate (10 mL) to produce a precipitate. The precipitate was collected by filtration and was further purified by flash column chromatography to obtain the title product NMX-10076 as a white solid.
MS (ESI+) m/z: 261 (M + H)+.
1H NMR (400 MHz, CDCl3) δ: 8.70 (s, 1H), 8.43–8.40 (m, 1H), 8.39–8.33 (m, 1H), 7.13–7.01 (m, 2H), 3.57 (s, 2H), 2.55 (s, 4H), 1.66–1.60 (m, 4H), 1.50–1.43 (m, 2H).
Acknowledgments
We would like to thank the following persons and institutions: Weihong Zheng and Zhixiong Ye from Viva, Mike Serrano-Wu and Brian Hubbard, and Andrew Lowerson and Key Organics.
Glossary
ABBREVIATIONS
- NMR
nuclear magnetic resonance
- SAR
structure–activity relationship
Supporting Information Available
The Supporting Information is available free of charge at https://pubs.acs.org/doi/10.1021/acs.jmedchem.3c00656.
Comparison of Proton- vs Fluorine- Ligand Detected NMR for Series 1 hit FS-1255; Compound behavior assay for monitoring differences between nominal and true solution concentrations of various ligands prior to dose-response assays; Monitoring aggregation properties of related compounds via a high-throughput 1D NMR assay; HRas apo spectrum and KD by 1D protein observed NMR; 1H,15N HSQC titrations; HRas stability by 1D protein-observed NMR over 96 hrs; Orthogonal biophysical data for selected HRas binders; Binding site mapping based on backbone amide chemical shift perturbations for compound 10097; Supplementary methods (PDF)
Author Contributions
⊥ All authors have given approval to the final version of the manuscript. S.T.L. and Y.A. contributed equally.
Quebec Consortium for Drug Discovery (CQDM), Ministère de l’Économie et de l’Innovation (MEI), NMX Research and Solutions Inc., Mitacs, 3Point Bio, Sprout BioVentures, Viva, NSERC-USRA
The authors declare the following competing financial interest(s): A patent application has been filed for the molecules described in this manuscript: WO2023060362A1.
Supplementary Material
References
- Lu S.; Jang H.; Gu S.; Zhang J.; Nussinov R. Drugging Ras GTPase: A Comprehensive Mechanistic and Signaling Structural View. Chem. Soc. Rev. 2016, 45 (18), 4929–4952. 10.1039/C5CS00911A. [DOI] [PMC free article] [PubMed] [Google Scholar]
- Simanshu D. K.; Nissley D. V.; McCormick F. RAS Proteins and Their Regulators in Human Disease. Cell 2017, 170 (1), 17–33. 10.1016/j.cell.2017.06.009. [DOI] [PMC free article] [PubMed] [Google Scholar]
- Cox A. D.; Fesik S. W.; Kimmelman A. C.; Luo J.; Der C. J. Drugging the Undruggable RAS: Mission Possible? Nat. Rev. Drug Discovery 2014, 13 (11), 828–851. 10.1038/nrd4389. [DOI] [PMC free article] [PubMed] [Google Scholar]
- Lu S.; Jang H.; Muratcioglu S.; Gursoy A.; Keskin O.; Nussinov R.; Zhang J. Ras Conformational Ensembles, Allostery, and Signaling. Chem. Rev. 2016, 116 (11), 6607–6665. 10.1021/acs.chemrev.5b00542. [DOI] [PubMed] [Google Scholar]
- Shuker S. B.; Hajduk P. J.; Meadows R. P.; Fesik S. W. Discovering High-Affinity Ligands for Proteins: SAR by NMR. Science 1996, 274 (5292), 1531–1534. 10.1126/science.274.5292.1531. [DOI] [PubMed] [Google Scholar]
- Dalvit C. NMR Methods in Fragment Screening: Theory and a Comparison with Other Biophysical Techniques. Drug Discovery Today 2009, 14 (21), 1051–1057. 10.1016/j.drudis.2009.07.013. [DOI] [PubMed] [Google Scholar]
- Dalvit C.; Flocco M.; Veronesi M.; Stockman B. J. Fluorine-NMR Competition Binding Experiments for High-Throughput Screening of Large Compound Mixtures. Comb Chem. High Throughput Screen 2002, 5 (8), 605–611. 10.2174/1386207023329923. [DOI] [PubMed] [Google Scholar]
- Lowerson A.; McCarren P.; LaPlante S. R.; Serrano-Wu M.. BIONET 2nd Generation Premium Fragment Library - Building a Diverse and Experimentally-Curated Fragment Library. https://cdn.technologynetworks.com/TN/Resources/PDF/building-a-diverse-and-experimentally-curated-fragment-library.pdf (accessed September 2022).
- LaPlante S. R. ; McCarren P.; Bilodeau F.; Lowerson A.; Serrano-Wu M.. Practical Aspects of Designing the 2nd Generation BIONET Premium Fragment Library. https://www.namiki-s.co.jp/upload/supplier2/149-supplier_content_product-001.pdf (accessed September 2022).
- Shortridge M. D.; Hage D. S.; Harbison G. S.; Powers R. Estimating Protein-Ligand Binding Affinity Using High-Throughput Screening by NMR. J. Comb. Chem. 2008, 10 (6), 948–958. 10.1021/cc800122m. [DOI] [PMC free article] [PubMed] [Google Scholar]
- Jordan J. B.; Poppe L.; Xia X.; Cheng A. C.; Sun Y.; Michelsen K.; Eastwood H.; Schnier P. D.; Nixey T.; Zhong W. Fragment Based Drug Discovery: Practical Implementation Based on 19F NMR Spectroscopy. J. Med. Chem. 2012, 55 (2), 678–687. 10.1021/jm201441k. [DOI] [PubMed] [Google Scholar]
- Fielding L. NMR Methods for the Determination of Protein- Ligand Dissociation Constants. Curr. Top. Med. Chem. 2003, 3 (1), 39–53. 10.2174/1568026033392705. [DOI] [PubMed] [Google Scholar]
- Fischer J. J.; Jardetzky O. Nuclear Magnetic Relaxation Study of Intermolecular Complexes. The Mechanism of Penicillin Binding to Serum Albumin1a. J. Am. Chem. Soc. 1965, 87 (14), 3237–3244. 10.1021/ja01092a040. [DOI] [PubMed] [Google Scholar]
- Akoka S.; Barantin L.; Trierweiler M. Concentration Measurement by Proton NMR Using the ERETIC Method. Anal. Chem. 1999, 71 (13), 2554–2557. 10.1021/ac981422i. [DOI] [PubMed] [Google Scholar]
- Ayotte Y.; Marando V. M.; Vaillancourt L.; Bouchard P.; Heffron G.; Coote P. W.; Larda S. T.; LaPlante S. R. Exposing Small-Molecule Nanoentities by a Nuclear Magnetic Resonance Relaxation Assay. J. Med. Chem. 2019, 62 (17), 7885–7896. 10.1021/acs.jmedchem.9b00653. [DOI] [PubMed] [Google Scholar]
- LaPlante S. R.; Roux V.; Shahout F.; LaPlante G.; Woo S.; Denk M. M.; Larda S. T.; Ayotte Y. Probing the Free-State Solution Behavior of Drugs and Their Tendencies to Self-Aggregate into Nano-Entities. Nat. Protoc. 2021, 16 (11), 5250–5273. 10.1038/s41596-021-00612-3. [DOI] [PubMed] [Google Scholar]
- LaPlante S. R.; Carson R.; Gillard J.; Aubry N.; Coulombe R.; Bordeleau S.; Bonneau P.; Little M.; O’Meara J.; Beaulieu P. L. Compound Aggregation in Drug Discovery: Implementing a Practical NMR Assay for Medicinal Chemists. J. Med. Chem. 2013, 56 (12), 5142–5150. 10.1021/jm400535b. [DOI] [PubMed] [Google Scholar]
- Amin N.; Chiarparin E.; Coyle J.; Nietlispach D.; Williams G. 1H, 15N and 13C Backbone Assignments of GDP-Bound Human H-Ras Mutant G12V. Biomol. NMR Assign. 2016, 10 (1), 121–123. 10.1007/s12104-015-9649-4. [DOI] [PubMed] [Google Scholar]
- Buhrman G.; Kumar V. S. S.; Cirit M.; Haugh J. M.; Mattos C. Allosteric Modulation of Ras-GTP Is Linked to Signal Transduction through RAF Kinase. J. Biol. Chem. 2011, 286 (5), 3323–3331. 10.1074/jbc.M110.193854. [DOI] [PMC free article] [PubMed] [Google Scholar]
- Maurer T.; Garrenton L. S.; Oh A.; Pitts K.; Anderson D. J.; Skelton N. J.; Fauber B. P.; Pan B.; Malek S.; Stokoe D.; Ludlam M. J. C.; Bowman K. K.; Wu J.; Giannetti A. M.; Starovasnik M. A.; Mellman I.; Jackson P. K.; Rudolph J.; Wang W.; Fang G. Small-Molecule Ligands Bind to a Distinct Pocket in Ras and Inhibit SOS-Mediated Nucleotide Exchange Activity. Proc. Natl. Acad. Sci. U.S.A. 2012, 109 (14), 5299–5304. 10.1073/pnas.1116510109. [DOI] [PMC free article] [PubMed] [Google Scholar]
- Sun Q.; Phan J.; Friberg A. R.; Camper D. V.; Olejniczak E. T.; Fesik S. W. A Method for the Second-Site Screening of K-Ras in the Presence of a Covalently Attached First-Site Ligand. J. Biomol. NMR 2014, 60 (1), 11–14. 10.1007/s10858-014-9849-8. [DOI] [PMC free article] [PubMed] [Google Scholar]
- Kessler D.; Gmachl M.; Mantoulidis A.; Martin L. J.; Zoephel A.; Mayer M.; Gollner A.; Covini D.; Fischer S.; Gerstberger T.; Gmaschitz T.; Goodwin C.; Greb P.; Häring D.; Hela W.; Hoffmann J.; Karolyi-Oezguer J.; Knesl P.; Kornigg S.; Koegl M.; Kousek R.; Lamarre L.; Moser F.; Munico-Martinez S.; Peinsipp C.; Phan J.; Rinnenthal J.; Sai J.; Salamon C.; Scherbantin Y.; Schipany K.; Schnitzer R.; Schrenk A.; Sharps B.; Siszler G.; Sun Q.; Waterson A.; Wolkerstorfer B.; Zeeb M.; Pearson M.; Fesik S. W.; McConnell D. B. Drugging an Undruggable Pocket on KRAS. Proc. Natl. Acad. Sci. U. S. A. 2019, 116 (32), 15823–15829. 10.1073/pnas.1904529116. [DOI] [PMC free article] [PubMed] [Google Scholar]
- Burns M. C.; Sun Q.; Daniels R. N.; Camper D.; Kennedy J. P.; Phan J.; Olejniczak E. T.; Lee T.; Waterson A. G.; Rossanese O. W.; Fesik S. W. Approach for Targeting Ras with Small Molecules That Activate SOS-Mediated Nucleotide Exchange. Proc. Natl. Acad. Sci. U. S. A. 2014, 111 (9), 3401–3406. 10.1073/pnas.1315798111. [DOI] [PMC free article] [PubMed] [Google Scholar]
- Hennig M.; Ruf A.; Huber W.. Combining Biophysical Screening and X-Ray Crystallography for Fragment-Based Drug Discovery. In Fragment-Based Drug Discovery and X-Ray Crystallography; Davies T. G., Hyvönen M., Eds.; Springer Berlin Heidelberg: Berlin, Heidelberg, 2012; pp 115–143. [DOI] [PubMed] [Google Scholar]
- Congreve M.; Carr R.; Murray C.; Jhoti H. A ‘Rule of Three’ for Fragment-Based Lead Discovery?. Drug Discovery Today 2003, 8 (19), 876–877. 10.1016/S1359-6446(03)02831-9. [DOI] [PubMed] [Google Scholar]
- Baell J. B.; Holloway G. A. New Substructure Filters for Removal of Pan Assay Interference Compounds (PAINS) from Screening Libraries and for Their Exclusion in Bioassays. J. Med. Chem. 2010, 53 (7), 2719–2740. 10.1021/jm901137j. [DOI] [PubMed] [Google Scholar]
- Khaneja N.; Reiss T.; Kehlet C.; Schulte-Herbrüggen T.; Glaser S. J. Optimal Control of Coupled Spin Dynamics: Design of NMR Pulse Sequences by Gradient Ascent Algorithms. J. Magn. Reson. 2005, 172 (2), 296–305. 10.1016/j.jmr.2004.11.004. [DOI] [PubMed] [Google Scholar]
- Coote P.; Anklin C.; Massefski W.; Wagner G.; Arthanari H. Rapid Convergence of Optimal Control in NMR Using Numerically-Constructed Toggling Frames. J. Magn. Reson. 2017, 281, 94–103. 10.1016/j.jmr.2017.05.011. [DOI] [PMC free article] [PubMed] [Google Scholar]
- Hwang T. L.; Shaka A. J. Water Suppression That Works. Excitation Sculpting Using Arbitrary Wave-Forms and Pulsed-Field Gradients. J. Magn. Reson., Ser. A 1995, 112 (2), 275–279. 10.1006/jmra.1995.1047. [DOI] [Google Scholar]
- Mori S.; Abeygunawardana C.; Johnson M. O.; Vanzijl P. C. M. Improved Sensitivity of HSQC Spectra of Exchanging Protons at Short Interscan Delays Using a New Fast HSQC (FHSQC) Detection Scheme That Avoids Water Saturation. J. Magn. Reson., Ser. B 1995, 108 (1), 94–98. 10.1006/jmrb.1995.1109. [DOI] [PubMed] [Google Scholar]
- Morton C. J.; Pugh D. J.; Brown E. L.; Kahmann J. D.; Renzoni D. A.; Campbell I. D. Solution Structure and Peptide Binding of the SH3 Domain from Human Fyn. Structure 1996, 4 (6), 705–714. 10.1016/S0969-2126(96)00076-7. [DOI] [PubMed] [Google Scholar]
- Williamson M. P. Using Chemical Shift Perturbation to Characterise Ligand Binding. Prog. Nucl. Magn. Reson. Spectrosc. 2013, 73, 1–16. 10.1016/j.pnmrs.2013.02.001. [DOI] [PubMed] [Google Scholar]
Associated Data
This section collects any data citations, data availability statements, or supplementary materials included in this article.