

Abstract
Objective
The objective of this study was to examine clinicians' patient selection and result interpretation of a clinically validated mass spectrometry test measuring amyloid beta and ApoE blood biomarkers combined with patient age (PrecivityAD® blood test) in symptomatic patients evaluated for Alzheimer's disease (AD) or other causes of cognitive decline.
Methods
The Quality Improvement and Clinical Utility PrecivityAD Clinician Survey (QUIP I, ClinicalTrials.gov Identifier: NCT05477056) was a prospective, single‐arm cohort study among 366 patients evaluated by neurologists and other cognitive specialists. Participants underwent blood biomarker testing and received an amyloid probability score (APS), indicating the likelihood of a positive result on an amyloid positron emission tomography (PET) scan. The primary study outcomes were appropriateness of patient selection as well as result interpretation associated with PrecivityAD blood testing.
Results
A 95% (347/366) concordance rate was noted between clinicians' patient selection and the test's intended use criteria. In the final analysis including these 347 patients (median age 75 years, 56% women), prespecified test result categories incorporated 133 (38%) low APS, 162 (47%) high APS, and 52 (15%) intermediate APS patients. Clinicians' pretest and posttest AD diagnosis probability changed from 58% to 23% in low APS patients and 71% to 89% in high APS patients (p < 0.0001). Anti‐AD drug therapy decreased by 46% in low APS patients (p < 0.0001) and increased by 57% in high APS patients (p < 0.0001).
Interpretation
These findings demonstrate the clinical utility of the PrecivityAD blood test in clinical care and may have added relevance as new AD therapies are introduced.
Introduction
The standard of care evaluation of adult patients presenting with symptoms of cognitive impairment includes a review of the patient's history, physical examination, neurocognitive assessment, and structural imaging. However, this approach lacks specificity for detecting the underlying pathological basis of the clinical presentation. 1 As a consequence, misdiagnosis rates for Alzheimer's disease (AD) range from 30 to 50%. 2 , 3 This level of diagnostic accuracy is inadequate for determining treatment options as new AD‐specific therapies become available. Amyloid positron emission tomography (PET) scans and cerebrospinal fluid (CSF) biomarkers substantially reduce misdiagnosis rates. 4 However, their use is limited in routine clinical care due to high costs, logistic complexities, and patient burden. Nearly 60 million people residing in rural areas may not have access to such medical innovations, and African Americans have lower rates of PET scan use, despite AD prevalence rates ~1.5–2 times higher than non‐Hispanic Whites. 5 , 6 Therefore, a significant medical need exists for safe, less resource‐intensive, and broadly available testing that identifies the presence or absence of brain amyloid plaques, a pathological hallmark of AD. 7 Such testing would facilitate more timely AD diagnosis and help guide clinicians in their use of current and emerging anti‐AD therapies as well as aid in ruling out AD to allow for other diagnostic considerations. Blood biomarkers (BBMs) offer advantages over PET imaging and CSF biomarkers, potentially fulfilling these unmet needs. 8
The PrecivityAD® blood test is a validated laboratory developed test (LDT) performed in a Clinical Laboratory Improvement Amendments (CLIA)‐certified, College of American Pathologists (CAP)‐accredited laboratory facility (C2N Diagnostics, St. Louis, MO). The test relies on high‐resolution mass spectrometry to analyze biomarkers in the peripheral blood to help clinicians evaluate the likelihood of brain amyloid in patients with symptoms of mild cognitive impairment or dementia. The PrecivityAD blood test quantifies an individual's plasma Aβ42/40 ratio and identifies apolipoprotein E isoform‐specific peptides (ApoE proteotype) to infer APOE genotype by mass spectrometry. An algorithm combines Aβ42/40 ratio, ApoE proteotype, and age variables to derive the amyloid probability score (aps), the PrecivityAD blood test read‐out. The APS is reported as a result from 0 to 100 and further categorized as low (0–35), intermediate (36–57), and high (58–100), corresponding to the likelihood of brain amyloid positivity on an amyloid PET scan. 9
In a clinical validity study of 686 patients derived from the plasma test for amyloidosis risk screening (PARIS) study (a subset of the IDEAS Study) (ClinicalTrials.gov Identifier: NCT02420756) and the MissionAD study (ClinicalTrials.gov Identifier: NCT02956486), the PrecivityAD blood test showed 92% sensitivity and 77% specificity. 10 In addition, the test had a negative predictive value (NPV) of 86% and a positive predictive value (PPV) of 86% in a population with 60% prevalence of brain amyloid as determined by amyloid PET imaging, when the intermediate score category of patients (14% of participants) were excluded. A more recently published analysis based on an independent cohort of participants from the Australian Imaging, Biomarker & Lifestyle Flagship Study of Ageing (AIBL) demonstrated that the PrecivityAD blood test with its validated, established cutoff values maintained high diagnostic accuracy for identifying the presence of absence of brain amyloid plaques. 11 In addition, two recent studies that evaluated the combination of plasma Aβ42/Aβ40 and APO Eε4 as well as the BBM combination plus age showed high correspondence with amyloid PET and provided Class II evidence that plasma Aβ42/Aβ40 levels accurately determine amyloid PET status. 12 , 13
While the clinical validity of the PrecivityAD blood test has been demonstrated, changes in clinical decision‐making (clinical utility) associated with the test and test results have not been reported. The objective of this study was to assess clinicians' patient selection for the PrecivityAD blood test as compared to its intended use criteria as well as clinicians' interpretation of the test result, the APS, through clinician surveys.
Methods
Study participants
The PrecivityAD blood test is intended for use in patients aged 60 and older with signs or symptoms of mild cognitive impairment or dementia undergoing evaluation for AD or other causes of cognitive decline. The indication for use for the PrecivityAD blood test is to aid healthcare providers in determining the presence or absence of brain amyloid plaques in the evaluation of cognitive impairment.
Participating patients were selected largely on the basis of convenience sampling among academic cognitive centers and large community‐based clinical neurology practice sites. The eligibility criteria for the study reflected the real‐world use of the PrecivityAD blood test that was offered to patients who fit its intended use as described above. The projected sample size was 300 patients.
Clinicians recruited for this study included neurologists or other cognitive specialists in the United States who are part of a practice that sees at least 50 patients per week and devotes at least 25% or more of their time to the evaluation of patients with cognitive impairment. The study clinicians had full discretion on the selection for patients for BBM testing and subsequent decisions on patient management.
Study design
A clinically and analytically validated mass spectrometry blood test and an algorithm combining Aβ42/40 ratio, ApoE proteotype and age (PrecivityAD blood test) variables yielding the APS has been previously described. 9 , 10 , 11 , 14 The main validation paper was focused on a cohort study that included analysis from two independent cross‐sectional cohort studies: the PARIS study, a prospective add‐on subset (n = 249) to the Imaging Dementia–Evidence for Amyloid Scanning study (ClinicalTrials.gov Identifier: NCT02420756) as well as the cohort (n = 437) of the MissionAD study (ClinicalTrials.gov Identifier: NCT02956486) who underwent amyloid PET testing. The reference standard used in this analysis was the presence or absence of brain amyloid on amyloid PET scan. Blood sample and demographic information were used to derive a logistic regression model incorporating Aβ42/40 ratio, ApoE proteotype, and age yielding an AUC of 0.88 (95% CI, 0.85–0.91) and accuracy of 81% (95% CI, 78–84%). The output of this logistic regression model was the APS.
The following APS categories were prespecified and defined as follows: low APS (0–35), consistent with a negative amyloid PET result and a low likelihood of amyloid plaques; intermediate APS (36–57), not consistent with the positive or negative amyloid PET result; and high APS (58–100), consistent with a positive amyloid PET result and a high likelihood of amyloid plaques. Excluding intermediate data points resulted in APS performance with sensitivity of 92% (95% CI, 88–95%) and a specificity of 77% (95% CI, 71–81%). 10
The Quality Improvement and Clinical Utility PrecivityAD Clinician Survey (QUIP I) study (ClinicalTrials.gov Identifier: NCT05477056) was designed as a prospective, single‐cohort quality improvement study and survey to assess patient selection and result interpretation of the PrecivityAD blood test by clinicians in patients with symptoms of mild cognitive impairment or dementia. The study received an exemption determination from a central Institutional Review Board (IRB) (Advarra, Columbia, MD). Under this exemption, written informed consent for study participation was not required from the cognitive specialist or the patient participant. This study followed the CONSORT reporting guideline.
Neurologists and other cognitive specialists received education on the intended use of the PrecivityAD blood test as well as the APS result and APS categories. Upon test ordering, patient blood samples were collected and sent to the C2N laboratory for analysis. This LDT is commercially available in 49 states and has its FDA oversight through CLIA regulations. 15 The APS result (0–100) as well as the APS category were reported on each test, and the test results were reported back to the study clinicians by dedicated fax line.
Following the receipt of each patient's test result, the participating clinicians completed an online survey. This survey asked the clinicians for their assessment of pretest and posttest probability of AD diagnosis as well as clinical management plan for each patient. Patient demographic information (sex at birth, age, ethnicity, and race) along with symptomatic status were also collected. The clinician survey data were aligned with the clinical laboratory test result generated from the PrecivityAD blood test result by an accession ID: a unique study identification number was then assigned.
Study outcomes
Patient selection was evaluated in terms of concordance of clinicians' test ordering with the intended use criteria of the PrecivityAD blood test. Score interpretation of the PrecivityAD blood test result was evaluated in terms of changes in clinician‐reported pretest and posttest probability of AD (0–100%) as well as AD drug therapy (acetylcholinesterase inhibitors and memantine) pretest and posttesting as reported on the clinician survey. Distribution of APS results across the three previously described categories of low (0–35), intermediate (36–57), and high (58–100) APS were evaluated. Qualitative outcomes including clinician impressions following BBM testing were recorded.
Statistical analysis
Participant demographics and disease characteristics were described by summary statistics (e.g., mean and standard deviation for continuous variables such as age as well as percentage for categorical variables such as sex). Summary statistics of the survey data were provided for different subgroups (e.g., APS categories), which were compared by hypothesis test methods using paired t‐test and chi‐squared test methods. The relationships between APS and clinician‐reported pretest and posttest probability of AD were fitted using linear models, and the associations were evaluated with Pearson correlation coefficients provided. All hypothesis testing was two‐sided, and a p‐value < 0.05 was considered statistically significant. All data analyses were performed using R 4.2.2 software. 16
Results
Study participants
Patients
A total of 366 patients received PrecivityAD blood testing as part of this initiative from March 2021 to September 2022. The final analysis cohort included 347 patients, which translated to 95% (347/366) concordance with the intended use of the PrecivityAD blood test. Reasons for exclusion were use of the test outside of the intended use, including patients below the age of 60 (n = 16) and patients without symptoms (n = 3) (Fig. 1). The final analysis cohort of 347 patients included patients who had a median age of 75 years old and were 56% female and 90% White (Table 1).
Figure 1.
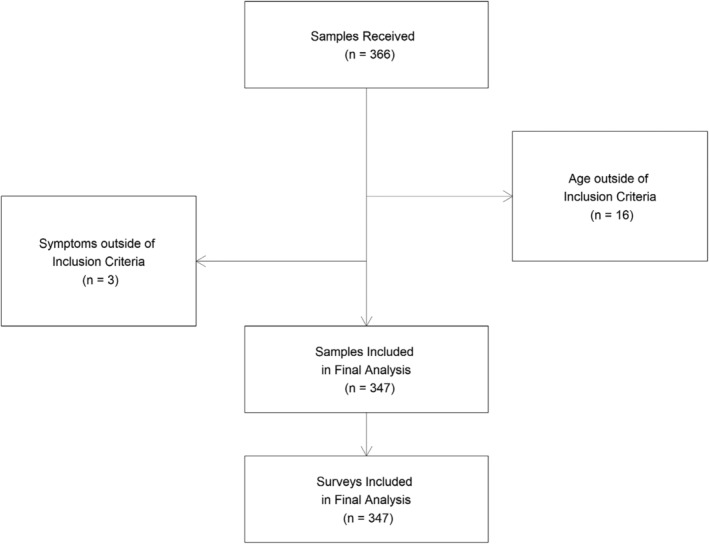
CONSORT diagram with patient blood sample and clinician survey flow. A total of 366 patient blood samples were received. A total of 347/366 (95%) patients met the intended use criteria for the test and were included in the final analysis. Clinicians completed 347/347 (100%) of surveys matched to these patient blood samples.
Table 1.
QUIP I study demographics: Final analysis cohort.
| Summary statistics | |
|---|---|
| Number of patients | (N = 347) |
| Age (years) | |
| Mean (SD) | 74.4 (6.5) |
| Median [min, max] | 74.8 [59.7, 90.8] |
| Gender, n (%) | |
| Female | 194 (55.9%) |
| Male | 153 (44.1%) |
| Race, n (%) | |
| Asian | 12 (3.5%) |
| Black or African American | 22 (6.3%) |
| White | 313 (90.2%) |
| Ethnicity, n (%) | |
| Hispanic or Latino | 7 (2.0%) |
| Not Hispanic or Latino | 340 (98.0%) |
| Cognitive impairment, n (%) | |
| Yes | 347 (100.0%) |
Clinicians
A total of 29 neurologists and 14 other cognitive specialists (geriatricians, geriatric psychiatrists, others) from 15 sites (10 academic medical centers and 5 private medical group practices) were included. Clinicians returned survey information on pretest and posttest evaluations of each patient's AD diagnosis probability and management plans for 100% (347/347) of the final analysis cohort. The mean time for survey completion by the clinicians was reported to be 6 minutes.
APS results
APS results from the PrecivityAD blood test were returned to the clinician for 100% (347/347) of the final analysis cohort, with a median turnaround time of 14 days. The median APS for the overall cohort was 51, with a range of 0–100. Using the prespecified APS result cutoffs, 38% (133/347) of patients had low APS, 15% (52/347) had intermediate APS, and 47% (162/347) had high APS.
Alzheimer's disease probability pre‐ and post‐PrecivityAD testing
A marked shift in distribution of clinician‐reported probability of AD diagnosis occurred after the APS results were reported, with a separation of the curve into clinician‐reported probability of AD concentrated in the low and high probability range (p < 0.0001) (Fig. 2). Comparison testing did not reveal any evidence of heterogeneity across the clinical practice study sites or across clinicians for any study outcomes.
Figure 2.

Change in distribution of clinician‐reported probability of Alzheimer's disease (AD) pre‐ and post‐ PrecivityAD blood testing. Clinician‐reported probability of disease is reported in percentage. Pre‐test probability (figure on left) was derived from the clinician survey to reflect probability of AD before PrecivityAD testing. Post‐test probability (figure on right) was derived from the clinician survey to reflect probability of AD after PrecivityAD testing. Data were analyzed using t‐tests.
The concordance between APS with clinician‐reported probability of AD differed pre‐ and post‐PrecivityAD blood testing (Fig. 3). Clinician‐reported pretest probability of AD had a weak positive correlation with APS (Pearson correlation coefficient of 0.35, slope of 0.21, p < 0.0001), while post‐test probability of AD had a strong positive correlation with APS (Pearson correlation coefficient of 0.88, slope of 0.97, p < 0.0001).
Figure 3.
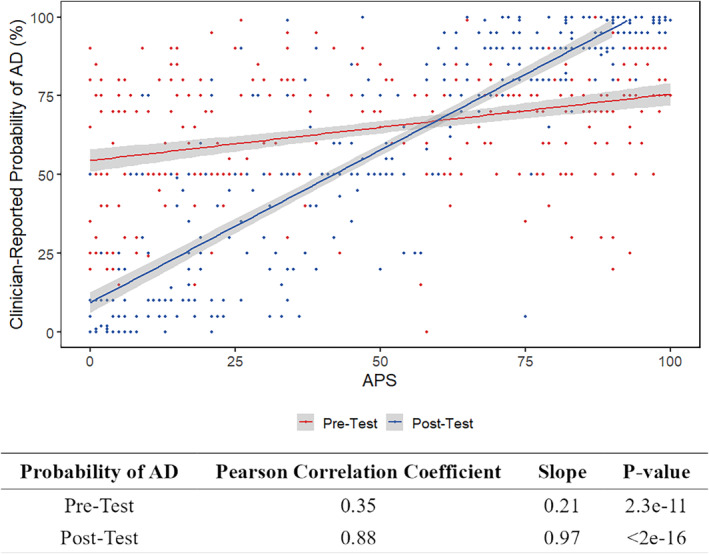
Correlation between APS and clinician‐reported probability of Alzheimer's disease (AD). Clinician‐reported probability of disease is reported in percentage. Amyloid Probability Score (APS) from PrecivityAD blood testing is reported as a score from 0 to 100. The pre‐test probability for each patient is represented as a red dot, and the red line represents the best fit line showing correlation between APS and pre‐test probability of AD. The post‐test probability for each patient is reported as a blue dot, and the blue line represents the best fit line showing correlation between APS and post‐test probability of AD. Pearson correlation coefficients are presented.
The changes in clinician‐reported probability of AD on an individual patient basis were well aligned directionally with the APS results (Fig. 4C). The mean clinician‐reported probability of AD changed pretest to posttest from 58% to 23% (Low APS group), 64% to 52% (Intermediate APS group), and 71% to 89% (High APS group), respectively (p < 0.0001 for all APS groups).
Figure 4.
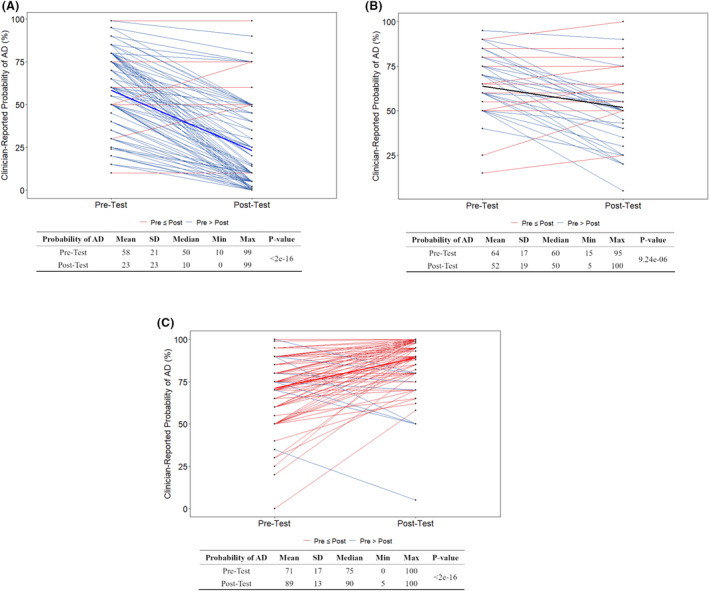
Clinician‐reported pre‐ and post‐test probability of Alzheimer's disease (AD) by Amyloid Probability Score (APS) category from PrecivityAD blood testing. Clinician‐reported probability of disease is reported in percentage. Blue lines indicate a decrease in reported probability of AD from pre‐test to post‐test. Red lines indicate an increase in reported probability of AD from pre‐test to post‐test. APS groups are defined by APS results from PrecivityAD blood testing as Low (0–35) (A), Intermediate (36–57) (B), and High (58–100) (C). Data were analyzed using t‐tests.
Alzheimer's disease drug therapy pre‐ and post‐PrecivityAD blood testing
Overall, 33% (116/347) of patients had planned changes in their AD drug therapy. The changes in AD drug therapy on an individual patient basis were well aligned directionally with the APS results (Table 2). Among patients with low APS, the overall use of AD drug therapy decreased significantly pretesting to posttesting from 48% (64/133) to 26% (34/133), representing a 46% relative decrease (p < 0.0001). In patients with High APS, the overall use of AD drug therapy increased significantly pre‐ to post‐testing from 56% (91/162) to 88% (142/162), representing a 57% relative increase (p < 0.0001). There was a non‐significant change in the use of AD drugs in patients with Intermediate APS from 50% (26/52) to 40% (21/52) pre‐ to post‐testing (p = 0.431).
Table 2.
Changes in AD drug prescribing pre‐ and post‐PrecivityAD blood testing.
| APS category | AD drug use | p‐value | Relative change from usual care | |
|---|---|---|---|---|
| Pre | Post | |||
| Low (n = 133) | 64 (48%) | 34 (26%) | <0.0001 | 46% decrease |
| Intermediate (n = 52) | 26 (50%) | 21 (40%) | 0.431 | 20% decrease |
| High (n = 162) | 91 (56%) | 142 (88%) | <0.0001 | 57% increase |
| Overall | 181 (52%) | 197 (57%) | 0.253 | 10% increase |
Clinician impressions following PrecivityAD blood testing
Selected qualitative data from the clinician survey highlight the changes in clinician‐reported probability of AD as well as changes in patient management associated with the APS results (Table 3). Clinicians reported value in APS results in both the Low APS and High APS categories.
Table 3.
Clinician impressions following PrecivityAD blood testing.
| High APS | Low APS |
|---|---|
|
“Did PrecivityAD in place of lumbar puncture since patient is on xarelto; if Precivity AD was not positive for AD, then would proceed with LP and stop xarelto beforehand ‐ but these results make the LP unnecessary” (APS 94) “Getting Precivity has allowed me to treat him and get him stable on a cholinesterase inhibitor in anticipation of clinical trial screening where he will get amyloid PET” (APS 90) “Would never have been able to determine amyloidopathy in this complicated pt without biomarker testing” (APS 76) |
“Patient will be weaning off donepezil, working more on her depression and anxiety with her pcp” (APS 13) “Stop donepezil” (APS 4) “Completely changed management from treatment for possible Alzheimer's disease to more aggressive treatment of profound depression and possible Lewy body disease” (APS 2) |
Discussion
Blood biomarkers offer the potential for simple‐to‐obtain and scalable testing to support clinicians in the diagnosis of AD. The 2022 EU/US Clinical Trials on Alzheimer's disease (CTAD) Task Force report stated that BBMs have the potential for being more accessible and cheaper (less invasive, time‐intense, costly, infrastructure‐dependent, and resource requiring) than PET and CSF biomarkers. 3 Furthermore, BBMs may provide additional value in the diagnostic assessment of cognitively impaired patients presenting to cognitive specialists through changes in clinical diagnoses, improved diagnostic confidence, and changes to patient management. According to this report, BBMs may improve detection, diagnostic accuracy, patient‐centered autonomy and empowerment, and better overall care. The FDA's recent accelerated approval of lecanemab on the basis of amyloid reduction adds further to the urgency of the development of such BBMs in the real‐world setting. 17
A blood test assessing brain amyloid pathology to aid clinicians in the evaluation of patients with symptoms of cognitive impairment should have three important properties. 18 First, the biomarker should show the application of 3R's in its development: AccuRacy (solid clinical performance characteristics in the intended use population), Robustness (consistency with use of pre‐specified cutoffs) and Regulation (demonstration of analytical and clinical validity). Second, the test should be simple to use and interpret, non‐invasive, and easily accessible to clinicians and patients to help diagnose AD. Third, such a test should be able to rule out and rule in brain amyloid and influence clinical decision making around diagnosis as well as management strategies. 1 , 19 , 20 As observed in this study, the PrecivityAD blood test and the APS result showed evidence of all these key features.
The study results presented here show the promise of PrecivityAD blood test results to change patient management. Building on previous studies of clinical validity of the PrecivityAD blood test, this study showed clinical utility of the PrecivityAD blood test in its association with changes in clinician decision‐making around AD diagnosis probability and drug therapy management in patients evaluated for mild cognitive impairment or dementia. Clinicians reported Low APS patients to have a lower AD probability post‐test and were less likely to manage these patients with AD drug therapy, consistent with ruling out AD. Clinicians reported High APS patients to have a higher AD probability post‐test and were more likely to manage these patients with AD drug therapy, consistent with ruling in AD. Among the 347 patients, 85% (295/347) had clinically useful Low or High APS results.
The study findings of change in AD drug therapy closely parallel those seen in the large, real‐world studies of clinical utility of amyloid PET scans and CSF biomarkers. 21 , 22 , 23 , 24 In the ABIDE study of 507 patients with cognitive impairment evaluated at VU University Medical Center in North Holland, 24% of patients had a change in treatment post‐amyloid PET scan, mostly related to additional investigations and therapy. 25 As reported by Rabinovici and colleagues from the US‐based IDEAS Study, among patients with positive amyloid PET scan results, the overall use of AD drugs in the population increased by ~50–100%. 26
While the role of brain amyloid in the development of AD has been disputed in the past, the findings of the CLARITY‐AD (lecanemab) and TRAILBLAZER‐ALZ 2 (donanemab) studies shine a new and favorable light on this topic. 27 , 28 In the CLARITY‐AD study, the anti‐amyloid antibody lecanemab resulted in a significant reduction in amyloid plaques and a slowing of clinical decline. 27 The observed brain amyloid reduction as measured by quantitative amyloid PET correlated with clinical benefit and disease‐modifying effects as well as dynamic changes in plasma BBMs used to assess lecanemab treatment effects. In both the CLARITY‐AD and lecanemab 201 Phase 2 studies, plasma concentrations of Aβ42 and Aβ40 as well as the ratio of plasma Aβ42/40 were measured using the same immunoprecipitation/liquid chromatography‐mass spectrometry/mass spectrometry (IP/LC–MS/MS) technology assay used in our PrecivityAD blood test. 27 , 29 In the TRAILBLAZER‐ALZ 2 study, donanemab slowed clinical decline by 35% compared to placebo and resulted in 40% less decline in the ability to perform activities of daily living. 28
We note several limitations regarding the study design and results reported here. First, the effects of the proposed clinical action plan on clinical outcomes were not directly evaluated; however, an accurate diagnosis of mild cognitive impairment and early AD through the use of a BBM test can help facilitate the prescribing of drug therapy, which has been shown to improve patient outcomes on several domains. 27 , 28 Second, the study design included a single study cohort and no control group; therefore, only associations rather than causations between the PrecivityAD blood test's output, the APS result, and changes in AD diagnosis probability and drug therapy can be made. Third, we used the APS result rather than amyloid PET scan findings as the measure of truth here to define brain amyloid; however, we have previously shown the clinical validity of the PrecivityAD blood test and APS result in evaluating the presence or absence of amyloid plaque. Lastly, there was an underrepresentation of non‐White populations in this study, although previous studies have highlighted the clinical validity of the PrecivityAD blood test across African Americans and non‐White Hispanics. 30
In conclusion, while previous studies have demonstrated that the use of amyloid PET and CSF biomarkers are associated with changes in clinician‐reported probability of AD diagnosis as well as changes in AD drug therapy, this study is among the first to show clinical management changes by cognitive specialists using a BBM test assessing the presence or absence of brain amyloid among symptomatic patients being evaluated for AD or other causes of cognitive decline. Larger trials with longer follow‐up are warranted to further explore the effect of the PrecivityAD blood test results on changes in diagnostic and management strategies as well as patient outcomes.
Author Contributions
Data access: West, Ortega, and Monane had full access to all of the data in the study and took responsibility for the integrity of the data and the accuracy of the data analysis. Concept and design: Monane, Henderson, Ortega, Fogelman, West, and Braunstein. Acquisition, analysis, or interpretation of data: Monane, Johnson, Snider, Turner, Drake, Maraganore, Bicksel, Jacobs, Ortega, Jiang, Huang, West, Braunstein. Drafting of the manuscript: Monane, Ortega, Coppinger, Fogelman, West, Braunstein. Critical revision of the manuscript for important intellectual content: Monane, Johnson, Snider, Turner, Drake, Maraganore, Bicksel, Jacobs, Ortega, Henderson, Jiang, Huang, Coppinger, Fogelman, West, Braunstein. Statistical analysis: Jiang, Huang, West. Administrative, technical, or material support: Monane, Ortega, Henderson, Jiang, Huang, West, Braunstein. Supervision: Monane, Ortega, Jiang, Huang, West, Braunstein.
Funding Information
This study was funded by C2N Diagnostics.
Conflict of Interest
Dr. Monane, Ms. Ortega, Ms. Henderson, Dr. Fogelman, Ms. Coppinger, Dr. West, and Dr. Braunstein are full time employees and/or advisors of C2N Diagnostics who have received cash and equity compensation. Dr. Johnson has no conflicts of interest and nothing to disclose. Dr. Snider serves as a consultant and Advisory Board member for Biogen and Eisai. Dr. Snider received clinical trial support from Eli Lilly, Eisai, Biogen, and Hoffman LaRoche. Dr. Turner reports research support to Georgetown University from Biogen, Lilly, Eisai, Cognition Therapeutics, Janssen, Alector, Vaccinex, and Vivoryon. He serves as a consultant to Recognition Health. Dr. Drake has no conflicts of interest and nothing to disclose. Dr Maraganore has no conflicts of interest to report and nothing to disclose. Dr. Bicksel has no conflicts of interest to report and nothing to disclose. Dr. Jacobs has received compensation for expert testimony. Ms. Jiang is a consultant to C2N Diagnostics. Dr. Huang is a consultant to C2N Diagnostics.
Acknowledgments
We would like to acknowledge and thank all the patients and collaborators participating in the QUIP I Study. We would like to acknowledge and thank Jolonda Hibbler and Chad Thieman as well as the members of the dedicated team at C2N Diagnostics for the conduct of this study.
The authors would like to thank the following site lead team members who contributed to the conduct of this study:
Darren Gitelman, MD (Advocate Aurora Health), Daniel Parker, MD (Duke University), Kathleen Johnson, CRNP (Georgetown University), Kristi George, MD (JWM Neurology), Audrey Nuccio, MD (Laureate Medical Group), Jennifer Fairbank, APRN (Neurological Services of Orlando), Chad Yucus, MD (Northshore University), Gregory Ferenz, DO (Pacific Crest Neurology), Chuang‐Kuo Wu, MD, PhD (Rhode Island Hospital), Sereen Askar, APN (Tulane University), Kenneth S. Sharlin, MD, MPH (Sharlin Health Neuroscience Research Center), Maureen O'Marro, DO (Springfield Clinic), Heather Wynne‐Phillips, APRN (University of South Florida), Suzanne Schindler, MD, PhD (Washington University).
Funding Statement
This work was funded by C2N Diagnostics.
References
- 1. Porsteinsson AP, Isaacson RS, Knox S, Sabbagh MN, Rubino I. Diagnosis of early Alzheimer's disease: clinical practice in 2021. J Prev Alzheimers Dis. 2021;8(3):371‐386. doi: 10.14283/jpad.2021.23 [DOI] [PubMed] [Google Scholar]
- 2. Sevigny J, Suhy J, Chiao P, et al. Amyloid PET screening for enrichment of early‐stage Alzheimer disease clinical trials: experience in a phase 1b clinical trial. Alzheimer Dis Assoc Disord. 2016;30(1):1‐7. doi: 10.1097/WAD.0000000000000144 [DOI] [PubMed] [Google Scholar]
- 3. Angioni D, Delrieu J, Hansson O, et al. Blood biomarkers from research use to clinical practice: what must be done? A report from the EU/US CTAD Task Force. J Prev Alzheimers Dis. 2022;9(4):569‐579. doi: 10.14283/jpad.2022.85 [DOI] [PMC free article] [PubMed] [Google Scholar]
- 4. Chapleau M, Iaccarino L, Soleimani‐Meigooni D, Rabinovici GD. The role of amyloid PET in imaging neurodegenerative disorders: a review. J Nucl Med. 2022;63(Suppl 1):13S‐19S. doi: 10.2967/jnumed.121.263195 [DOI] [PMC free article] [PubMed] [Google Scholar]
- 5. Tsoy E, Kiekhofer RE, Guterman EL, et al. Assessment of racial/ethnic disparities in timeliness and comprehensiveness of dementia diagnosis in California. JAMA Neurol. 2021;78(6):657‐665. doi: 10.1001/jamaneurol.2021.0399 [DOI] [PMC free article] [PubMed] [Google Scholar]
- 6. United States Census Bureau . What is Rural America. 2021. https://www.census.gov/library/stories/2017/08/rural‐america.html. Accessed May 26, 2023
- 7. Alzheimer's Association . Medical Tests for Diagnosing Alzheimer's. 2023. https://www.alz.org/alzheimers‐dementia/diagnosis/medical_tests#:~:text=A%20standard%20medical%20workup%20for,Alzheimer's%20but%20require%20different%20treatment. Accessed May 21, 2023
- 8. Thijssen EH, Rabinovici GD. Rapid progress toward reliable blood tests for Alzheimer disease. JAMA Neurol. 2021;78(2):143‐145. doi: 10.1001/jamaneurol.2020.4200 [DOI] [PubMed] [Google Scholar]
- 9. West T, Kirmess KM, Meyer MR, et al. A blood‐based diagnostic test incorporating plasma aβ42/40, ApoE proteotype, and age accurately identifies brain amyloid status: findings from a multi‐cohort validity analysis. Mol Neurodegen. 2021;16(1):30. doi: 10.1186/s13024-021-00451-6 [DOI] [PMC free article] [PubMed] [Google Scholar]
- 10. Hu Y, Kirmess KM, Meyer MR, et al. Assessment of a plasma amyloid probability score to estimate amyloid positron emission tomography findings among adults with cognitive impairment. JAMA Netw Open. 2022;5(4):e228392. Published 2022 Apr 1. doi: 10.1001/jamanetworkopen.2022.8392 [DOI] [PMC free article] [PubMed] [Google Scholar]
- 11. Fogelman I, West T, Braunstein JB, et al. Independent study demonstrates amyloid probability score accurately indicates amyloid pathology. Ann Neurol. 2023;10:765‐778. doi: 10.1002/acn3.51763 [DOI] [PMC free article] [PubMed] [Google Scholar]
- 12. Schindler SE, Bollinger JG, Ovod V, et al. High‐precision plasma β‐amyloid 42/40 predicts current and future brain amyloidosis. Neurology. 2019;93(17):e1647‐e1659. doi: 10.1212/WNL.0000000000008081 [DOI] [PMC free article] [PubMed] [Google Scholar]
- 13. Li Y, Schindler SE, Bollinger JG, et al. Validation of plasma amyloid‐β 42/40 for detecting Alzheimer disease amyloid plaques. Neurology. 2022;98(7):e688‐e699. doi: 10.1212/WNL.0000000000013211 [DOI] [PMC free article] [PubMed] [Google Scholar]
- 14. Kirmess KM, Meyer MR, Holubasch MS, et al. The PrecivityAD™ test: accurate and reliable LC‐MS/MS assays for quantifying plasma amyloid beta 40 and 42 and apolipoprotein E proteotype for the assessment of brain amyloidosis. Clin Chim Acta. 2021;519:267‐275. [DOI] [PMC free article] [PubMed] [Google Scholar]
- 15. US Food and Drug Administration . Laboratory Developed Tests. 2018. https://www.fda.gov/medical‐devices/in‐vitro‐diagnostics/laboratory‐developed‐tests. Accessed May 11, 2023
- 16. The R Foundation . The R Project for Statistical Computing. 2022. https://www.r‐project.org/. Accessed May 21, 2023
- 17. US Food and Drug Administration . FDA Grants Accelerated Approval for Alzheimer's Disease Treatment. 2023. https://www.fda.gov/news‐events/press‐announcements/fda‐grants‐accelerated‐approval‐alzheimers‐disease‐treatment. Accessed May 10, 2023.
- 18. Hansson O, Edelmayer RM, Boxer AL, et al. The Alzheimer's Association appropriate use recommendations for blood biomarkers in Alzheimer's disease. Alzheimers Dement. 2022;18:2669‐2686. doi: 10.1002/alz.12756 [DOI] [PMC free article] [PubMed] [Google Scholar]
- 19. Liu JL, Hlavka JP, Hillestad R, Mattke S. Assessing the Preparedness of the U.S. Health Care System Infrastructure for an Alzheimer's Treatment. 2017. https://www.rand.org/pubs/research_reports/RR2272.html. Accessed May 6, 2023 [PMC free article] [PubMed]
- 20. Alzheimer's Association . Why Get Checked? 2022. https://www.alz.org/alzheimers‐dementia/diagnosis/why‐get‐checked#:~:text=Receiving%20an%20early%20Alzheimer's%20diagnosis,access%20resources%20and%20support%20programs. Accessed April 2, 2023
- 21. Grundman M, Johnson KA, Lu M, et al. Effect of amyloid imaging on the diagnosis and management of patients with cognitive decline: impact of appropriate use criteria. Dement Geriatr Cogn Disord. 2016;41(1–2):80‐92. doi: 10.1159/000441139 [DOI] [PMC free article] [PubMed] [Google Scholar]
- 22. Pontecorvo MJ, Siderowf A, Dubois B, et al. Effectiveness of florbetapir PET imaging in changing patient management. Dement Geriatr Cogn Disord. 2017;44(3–4):129‐143. doi: 10.1159/000478007 [DOI] [PMC free article] [PubMed] [Google Scholar]
- 23. Boccardi M, Altomare D, Ferrari C, et al. Assessment of the incremental diagnostic value of florbetapir F 18 imaging in patients with cognitive impairment: the incremental diagnostic value of amyloid PET with [18F]‐florbetapir (INDIA‐FBP) study. JAMA Neurol. 2016;73(12):1417‐1424. doi: 10.1001/jamaneurol.2016.3751 [DOI] [PubMed] [Google Scholar]
- 24. Hazan J, Wing M, Liu KY, Reeves S, Howard R. Clinical utility of cerebrospinal fluid biomarkers in the evaluation of cognitive impairment: a systematic review and meta‐analysis. J Neurol Neurosurg Psychiatry. 2023;94:113‐120. doi: 10.1136/jnnp-2022-329530 [DOI] [PubMed] [Google Scholar]
- 25. de Wilde A, van der Flier WM, Pelkmans W, et al. Association of amyloid positron emission tomography with changes in diagnosis and patient treatment in an unselected memory clinic cohort: the ABIDE project. JAMA Neurol. 2018;75(9):1062‐1070. doi: 10.1001/jamaneurol.2018.1346 [DOI] [PMC free article] [PubMed] [Google Scholar]
- 26. Rabinovici GD, Gatsonis C, Apgar C, et al. Association of amyloid positron emission tomography with subsequent change in clinical management among medicare beneficiaries with mild cognitive impairment or dementia. Jama. 2019;321(13):1286‐1294. doi: 10.1001/jama.2019.2000 [DOI] [PMC free article] [PubMed] [Google Scholar]
- 27. van Dyck CH, Swanson CJ, Aisen P, et al. Lecanemab in early Alzheimer's disease. N Engl J Med. 2023;388(1):9‐21. doi: 10.1056/NEJMoa2212948 [DOI] [PubMed] [Google Scholar]
- 28. Lilly's Donanemab Significantly Slowed Cognitive and Functional Decline in Phase 3 Study of Early Alzheimer's Disease. 2023. https://investor.lilly.com/news‐releases/news‐release‐details/lillys‐donanemab‐significantly‐slowed‐cognitive‐and‐functional. Accessed May 20, 2023
- 29. McDade E, Cummings JL, Dhadda S, et al. Lecanemab in patients with early Alzheimer's disease: detailed results on biomarker, cognitive, and clinical effects from the randomized and open‐label extension of the phase 2 proof‐of‐concept study. Alzheimers Res Ther. 2022;14(1):191. doi: 10.1186/s13195-022-01124-2 [DOI] [PMC free article] [PubMed] [Google Scholar]
- 30. Schindler SE, Karikari TK, Ashton NJ, et al. Effect of race on prediction of brain amyloidosis by plasma Aβ42/Aβ40, phosphorylated tau, and neurofilament light. Neurology. 2022;99:e245‐e257. doi: 10.1212/WNL.00000000002 [DOI] [PMC free article] [PubMed] [Google Scholar]