

Abstract
Objective
Our aim was to study the evolution of ataxia and neurological symptoms before and after ataxia onset in the most common spinocerebellar ataxias (SCAs), SCA1, SCA2, SCA3 and SCA6. We therefore jointly analysed the data of the EUROSCA and RISCA studies, which recruited ataxic and non‐ataxic mutation carriers.
Methods
We used mixed effect models to analyse the evolution of Scale for the Rating and Assessment of Ataxia (SARA) scores, SCA Functional Index (SCAFI) and Inventory of Non‐Ataxia Signs (INAS) counts. We applied multivariable modelling to identify factors associated with SARA progression. In the time interval 5 years prior to and after ataxia onset, we calculated sensitivity to change ratios (SCS) of SARA, SCAFI and INAS.
Results
2740 visits of 677 participants were analysed. All measures showed non‐linear progression that was best fitted by linear mixed models with linear, quadratic and cubic time effects. R 2 values indicating quality of the fit ranged from 0.70 to 0.97. CAG repeat was associated with faster progression in SCA1, SCA2 and SCA3, but not SCA6. 5 years prior to and after ataxia onset, SARA had the highest SCS of all measures with a mean of 1.21 (95% CI: 1.20, 1.21) in SCA1, 0.94 (0.93, 0.94) in SCA2 and 1.23 (1.22, 1.23) in SCA3.
Interpretation
Our data have important implications for the understanding of disease progression in SCA1, SCA2, SCA3 and SCA6 across the lifespan. Furthermore, our study provides information for the design of interventional trials, especially in pre‐ataxic mutation carriers close to ataxia onset and patients in early disease stages.
Introduction
The spinocerebellar ataxias (SCAs) comprise about 50 autosomal, dominantly inherited diseases. The clinical hallmark of SCAs is progressive ataxia. The most common SCAs—SCA1, SCA2, SCA3 and SCA6—are caused by translated unstable repeat expansion mutations. 1 Ataxia onset in these diseases is preceded by mild clinical manifestations. 2 , 3 In addition, several fluid and imaging biomarker candidates have been identified, which showed alterations before the clinical onset of ataxia. 4 , 5 , 6 , 7
In recent years, considerable progress has been made in the development of targeted therapies aimed at modifying the disease course of SCA1, SCA2, SCA3 and SCA6. These therapies are most likely to be appropriate for mutation carriers close to the onset of ataxia and patients in the early symptomatic stage. 8 In this period around the conversion to ataxia, SCA1, SCA2, SCA3 and SCA6 may already have an impact on the lives of the affected individuals, but irreversible brain damage is not very advanced. 9 , 10
A number of longitudinal cohort studies of SCA1, SCA2, SCA3 and SCA6 patients investigated the progression of ataxia after clinical onset. 11 , 12 , 13 , 14 , 15 , 16 , 17 The largest of them is the EUROSCA study, which enrolled 526 SCA1, SCA2, SCA3 and SCA6 patients, and followed them with a median observation time of 49 months. From the clinical onset, ataxia, as measured by the Scale for the Assessment and Rating of Ataxia (SARA), and accompanying neurological symptoms, as measured by the Inventory of Non‐Ataxia Signs (INAS) continuously worsened with SCA1 showing the fastest progression. 12
Information on the progression of clinical manifestations before ataxia onset is very limited. In the longitudinal RISCA study that enrolled 302 risk persons for SCA1, SCA2, SCA3 and SCA6, SARA scores of SCA1, SCA2 and SCA3 mutation carriers increased from the time of inclusion, whereas they remained stable in non‐carriers. In addition, 13%–52% of the mutation carriers converted to manifest ataxia depending on the genetic subtype. 9 In a study of 38 Brazilian pre‐ataxic SCA3 mutation carriers, SARA scores increased moderately. 11
None of these studies, however, comprehensively considered the entire disease range from the early pre‐ataxia to the late ataxia stage. In particular, progression data around the time of conversion to ataxia are widely lacking. To understand the dynamics of clinical evolution in SCA1, SCA2, SCA3 and SCA6 over the entire disease course including the time of conversion, we combined and jointly analysed the data of the longitudinal RISCA and EUROSCA studies. In these studies, we used the SARA, 18 the SCA Functional Index (SCAFI) 19 and the INAS 20 as clinical outcome assessments (COAs). Our goal was to study and model the evolution of ataxia and neurological symptoms over an extended period before and after ataxia onset, to identify factors that influence progression and to determine and compare the sensitivity to change of these used COAs in the conversion period 5 years prior to and after ataxia onset.
Methods
Participants
We analysed longitudinal data of pre‐ataxic and ataxic SCA1, SCA2, SCA3 and SCA6 mutation carriers from the RISCA 9 and EUROSCA 12 cohorts. The prospective RISCA study enrolled pre‐ataxic children or siblings of patients with SCA1, SCA2, SCA3 or SCA6 at 14 European ataxia referral centres. In the current analysis, only mutation carriers were included. The prospective EUROSCA study enrolled ataxic SCA1, SCA2, SCA3 and SCA6 mutation carriers aged 18 years or older at 17 European ataxia referral centres.
The studies were approved by the ethics committees of the contributing centres. Informed and written consent was obtained from all study participants at inclusion.
Clinical outcome assessments (COAs)
We used SARA to assess the presence and severity of ataxia. 18 In addition to the SARA sum score, which ranges from 0 to 40, with zero indicating absence of ataxia and 40 being the most severe degree of ataxia, we analysed the SARAaxial score, which comprises SARA items 1 to 4. SARAaxial score ranges from 0 to 24. As a performance‐based assessment, we applied SCAFI, which is generated as arithmetic mean of the scores of each of the three subtests after transforming them to Z‐scores of a reference population. 19 Neurological signs other than ataxia were assessed with INAS. 20 INAS is a list comprising 30 items which are grouped into 16 non‐ataxia signs yielding an INAS count ranging between 0 and 16.
Data analysis and modelling
All analyses were performed using the R Software for Statistical Computing, version 4.2.1. 21
Analyses were done separately for each genetic subtype. Patient characteristics at baseline are given as median and interquartile range (IQR). Time from ataxia onset was calculated by subtracting the age at ataxia onset in years from the present age. In pre‐ataxic mutation carriers, this calculation yields negative values corresponding to the time to ataxia onset. According to the disease status, the determination of the age at ataxia onset was done differently. In ataxic patients from the EUROSCA cohort, we used the age at onset, as reported by the participant. Ataxia onset was defined by the onset of gait difficulties. 22 In pre‐ataxic mutation carriers of the RISCA cohort who converted to manifest ataxia defined by SARA ≥3, we computed the age at ataxia onset as the mean of the two values at the visits before and after conversion. 9 In RISCA participants, who did not convert during the observational period, age at ataxia onset was estimated by a parametric survival model that included the current age with the repeat length of the expanded allele as a fixed effect. 23
We applied locally weighted scatterplot smoothing (LOESS) to show temporal evolution of COAs on a time scale defined by ataxia onset. For modelling, we used mixed effect models (R package lmerTest) 24 with random effects on intercept to analyse evolution of SARA, SARAaxial, SCAFI and INAS as dependent variable and time from ataxia onset in years as independent variable. We tested for linear, quadratic and cubic effects on disease progression to choose the model that best fitted the data via backward selection and comparison of Akaike information criterion (AIC) and Bayesian information criterion (BIC). Estimates derived from the model are given as means with a 95% confidence interval (95% CI), standard error, p‐value and marginal and conditional R 2. Due to the small numbers of visits at the extremes of time scale, analyses were restricted to an interval from 20 before to 25 years after ataxia onset.
To identify factors that affect disease progression measured by SARA, the effect of sex, CAG repeat length of normal allele and CAG repeat length of expanded allele on the progression rates were tested via interactions between the given variable and the time variables in a multivariable model for each SCA subtype. Estimates derived from the model are given as means with 95% CI and marginal and conditional R 2.
Sensitivity to change of SARA, SARAaxial, SCAFI and INAS was assessed by calculating sensitivity to change ratio (SCS). To this end, progression was modelled in a time interval 5 years before and after ataxia onset with a linear mixed model with patient‐specific random intercept and the linear term of time from onset as time variable. Linearity of the progression rate in this time interval was tested with the Rainbow test (R package lmtest) and visual inspection of data. SCS was calculated by dividing the mean slope of progression by the standard deviation of the slope with 95% CI. 95% CIs were determined by model‐based (semi‐) parametric bootstrap for mixed effect models with 10,000 runs (R package lme4). 25 Higher SCS values indicate greater sensitivity of change of the respective clinical outcome measure.
Deidentified patient data are available via the CPTA: https://c‐path.org/programs/cpta/.
Role of the funding source
This study was funded within the framework of the ERA‐Net for Research Programmes on Rare Diseases (RISCA) and EU FP6 (EUROSCA). Additional funds came from the German Ministry of Education and Research (GeneMove), Polish Ministry of Scientific Research and Information Technology, Italian Ministry of Health (Grant RF‐2011‐02347420) and from the European Community's Seventh Framework Programme (FP7/2007‐2013) under grant agreement no. 2012‐305121 “Integrated European—omics research project for diagnosis and therapy in rare neuromuscular and neurodegenerative diseases (NEUROMICS)”. T. Klockgether is a member of the European Reference Network for Rare Neurological Diseases (ERN‐RD, project number 739510).
The sponsors had no role in the study design, data collection, data analysis, data interpretation or writing of the report. The corresponding author had full access to all the data in the study and had final responsibility for the decision to submit for publication.
This study is registered with ClinicalTrials.gov, numbers NCT02440763 and NCT01037777.
Results
Data from 2740 visits of 677 participants, 525 from the EUROSCA and 152 from the RISCA study were analysed. The study population included 173 SCA1 mutation carriers, 207 SCA2 mutation carriers, 172 SCA3 mutation carriers and 125 SCA6 mutation carriers. Participants had a median of 3.0 (IQR = 2.0–4.0) visits and a median observation time of 2.0 years (IQR = 0.9–3.9). Demographic and clinical characteristics of all participants are given in Table 1.
Table 1.
Demographic and clinical characteristics of participants at baseline.
| Variable | SCA 1 | SCA 2 | SCA 3 | SCA 6 |
|---|---|---|---|---|
| Number of participants | 173 | 207 | 172 | 125 |
| Age (years) | 40.0 [31.0, 50.0] | 43.0 [31.0, 52.0] | 45.0 [38.0, 53.3] | 65.0 [51.0, 72.0] |
| Normal allele | 30.0 [29.0, 31.0] | 22.0 [22.0, 22.0] | 22.0 [20.0, 23.0] | 12.0 [12.0, 13.0] |
| Expanded allele | 47.0 [44.0, 50.0] | 38.5 [37.0, 41.0] | 69.0 [66.0, 71.0] | 22.0 [22.0, 22.0] |
| SARA | 9.0 [1.5, 16.0] | 12.0 [5.8, 17.8] | 11.5 [4.0, 18.6] | 13.0 [8.5, 18.0] |
| SARA axial | 5.0 [1.0, 9.0] | 6.00 [2.0, 10.0] | 6.00 [2.8, 12.0] | 7.0 [4.0, 11.0] |
| SCAFI | 0.2 [−0.5, 0.7] | −0.1 [−0.6, 0.6] | 0.4 [−0.2, 1.0] | −0.1 [−0.7, 0.4] |
| INAS | 3.0 [1.0, 5.0] | 3.0 [1.5, 5.0] | 4.0 [2.0, 6.0] | 2.0 [1.0, 3.0] |
Data are given as n (%), or median (IQR).
INAS, Inventory of Non‐Ataxia Signs; SARA, Scale for the Assessment and Rating of Ataxia; SCA, spinocerebellar ataxia; SCAFI, SCA Functional Index.
To study the temporal evolution of COAs, we plotted individual trajectories (Fig. 1) and applied LOESS as a function of the time from ataxia onset (Fig. 2). In SCA1, SCA2 and SCA3, SARA, SARAaxial, SCAFI and INAS evolution had a sigmoidal shape with incipient deterioration from 10 to 15 years before ataxia onset followed by an almost linear course around the time of ataxia onset, and subsequent slowing from about 10 years after ataxia onset. Exceptions from this general pattern were SARA and SARAaxial in SCA1 which further increased linearly until the end of the observation period. The disease course of SCA6 differed from SCA1, SCA2 and SCA3, in that SARA, SARAaxial and SCAFI reached a plateau from about 20 years after ataxia onset. Further, INAS in SCA6 deteriorated more slowly than in SCA1, SCA2 and SCA3, and the course was almost linear.
Figure 1.

Individual trajectories of SARA evolution in SCA1, SCA2, SCA3 and SCA6. INAS, Inventory of Non‐Ataxia Signs; SARA, Scale for the Assessment and Rating of Ataxia; SCA, spinocerebellar ataxia; SCAFI, SCA Functional Index.
Figure 2.

Loess plots of progression of COAs for each SCA type. SCA, spinocerebellar ataxia; SARA, Scale for the Assessment and Rating of Ataxia; SCAFI, SCA Functional Index; INAS, Inventory of Non‐Ataxia Signs.
To estimate the onset of deterioration in the pre‐ataxia stage, we calculated the time, at which SARA, SARAaxial and INAS scores crossed the thresholds of 1 and 2. The time points for SARA = 1 were −7,0 years (SCA1), −9,2 years (SCA2), −8,8 years (SCA3) and −14,3 years (SCA6). The respective values for SARA = 2 were −5,2 years (SCA1), −7,0 years (SCA2), −6,5 years (SCA3) and −11,5 years (SCA6). The time points for SARAaxial = 1 were −5,3 years (SCA1), −6,4 years (SCA2), −5,9 years (SCA3) and −10,4 years (SCA6), for SARAaxial = 2–3,0 years (SCA1), −3,6 years (SCA2), −3,0 years (SCA3) and −6,7 years (SCA6) and for INAS = 1–8,9 years (SCA1), −8,0 years (SCA2), −7,6 years (SCA3) and −2,3 years (SCA6), for INAS = 2–3,5 years (SCA1), −1,8 years (SCA2), −2,1 years (SCA3) and 8,5 years (SCA6).
Over the entire observation period, progression of SARA, SARAaxial and INAS was fastest in SCA1 followed by SCA2 and SCA3 in which curves showed large overlap, and SCA6 which had the slowest progression. SARA and SARAaxial progression curves of SCA1 started to diverge from those of the other subtypes from about 5 years after ataxia onset, whereas progression curves overlapped before this time. SCAFI curves of SCA1, SCA2, SCA3 and SCA6 were almost parallel until 10 years after ataxia onset, but SCA3 mutation carriers performed better over almost the entire observation period.
We used AIC and BIC model selection to distinguish among a set of possible mixed effect models describing the relationship between a linear, quadratic or cubic time effect and all three time effects combined and the particular COAs. For each of the SCAs, the best‐fit model for the evolution of SARA, SARAaxial, SCAFI and INAS included the combined linear, quadratic and cubic time effects (Fig. 3). R 2 values indicating the quality of the fit ranged between 0.90 and 0.97 for SARA, SARAaxial, and SCAFI, and 0.70 and 0.82 for INAS. The parameters of the models are given in the appendix (Appendix Table S1).
Figure 3.

Progression of COAs by linear mixed models for each SCA type. INAS, Inventory of Non‐Ataxia Signs; SARA, Scale for the Assessment and Rating of Ataxia; SCA, spinocerebellar ataxia; SCAFI, SCA Functional Index.
To identify factors that were associated with the progression of the SARA score, we applied multivariable modelling. CAG repeat length of the expanded allele was associated with faster progression in SCA1, SCA2 and SCA3, but not SCA6. In SCA1 and SCA3, the effect of the CAG repeat length of the expanded allele on SARA progression became evident only about 5 years after ataxia onset, in SCA2 with ataxia onset (Fig. 4). We did not find an association of sex and CAG repeat length of the shorter allele with progression in any SCA subtype (Appendix Table S2).
Figure 4.
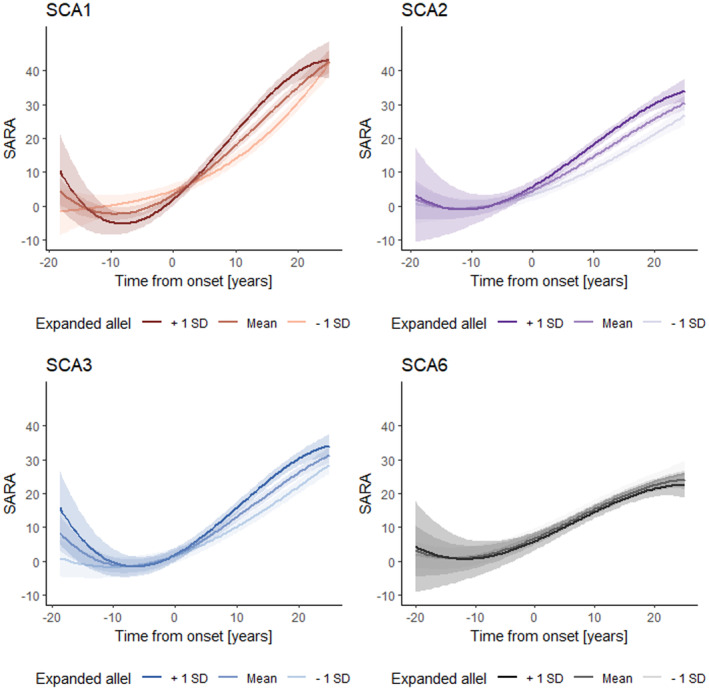
Effect of the expanded allele on SARA progression in SCA1, SCA2, SCA3 and SCA6. SARA, Scale for the Assessment and Rating of Ataxia; SCA, spinocerebellar ataxia.
As confirmed by the Rainbow test, the progression of all COAs was linear in SCA1, SCA2, SCA3 and SCA6 during a time interval 5 years prior to and after ataxia onset. In this time interval, we assessed the sensitivity to change of SARA, SARAaxial, SCAFI and INAS by calculating SCS. In SCA1, SCA2 and SCA3, SARA had the highest SCS of all COAs with a mean of 1.21 (95% CI: 1.20, 1.21) in SCA1, 0.94 (0.93, 0.94) in SCA2 and 1.23 (1.22, 1.23) in SCA3 followed by SARAaxial. In SCA6, the SCS of SARAaxial was higher than that of SARA. In the other subtypes, SARAaxial had the second‐highest SCS of all COAs. In all SCA subtypes, SCAFI had the third highest and INAS the lowest SCS. SCS of SARA was highest in SCA3 followed by SCA1, SCA2 and SCA6, whereas the rank order for SARAaxial was SCA1, SCA3, SCA2 and SCA6. The rank order for SCAFI and INAS was SCA1, SCA2, SCA3 and SCA6 (Table 2, Appendix Table S3).
Table 2.
Sensitivity to change ratios (SCSs) of clinical outcome assessments (COAs) in the time interval 5 years prior to and after ataxia onset.
| Mean | 95% CI | |
|---|---|---|
| SARA | ||
| SCA1 | 1.21 | [1.20, 1.21] |
| SCA2 | 0.94 | [0.93, 0.94] |
| SCA3 | 1.23 | [1.22, 1.23] |
| SCA6 | 0.35 | [0.35, 0.35] |
| SARAaxial | ||
| SCA1 | 1.09 | [1.09, 1.09] |
| SCA2 | 0.89 | [0.89, 0.89] |
| SCA3 | 0.92 | [0.92, 0.92] |
| SCA6 | 0.38 | [0.37, 0.38] |
| SCAFI | ||
| SCA1 | −0.84 | [−0.85, −0.84] |
| SCA2 | −0.84 | [−0.84, −0.83] |
| SCA3 | −0.83 | [−0.83, −0.82] |
| SCA6 | −0.27 | [−0.28, −0.27] |
| INAS | ||
| SCA1 | 0.71 | [0.71, 0.71] |
| SCA2 | 0.51 | [0.51, 0.51] |
| SCA3 | 0.51 | [0.51, 0.51] |
| SCA6 | −0.14 | [−0.14, −0.14] |
INAS, Inventory of Non‐Ataxia Signs; SARA, Scale for the Assessment and Rating of Ataxia; SCA, spinocerebellar ataxia; SCAFI, SCA Functional Index.
Discussion
This study provides quantitative data for the disease progression of SCA1, SCA2, SCA3 and SCA6 over a time period from 20 years before until 25 years after ataxia onset. The study is based on longitudinal findings from pre‐ataxic mutation carriers from the RISCA cohort and patients from the EUROSCA cohort. The assessment protocols of RISCA and EUROSCA had a considerable overlap and were identical with respect to the COAs analysed in this study. In addition, 11 of 20 recruiting centres participated in both RISCA and EUROSCA. It was therefore justified to merge the data of both cohorts. This made it possible for the first time to analyse and model disease progression of SCA1, SCA2, SCA3 and SCA6 across the time of ataxia onset. A limitation of this study is the restriction to measures of ataxia and neurological signs without consideration of cognitive function and biomarkers. In addition, the study was performed only in European individuals and may not be representative of SCA mutation carriers coming from other world regions.
Whereas previous studies in SCA1, SCA2, SCA3 and SCA6 patients showed a linear progression of the severity of ataxia and neurological symptoms, the entire disease course encompassing the pre‐ataxic and ataxic stage was non‐linear and best fitted by linear mixed models with linear, quadratic and cubic time effects. This applied equally to all SCA subtypes under study. The models explained a large part of the observed variability with R 2 values exceeding 0.91 for SARA underlining the quality of the modelling. Quality of the modelling is also demonstrated between the great similarity of the local regression curves and the calculated models.
SARA, SARAaxial and SCAFI, which are measures of ataxia severity, indicated incipient clinical deterioration approximately 10–15 years before ataxia onset followed by a linear phase around ataxia onset and subsequent flattening depending on the respective COA and genetic subtype. A plateau effect was not observed for these COAs in SCA1, SCA2 and SCA3 indicating that they are sensitive over a wide range of disease severity in these subtypes. The progression of INAS, which is a rough measure of non‐ataxia involvement, was different. The increase in SCA6 was smaller compared to SCA1, SCA2 and SCA3 indicating the paucity of extracerebellar degeneration in SCA6. In addition, INAS reached a plateau in SCA1, SCA2 and SCA3 about 20 years after ataxia onset.
Our analysis that covered a large part of the lifespan of SCA1, SCA2, SCA3 and SCA6 mutation carriers confirmed previous findings that progression was fastest in SCA1 followed by SCA2 and SCA3, which took a similar course, and SCA6, which had the slowest progression. 12 However, the differences between the SCA subtypes were most evident in later disease stages, whereas there was considerable overlap of the disease course in the pre‐ataxia stage and in the first 5 years after ataxia onset.
The CAG repeat length of the expanded allele was associated with a faster SARA progression in SCA1, SCA2 and SCA3, whereas there was no significant association between sex and the CAG repeat length of the normal allele in any subtype. While previous studies looking for factors determining disease progression were confined to patients, our study encompassed an extended time period from 20 years before until 25 years after ataxia onset. Our data show that the effect of the CAG repeat length of the expanded allele becomes evident only about 5 years after ataxia onset in SCA1 and SCA3, and with ataxia onset in SCA2.
In our further analysis, we focussed on a time period that began 5 years before and extended to 5 years after onset. This time period was chosen pragmatically, as all COAs indicated linear deterioration, and pre‐ataxic mutation carriers close to ataxia onset and patients in an early disease stage are likely responders to targeted therapies aimed at modifying the disease course. 8 Future delineation of specific pre‐ataxia stages needs to consider biomarker and mild functional changes occurring before the clinical onset of ataxia. 26 , 27 However, the present data were not sufficient to define such stages. However, they allowed to estimate at which time SCA mutation carriers cross the threshold of low COA scores, such as SARA = 1, which are still in the normal range. The apparently earlier deterioration of SCA6 mutation carriers, who were 20 to 25 years older than SCA1, SCA2 and SCA3 mutation carriers, is most likely an artefact due to age‐related higher SARA scores. 28
The rationale for focusing on this time period is that initiation of therapies at this time will precede irreversible brain damage occurring in the later disease course. Accordingly, a recently established trial‐ready cohort for SCA1 and SCA3 specifically enrolled pre‐ataxic mutation carriers and mildly affected patients. 29 The principal feasibility of performing trials in presymptomatic carriers of gene mutations associated with neurodegenerative diseases is corroborated by recent trials in dominantly inherited Alzheimer's disease 30 and SOD1‐associated amyotrophic lateral sclerosis. 31
We strongly believe that a preventive rather than a therapeutic approach for SCA mutation carriers is not only ethically justified, but imperative, as the benefit of prevention is expected to be greater than that of therapy. However, prevention is associated with specific challenges related to the risk of stigmatisation of mutation carriers and exposure of apparently healthy individuals to risks of the intervention.
In the time interval 5 years prior to and after ataxia onset, all COAs had considerably lower sensitivity to change in SCA6 compared to SCA1, SCA2 and SCA3. In the latter three SCA subtypes, SARA had the highest sensitivity followed by SARAaxial, SCAFI and INAS. We included SARAaxial, which comprises only SARA items 1–4 related to gait, stance, sitting and speech, while items 5–8 related to arm and leg coordination are omitted. The reasons to include SARAaxial were findings in SCA3 patients showing that SARA progression was mainly driven by items 1–4, with a markedly smaller contribution of items 5–8. Due to a similar rationale, an ongoing interventional trial in SCAs is using a modified SARA version comprising four items related to gait, stance, sitting and speech (NCT03701399). In our analysis of the time interval 5 years prior to and after ataxia onset, SARA had higher sensitivity than SARAaxial showing that the items related to arm and leg function contribute to clinical progression in this period. Accordingly, truncated versions of SARA are not likely to reduce the required number of participants in trials enrolling mutation carriers in late pre‐ataxic and early ataxic disease stages.
Other than SARA, SARAaxial and INAS which represent clinician‐reported outcomes, SCAFI is a performance outcome based on a timed walking, speech and coordination test. The present data confirm previous findings in SCA patients 32 , 33 that SCAFI is less sensitive than SARA to detect worsening of ataxia. Accordingly, SCAFI has limited usefulness as an outcome in clinical trials.
Our data have important implications for the understanding of the biological characteristics of disease progression in SCA1, SCA2, SCA3 and SCA6 across the lifespan. Furthermore, our study provides useful information for the design of interventional trials in these disorders, in particular of trials that test interventions aimed at modifying the disease course in pre‐ataxic mutation carriers close to ataxia onset and patients in an early disease stage.
Author Contributions
Heike Jacobi contributed to the conception and design of the study (1), acquisition and analysis of data (2) and drafted a significant portion of the manuscript (3). Tamara Schaprian contributed to the conception and design of the study (1) and did the statistical analysis, tables and figures (3). Tanja Schmitz‐Hübsch contributed to the conception and design of the study (1) and acquisition and analysis of data (2). Matthias Schmid contributed to the conception and design of the study (1) and did a significant part of the statistical analysis, tables and figures (3). Thomas Klockgether conceived and designed the study (1), contributed to the acquisition and analysis of data (2) and drafted a significant portion of the manuscript (3). EUROSCA and RISCA study groups: Aquisition and analysis of data. Members of the EUROSCA and RISCA study groups are listed with affiliations in the Appendix.
Conflict of Interest Statement
None of the authors reports conflicts of interest regarding this manuscript.
Supporting information
Appendix Table 1.
Acknowledgements
Several contributors to this publication are members of the European Reference Network for Rare Neurological Diseases—Project ID No 739510. We thank all individuals for participating in the study.
References
- 1. Klockgether T, Mariotti C, Paulson HL. Spinocerebellar ataxia. Nat Rev Dis Primers. 2019;5(1):24. doi: 10.1038/s41572-019-0074-3 [DOI] [PubMed] [Google Scholar]
- 2. Jacobi H, Reetz K, du Montcel ST, et al. Biological and clinical characteristics of individuals at risk for spinocerebellar ataxia types 1, 2, 3, and 6 in the longitudinal RISCA study: analysis of baseline data. Lancet Neurol. 2013;12(7):650‐658. [DOI] [PubMed] [Google Scholar]
- 3. Velazquez‐Perez L, Rodriguez‐Labrada R, Canales‐Ochoa N, et al. Progression of early features of spinocerebellar ataxia type 2 in individuals at risk: a longitudinal study. Lancet Neurol. 2014;13:482‐489. [DOI] [PubMed] [Google Scholar]
- 4. Rezende TJR, de Paiva JLR, Martinez ARM, et al. Structural signature of SCA3: from presymptomatic to late disease stages. Ann Neurol. 2018;84:401‐408. [DOI] [PubMed] [Google Scholar]
- 5. Prudencio M, Garcia‐Moreno H, Jansen‐West KR, et al. Toward allele‐specific targeting therapy and pharmacodynamic marker for spinocerebellar ataxia type 3. Sci Transl Med. 2020;12:eabb7086. [DOI] [PMC free article] [PubMed] [Google Scholar]
- 6. Wilke C, Haas E, Reetz K, et al. Neurofilaments in spinocerebellar ataxia type 3: blood biomarkers at the preataxic and ataxic stage in humans and mice. EMBO Mol Med. 2020;12:e11803. [DOI] [PMC free article] [PubMed] [Google Scholar]
- 7. Faber J, Schaprian T, Berkan K, et al. Regional brain and spinal cord volume loss in spinocerebellar ataxia type 3. Mov Disord. 2021;36:2273‐2281. [DOI] [PMC free article] [PubMed] [Google Scholar]
- 8. Ashizawa T, Oz G, Paulson HL. Spinocerebellar ataxias: prospects and challenges for therapy development. Nat Rev Neurol. 2018;14:590‐605. [DOI] [PMC free article] [PubMed] [Google Scholar]
- 9. Jacobi H, du Montcel ST, Romanzetti S, et al. Conversion of individuals at risk for spinocerebellar ataxia types 1, 2, 3, and 6 to manifest ataxia (RISCA): a longitudinal cohort study. Lancet Neurol. 2020;19(9):738‐747. [DOI] [PubMed] [Google Scholar]
- 10. Bolzan G, Leotti VB, de Oliveira CM, et al. Quality of life since pre‐ataxic phases of spinocerebellar ataxia type 3/Machado‐Joseph disease. Cerebellum. 2022;21(2):297‐305. [DOI] [PubMed] [Google Scholar]
- 11. de Oliveira CM, Leotti VB, Cappelli AH, et al. Progression of clinical and eye movement markers in Preataxic carriers of Machado‐Joseph disease. Mov Disord. 2023;38(1):26‐34. [DOI] [PubMed] [Google Scholar]
- 12. Jacobi H, du Montcel ST, Bauer P, et al. Long‐term disease progression in spinocerebellar ataxia types 1, 2, 3, and 6: a longitudinal cohort study. Lancet Neurol. 2015;14(11):1101‐1108. [DOI] [PubMed] [Google Scholar]
- 13. Ashizawa T, Figueroa KP, Perlman SL, et al. Clinical characteristics of patients with spinocerebellar ataxias 1, 2, 3 and 6 in the US; a prospective observational study. Orphanet J Rare Dis. 2013;8:177. [DOI] [PMC free article] [PubMed] [Google Scholar]
- 14. Lee YC, Liao YC, Wang PS, Lee IH, Lin KP, Soong BW. Comparison of cerebellar ataxias: a three‐year prospective longitudinal assessment. Mov Disord. 2011;26:2081‐2087. [DOI] [PubMed] [Google Scholar]
- 15. Yasui K, Yabe I, Yoshida K, et al. A 3‐year cohort study of the natural history of spinocerebellar ataxia type 6 in Japan. Orphanet J Rare Dis. 2014;9:118. [DOI] [PMC free article] [PubMed] [Google Scholar]
- 16. França MC Jr, D'Abreu A, Nucci A, Cendes F, Lopes‐Cendes I. Progression of ataxia in patients with Machado‐Joseph disease. Mov Disord. 2009;24:1387‐1390. [DOI] [PubMed] [Google Scholar]
- 17. Jardim LB, Hauser L, Kieling C, et al. Progression rate of neurological deficits in a 10‐year cohort of SCA3 patients. Cerebellum. 2010;9:419‐428. [DOI] [PubMed] [Google Scholar]
- 18. Schmitz‐Hubsch T, du Montcel ST, Baliko L, et al. Scale for the assessment and rating of ataxia: development of a new clinical scale. Neurology. 2006;66(11):1717‐1720. [DOI] [PubMed] [Google Scholar]
- 19. Schmitz‐Hübsch T, Giunti P, Stephenson DA, et al. SCA functional index: a useful compound performance measure for spinocerebellar ataxia. Neurology. 2008;71:486‐492. [DOI] [PubMed] [Google Scholar]
- 20. Jacobi H, Rakowicz M, Rola R, et al. Inventory of non‐ataxia signs (INAS): validation of a new clinical assessment instrument. Cerebellum. 2013;12(3):418‐428. [DOI] [PubMed] [Google Scholar]
- 21. R Core Team . R: A Language and Environment for Statistical Computing. R Foundation for Statistical Computing; 2022. https://www.R‐project.org/ (download 30 of June 2022). [Google Scholar]
- 22. Klockgether T, Lüdtke R, Kramer B, et al. The natural history of degenerative ataxia: a retrospective study in 466 patients. Brain. 1998;121(Pt 4):589‐600. [DOI] [PubMed] [Google Scholar]
- 23. Tezenas du Montcel S, Durr A, Rakowicz M, et al. Prediction of the age at onset in spinocerebellar ataxia type 1, 2, 3 and 6. J Med Genet. 2014;51:479‐486. [DOI] [PMC free article] [PubMed] [Google Scholar]
- 24. Kuznetsova A, Brockhoff PB, Christensen RHB. lmerTest package: tests in linear mixed effects models. Journal of Statistical Software. 2017;82(13):1‐26. doi: 10.18637/jss.v082.i13 (download 12 of July 2022). [DOI] [Google Scholar]
- 25. Bates D, Maechler M, Bolker B, Walker S. Fitting linear mixed‐effects models using lme4. J Stat Softw. 2015;67(1):1‐48. doi: 10.18637/jss.v067.i01 (download 12 of July 2022). [DOI] [Google Scholar]
- 26. Faber J, Berger M, Carlo W, et al. Stage‐dependent biomarker changes in spinocerebellar ataxia type 3. medRxiv [Preprint]. 2023; 2023.04.21.23287817. [Google Scholar]
- 27. Tabrizi SJ, Estevez‐Fraga C, van Roon‐Mom WMC, et al. Potential disease‐modifying therapies for Huntington's disease: lessons learned and future opportunities. Lancet Neurol. 2022;21(7):645‐658. [DOI] [PMC free article] [PubMed] [Google Scholar]
- 28. Grobe‐Einsler M, Schmidt A, Schaprian T, Vogt IR, Klockgether T. Scale for the assessment and rating of ataxia: age‐dependent performance of healthy adults. Eur J Neurol. 2023;30(2):548‐551. [DOI] [PubMed] [Google Scholar]
- 29. Lin CC, Ashizawa T, Kuo SH. Collaborative efforts for spinocerebellar ataxia research in the United States: CRC‐SCA and READISCA. Front Neurol. 2020;11:902. [DOI] [PMC free article] [PubMed] [Google Scholar]
- 30. Salloway S, Farlow M, McDade E, et al. A trial of gantenerumab or solanezumab in dominantly inherited Alzheimer's disease. Nat Med. 2021;27(7):1187‐1196. [DOI] [PMC free article] [PubMed] [Google Scholar]
- 31. Benatar M, Wuu J, Andersen PM, et al. Design of a Randomized, placebo‐controlled, phase 3 trial of Tofersen initiated in clinically Presymptomatic SOD1 variant carriers: the ATLAS study. Neurotherapeutics. 2022;19(4):1248‐1258. [DOI] [PMC free article] [PubMed] [Google Scholar]
- 32. Schmitz‐Hübsch T, Fimmers R, Rakowicz M, et al. Responsiveness of different rating instruments in spinocerebellar ataxia patients. Neurology. 2010;74(8):678‐684. [DOI] [PubMed] [Google Scholar]
- 33. Tezenas du MS, Charles P, Goizet C, et al. Factors influencing disease progression in autosomal dominant cerebellar ataxia and spastic paraplegia. Arch Neurol. 2012;69(4):500‐508. [DOI] [PubMed] [Google Scholar]
Associated Data
This section collects any data citations, data availability statements, or supplementary materials included in this article.
Supplementary Materials
Appendix Table 1.