

Summary
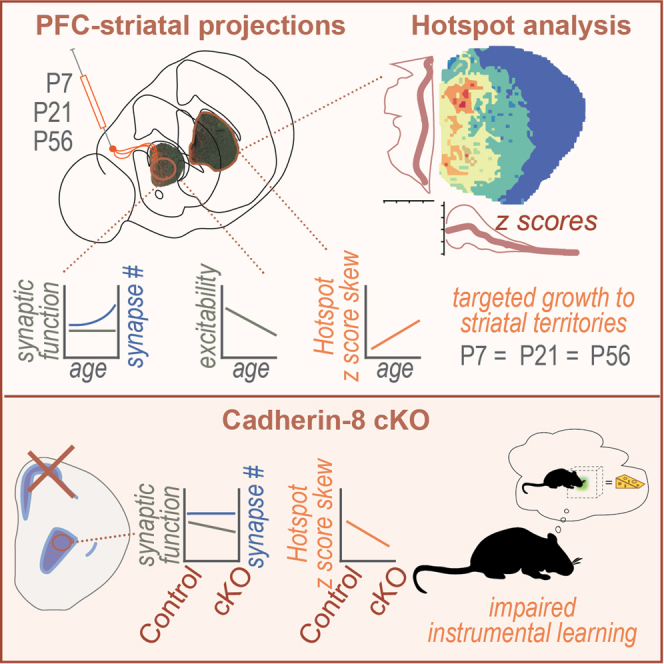
Action-outcome associations depend on prefrontal cortex (PFC) projections to the dorsal striatum. To assess how these projections form, we measured PFC axon patterning, synapse formation, and functional maturation in the postnatally developing mouse striatum. Using Hotspot analysis, we show that PFC axons form an adult-like pattern of clustered terminations in the first postnatal week that remains largely stable thereafter. PFC-striatal synaptic strength is adult-like by P21, while excitatory synapse density increases until adulthood. We then tested how the targeted deletion of a candidate adhesion/guidance protein, Cadherin-8 (Cdh8), from corticostriatal neurons regulates pathway development. Mutant mice showed diminished PFC axon targeting and reduced spontaneous glutamatergic synaptic activity in the dorsal striatum. They also exhibited impaired behavioral performance in action-outcome learning. The data show that PFC-striatal axons form striatal territories through an early, directed growth model and they highlight essential contributions of Cdh8 to the anatomical and functional features critical for the formation of action-outcome associations.
Subject areas: Neuroscience, Behavioral neuroscience, Developmental neuroscience, Cellular neuroscience
Graphical abstract
Highlights
-
•
Pattern of PFC-striatal innervation follows a directed growth model of development
-
•
Corticostriatal synaptogenesis continues over an extended time course
-
•
Presynaptic Cdh8 limits the extent of PFC axon growth in the striatum
-
•
Rpb4-Cre mediated Cdh8 deletion impairs striatal-dependent action-outcome learning
Neuroscience; Behavioral neuroscience; Developmental neuroscience; Cellular neuroscience
Introduction
Pyramidal neurons in the mature prefrontal cortex (PFC) project to spiny projection neurons (SPNs) in the dorsomedial striatum as part of a highly adaptive, recurrent circuit required for reinforcement learning and motivated behaviors.1,2 Consistent with this role, altered corticostriatal connectivity is a key contributor to pathological symptoms observed in a wide range of human disorders and diseases ranging from schizophrenia and autism to Huntington’s and Parkinson’s.3,4,5 Few studies, however, have examined how this pathway develops, and the absence of this knowledge makes it difficult to distinguish normal from pathological innervation patterns, to quantify the impact of molecular factors hypothesized to regulate its development, or to measure the effects of strategies designed to ameliorate developmentally seeded pathologies.
The entire neocortex projects to the dorsal striatum. Deep-layer neurons within each cortical region send axonal projections that terminate in circumscribed striatal domains or territories. These territories follow a basic topographic pattern and are part of multiple, parallel loops running from cortex to basal ganglia to thalamus and back.6 Adding complexity, striatal neurons integrate inputs from functionally interconnected, but discrete cortical regions, blurring topographic order within the striatum.7,8 Detailed corticostriatal projection maps have been generated from large-scale studies conducted in adult animals.8,9,10 Far less is known about how particular cortico-striatal axon terminal patterns emerge during development or the molecular cues that guide and restrict them.
Here, we asked how prefrontal cortical axons are targeted to their striatal terminal domains during development, examined when they form synapses, and confirmed the time course of their functional maturation. We then tested the impact of Cadherin-8 (Cdh8) on these processes. Cdh8 is a recognition and adhesion molecule that has been hypothesized to contribute to the targeting of PFC to striatal connections.11,12,13,14 To assay the generation of axon terminal territories having poorly defined borders in a structure that is increasing in size over time, we also developed a tool based on Hotspot Analysis.15 This tool can be used to compare patterns between mice and across time in a qualitative and quantitative manner. The data support a directed growth model where PFC axons are targeted correctly to medial striatal territories from the earliest developmental stages examined. PFC axons elaborate locally, generate synapses, and do not undergo an early period of overgrowth followed by pruning. In the absence of cortical Cdh8, PFC-striatal territories become less clustered, synapse function declines and mice fail to acquire an instrumental learning task. This suggests that processing in recurrent cortico-striatal loops is disrupted by the absence of Cdh8 from corticostriatal projection neurons.
Results
Developing prefrontal cortex corticostriatal axon innervation follows a directed growth model
Corticostriatal projection neurons are generated embryonically between E12.5 and E16.5, and striatal neurons between E12.5 and P2,16,17,18,19 but corticostriatal axons wait until after birth (P3 - P4) to invade the striatum.20 To characterize the emergence of PFC terminal axon territories in the striatum, we placed injections of anterograde tracer AAV1-hSyn-TurboRFP into the PFC of mice (Figures 1A and 1B) at P0, P14, and P49, and analyzed projections to the ipsilateral dorsal striatum seven days later (at P7, P21 and P56; Figures 1A–1F). Injections were targeted to medial areas of the PFC, including infralimbic (IL), prelimbic (PL), and dorsal anterior cingulate cortex (ACC) based on functional characterizations of these regions in regulating goal-directed behaviors (Figure 1B).21,22
Figure 1.

PFC corticostriatal terminal axon extension into the dorsal striatum
(A) Experiment overview (generated using BioRender).
(B–I) (B) Tiled, confocal image of DAPI stained section (white) showing injection site (red) in P56 brain adjacent to image from Allen Brain Atlas showing the region we defined as PFC (ACC + PL + IL, blue line). Examples of the PFC axon terminal field (red) in the dorsal striatum at P56 captured at low magnification using confocal (C) and at high magnification on a widefield microscope with the Spaceballs circular probe (D) labeling appears in black). Tiled confocal images from P7 brain showing PFC labeled axons (red) in rostral (E) and caudal (F) striatum. Scatterplot/bar graph (G) of PFC volume over time evaluated using Cavalieri estimator (ANOVA; p < 0.0028; Tukey’s ∗∗p = 0.0011). Similar graph (H) tracks striatal volume assessed with planimetry (ANOVA; p < 0.0001; Tukey’s: ∗p = 0.132; ∗∗p = 0.0012; ∗∗∗p < 0.0001). Total axon length (I) in the dorsal striatum normalized to size of PFC injection (ANOVA p = 0.0025, Tukey’s: ∗∗P7 vs. P56 = 0.0025; ∗P21 vs. P56 = 0.0122). Magnification in F is the same as in E.
At P7, axon density in the striatum was greatest rostrally, but labeled axons extended the full rostro-caudal extent of the striatum (Figures 1E and 1F). To capture the extent of axon innervation in relation to the growing striatum, we first measured axon length within the volume of the striatum. We used the Cavalieri estimator (an unbiased method used to estimate volumes) to measure volumes of PFC, striatum, and turbo-RFP-labeled cells in the injection sites. A systematically applied, stereological "Spaceballs" probe23 (Figures 1C and 1D) was used to estimate the total axon length within the dorsal striatum excluding bundled internal capsule fibers. The data show that PFC growth was complete by P21 (Figure 1G), consistent with data in rats,24 while the striatum continued to grow past the third postnatal week (Figure 1H). Axon length was normalized to injection site volume and advanced primarily between P21 and P56 (Figure 1I). Together, these data show that PFC corticostriatal axons are present throughout the rostral-caudal extent of the dorsal striatum as early as P7 and continue to elaborate their terminal length contemporaneously with the increasing volume of the striatum.
In mature mice, PFC axon projections to the striatum cluster medially.9,10 We next asked whether this pattern results from overgrowth-and-pruning or directed growth. To visualize and quantify the topographic distribution of PFC axons within the dorsal striatum and to compare the establishment of adult-like territorial patterns across animals and ages, we generated a Python-based clustering algorithm grounded in Hotspot Analysis (Figure 2; Figure S1). We used this approach to identify significantly clustered, spatially discrete data.15 As applied here, this statistical method’s null hypothesis was that PFC corticostriatal-projecting axons are evenly distributed across the dorsal striatum. Following a PFC injection, the average intensity of each neighborhood of pixels in the striatum was compared to the null hypothesis and considered a statistical hotspot if the comparison yielded a high Gi statistic associated with a high z score, and a statistical cold spot if the comparison yielded a low Gi statistic associated with a low z score.
Figure 2.

Hotspot analysis for comparing PFC axon territories
(A–E) Tiled confocal images of sections through adult mouse brain showing injection sites for AAV-turboRFP in PFC (A) and AAV-EGFP in S1 stained with DAPI (white) (Magnification for both images is the same). Tiled confocal image (B) through the rostral striatum showing fine, axon arbors (red) as well as axon fascicles. Same image (C) with axons displayed in white, fascicles eliminated by thresholding (black) and z score map from Hotspot analysis. Warmer colors have higher z scores. Images through the rostral (D) and caudal (E) striatum showing terminal labeling patterns for PFC and S1 axons. Approximate rostral-caudal levels are depicted in cartoons accessed from25 MouseLight https://registry.opendata.aws/janelia-mouselight.
(F–H) show outputs from the Hotspot analysis pipeline (see also text; see Figure S1 for representative LUT for heat map) from section in D with upper panels displaying data from the actual image and lower panels, from the same image in which pixels have been randomized.
(I–K) show Hotspot outputs from section in E with PFC terminal arbors at the top and S1 terminal arbors at the bottom. Quadrants used in H and K are marked by the white dotted lines seen in F and I. Abbreviations: DM, dorsomedial; VM, ventromedial; DL, dorsolateral; VL, ventrolateral. S1, somatosensory cortex area 1, PFC, prefrontal cortex.
To validate the approach, we tested the method on images of striatal sections from mice that had been injected with AAV1-hSyn-turboRFP into PFC and AAV1-hSyn-eGFP into primary somatosensory cortex (S1) (Figure 2A). Axon bundles in the internal capsule were masked and excluded from analysis (Figures 2B and 2C), and Hotspot analysis was then applied to the remaining axon terminal labeling patterns using a neighborhood size of 20 x 20 pixels (33μm2). Neighborhoods were assigned values based on z scores relative to the same image in which all pixel intensities were scrambled (Figure 2F “image” vs. “randomized”). Data from rostral (Figure 2D) and caudal (Figure 2E) striatal sections are shown in (1) z score-based heat maps where high scores are assigned warmer colors (Figures 2G and 2J; Figure S1); (2) mountain plots showing the peaks and valleys of mean z scores along the dorsal-ventral or medial-lateral axes of the striatum (Figures 2G and 2J; Figure S1); and (3) histograms where z score frequency was grouped into dorsomedial (DM), dorsolateral (DL), ventromedial (VM), or ventrolateral (VL) quadrants10 (Figures 2F, 2H, 2I, and 2K). Hotspot analysis shows that peak z scores corresponding to PFC or S1 terminal fields lie within completely separate striatal territories (Figures 2F–2K) and occupy domains that are consistent with published projection patterns in adult mice.9,10
We next used Hotspot analysis to define and compare the striatal territories occupied by PFC afferents as they develop at P7, P21, and P56. At P7 in rostral sections, PFC axons occupy the medial two-thirds of the striatum, while moving caudally, the distribution contracts into a more restricted, apostrophe-shaped region with a dorsomedial circular zone and a narrower tail extending ventromedially (Figure 3A). The innervation pattern is reflected in the z score heat maps (Figures 3A and 3B). To assess and compare the P7 pattern qualitatively with that seen at P21 and P56, we aligned heat maps and z score mountain plots running from rostral to caudal and observed relatively similar distributions of hot and cold spots (Figures 3B, 3C, 3E, 3F, 3H, and 3I). Quadrant plots taken from mid-striatal levels at all three ages confirm that the greatest frequency of positive z scores fall within the dorsomedial (DM) quadrant, followed by ventromedial (VM) (Figures 3D, 3G, and 3J). To compare innervation patterns quantitatively between mice and over time we calculated and plotted mean, standard deviation, and skew of the z score frequency distributions within each quadrant in mid-striatal sections from different animals and compared data from sections (joined by lines) across quadrant and age using two-way ANOVA (Figures 3K–3M). These metrics would tell us on average how clustered a quadrant was (mean), how variable the clustering was in each quadrant (standard deviation), and how extreme the z score values in a quadrant were (skew). The data show that mean z score is highest in DM and lowest in VL quadrants across ages. Within the DM quadrant z scores are highest at P7 and decline over time (Figure 3K), while standard deviation rises (Figure 3L). VM distribution is more consistent over time (Figures 3K and 3L), but skew rises sharply across both medial regions and falls across lateral regions over time (Figure 3M). These data suggest that a bias toward dorsomedial compartments at P7 is reduced over time as variability rises (Figures 3K and 3L) and that dorso- and ventromedial hotspots become more extreme (i.e., "hotter") over time (Figure 3M).
Figure 3.

PFC terminal axon innervation in the striatum is targeted and becomes more specific across time
(A) Hotspot z score heat maps for PFC projections to the P7 striatum in sections running rostral to caudal from a single brain. Numbers beneath the sections are used in subsequent panels to indicate relative rostral-caudal level.
(B and C) P7 z score heat maps, running from rostral to caudal, and mountain plots from a different brain. Mountain plots are aligned for ease of comparison. Orientation is indicated and the same in relation to Z score heatmap as shown in Figures 2E and 2H).
(D–J) Quadrant plot (D) of frequency distribution of z scores. (E–G) P21 and (H–J) P56 z score heat maps, mountain plots and quadrant plots show axon distribution pattern is generally similar across ages.
(K–M) (K) Bar and line graphs show z score means, (L) standard deviation, and (M) skew at different ages and across striatal quadrants. Lines connecting quadrants link data from the same section. Error bars show SEM. Results from two-way ANOVA are shown beneath each graph.
Corticostriatal synaptogenesis extends through postnatal development
Corticostriatal synapse densities were estimated by quantifying appositions of presynaptic VGlut1-and postsynaptic Homer1-immunolabeled puncta imaged at high magnification (Figure 4A). VGlut1 is expressed in all axon terminals from the cortex, amygdala and hippocampus, but the latter two sources account for only a small fraction of the total26,27 (Figure 4A). Homer1 is common to most excitatory postsynaptic densities. At P7, apposition density in the lateral striatum (Region B) was significantly higher than that observed either dorsally (Region A) or ventrally (Region C) (Figures 4B–4D), perhaps reflecting its earlier generation.17,28 By P21 this regional difference was no longer evident (Figures 4C and 4D). Thus, the establishment of sensorimotor synapses laterally appears to precede PFC synapses medially. Mean apposition density across the striatum did not change between P7 and P21 (Figure 4H), suggesting that the pace of synaptogenesis during this time frame was sufficient only to match the gains in striatal volume. This early period was followed by a surge in apposition density between P21 and P56 (Figure 4H). Although the density of VGlut1 terminals increased linearly over time (Figure 4F), the rise in Homer1 puncta density coincided with apposition density (Figure 4G), implying that postsynaptic maturation was rate limiting. The mean area of VGlut1 puncta was greater at P7 than at the later ages, consistent with previous work showing that vesicles in developing terminals are more loosely packed29 (Figure 4E).
Figure 4.

Synapse density increases steadily to young adulthood
(A–D) Images of VGlut1 (magenta) and Homer (green) immunolabeling in sections through the dorsal striatum captured on a confocal microscope (A). Diagram in (B) shows the regions from which images were captured (A: gray, dorsal); B: beige, lateral; C: blue, ventral). Line graph in (C) plots VGlut1 X Homer apposition density (see STAR Methods) for each region examined (2-way ANOVA, age effect p < 0.002; interaction effect p = 0.04; Fisher's A vs. B at P7 p = 0.0095) and bar/scatterplots in (D) compare regional densities at P7 (1-way ANOVA, p < 0.0001; Tukey's test ∗∗∗∗p < 0.001). Scatterplot in E compares area of VGlut1 terminals (1-way ANOVA p < 0.0001; Tukey's ∗∗∗∗p < 0.0001; ∗p = 0.17), and those in F, G, and H compare densities of VGlut1 terminals, Homer1 puncta and appositions over time (as shown. For each 1-way ANOVA, p < 0.0001; Tukey's ∗∗∗∗p < 0.0001; ∗p = 0.03).
(E–H) White (P7); blue (P21); gray (P56).
Whole-cell patch-clamp recordings of striatal projection neurons in acute striatal slices were used to compare intrinsic membrane and spontaneous and evoked excitatory synaptic functional properties of dorsomedial SPNs at P21 and P56. There were no differences between the two ages in resting membrane potential (Figure 5A), as expected.30 Intrinsic membrane excitability decreased significantly over this period as shown by a significant increase in rheobase (Figure 5C) and a decrease in membrane resistance (Figure 5D). Excitatory synaptic properties (frequency and amplitude), however, were not significantly different between P21 and P56. Spontaneous EPSCs (sEPSCs) displayed similar mean interevent intervals (Figures 5E and 5H) and amplitudes (Figures 5F and 5H) at the two ages, consistent with previous work.30 sEPSCs represent the total aggregate of glutamatergic inputs from several sources and the strengths of any of these could, in theory, be differentially adjusted over time. To compare the strength of PFC-to-dorsomedial striatal synapses at these two ages, we used an optogenetic approach. AAV was used to express channelrhodopsin (CaMKIIa-hChR2(H134R)-eYFP) in PFC striatal projection neurons. PFC terminals in the dorsomedial striatum (Figure 5G, left panel) were optically stimulated in acute slices with increasing light intensity. The input-output relationship of optically evoked synaptic responses was then evaluated by whole-cell recording from SPNs in the dorsomedial striatum (Figure 5G, right panel). We found that the amplitudes of optically evoked EPSCs (oEPSCs) at P21 were largely similar to those at P56 (Figures 5I and 5J). Normalized oEPSC amplitudes at the two ages were virtually identical, suggesting comparable levels of ChR2 protein and densities of ChR2-labeled corticostriatal terminals31 (Figure 5K). Together, these findings are broadly consistent with the sEPSC analysis (Figures 5E and 5F), but seem at odds with the rise in synapse (apposition) density between P21 and P56 (Figure 4H). It may be that as the number of synapse appositions increase, homeostatic mechanisms decrease intrinsic excitability (Figures 5A–5D) and reduce the strength of individual cortical synapses to keep overall neuronal firing within a certain range. Future studies of quantal amplitudes will be required to determine this.
Figure 5.

SPN intrinsic membrane properties change over time but synaptic properties are largely adult-like by P21
Data are from whole-cell recordings from SPNs in the dorsomedial striatum at ages indicated.
(A) Bar graph/scatterplots showing resting membrane potential (p = 0.3, Mann-Whitney U test).
(B) Bar graphs showing rheobase increases over time (p = 0.0001, t-test).
(C) Representative voltage traces in response to steps of depolarizing current injections showing action potentials generated at rheobase.
(D) Membrane resistance is significantly lower at P56 compared to P21 (p = 0.0007, Welch’s t-test).
(E) Spontaneous excitatory postsynaptic current (sEPSC) interevent intervals (IEIs) are similar at P21 and P56 (p = 0.4875; Mann-Whitney).
(F) sEPSC amplitudes are similar at these ages (p = 0.1643; Mann-Whitney). Data shown in A-F: P21: 17 cells/6 mice; P56: 19 cells/6 mice.
(G) Representative confocal images showing dense AAV1-CaMKIIa-hChR2(H134R)-eYFP-expressing corticostriatal terminals (green, left) in the dorsomedial striatum following injection in PFC to allow for selective, optical activation of PFC corticostriatal synapses. Alexa 594-labeled SPN (red; filled with biocytin during whole-cell recording) is shown at higher magnification at right; DAPI (blue); magnification shown in figures.
(H) Sample traces of sEPSCs recorded from SPNs at the ages indicated.
(I) Line graphs show optically evoked EPSC (oEPSC) amplitudes at P21 and P56 measured at increasing light intensities. Inset shows representative oEPSC traces at P21 (left, blue) and P56 (right, gray) at maximum light intensity (dark blue dot indicates light stimulus) (2-way RM ANOVA, Interaction effect p = 0.3432, Stimulus effect p = <0.0001, Age effect p = 0.7706; n = 8 cells/5 mice at P21 and n = 13 cells/5 mice at P56).
(J) Bar graphs showing that mean amplitude of corticostriatal oEPSCs evoked by maximum light stimulation at P21 are not significantly different than those evoked at P56 (p = 0.9109, t-test).
(K) Normalized input-output curves from data shown in H suggest that amounts of ChR2 protein and densities of ChR2-labeled terminals are comparable at the two ages (2-way RM ANOVA, Interaction effect p = 0.3403, Stimulus effect p = <0.001, Age effect p = 0.2435).
Cortical Cdh8 confines prefrontal cortex axons to their appropriate striatal territories
Expression of the cell adhesion protein Cdh8 is particularly enriched in the PFC and dorsal striatum as PFC axons are invading and establishing their territories.13,14 In the retina, Cdh8 plays an instructional role in targeting bipolar cell axon arbors.11 We wondered whether it might play a similar role in organizing striatal axon terminal territories. To test this, we generated a conditional, loxP-dependent Cdh8-knockout mouse using a construct that also contained a Frt-flanked LacZ reporter (Figure S2A). Prior to deleting the reporter cassette, we used LacZ expression to confirm that the construct was inserted appropriately and that Cdh8 is enriched in ACC, PL, IL, and striatum.13 Consistent with prior work, Cdh8 expression shows a medial (high) to lateral (low) gradient in cortex and a modest, dorsal (high) to ventral (low) gradient in the dorsal striatum with little expression evident in the ventral striatum (Figure S2B). To test the efficiency of loxP-mediated recombination, Cdh8fl/fl mice were crossed with Nex(NeuroD6)-Cre+/− mice, in which Cre recombinase is expressed by excitatory neocortical neurons but not by striatal neurons (Figure S2C).32 Western blots of regional dissections taken from littermates show near complete loss of Cdh8 in PFC (the remainder is consistent with low levels of Cdh8 reported in inhibitory neurons33), but unchanged Cdh8 expression levels in the striatum as expected (Figures S2D and S2E). Blots from the same tissue also show that levels of N-cadherin and the universal cadherin binding partner, β-catenin, were unchanged by Cdh8 deletion (Figures S2D, S2F, and S2G).
We next generated a line of conditional Cdh8 knockout mice (Cdh8-cKO) by crossing Cdh8fl/fl mice with Rbp4-Cre+/− expressing mice to conditionally disrupt Cdh8 expression in a more restricted cortical population than Nex-Cre.34,35,36,37 Rbp4-Cre is a strong driver that is enriched in cortical layer 5 intratelencephalic (IT) and pyramidal tract (PT) neurons, each of which project to the striatum,38,39 but is not expressed within the striatum.36 Adult Cdh8-cKO mice showed no gross anatomical abnormalities by Nissl-staining. When crossed to a tdTomato-Cre reporter line (Ai9), sections through the forebrain showed that Cdh8-cKO neurons migrated to their appropriate laminar positions and send their axons normally to the striatum in a matrix-like pattern, similar to Rbp4-Cre+/− control mice36,40 (Figures 6A and 6D). At the same time, Hotspot analysis revealed marked differences in innervation patterns, with Cdh8-cKO axons shifting ventrally relative to controls (Figures 6B, 6C, 6E, 6F, and 6M).
Figure 6.

Cdh8-cKO alters corticostriatal axon distribution
(A–O) Images and hotspot analysis data from Rbp4-Cre control (A–C) and conditional Rbp4-Cre;Cdh8fl/fl knockout tissue (D–F) from P21 mice crossed to a tdTomato Cre-reporter line (Ai9). Tiled confocal images (A, D) show prefrontal cortex (left: DAPI, white; middle: DAPI, blue, tdTomato, yellow), and dorsal striatum (right). Cortical layers indicated by Roman numerals and magnification for all shown in D. Heatmaps, mountain plots and quadrant plots from control (B, C) and Cdh8-cKO (E, F), reveal a ventral shift in corticostriatal territories. P56 z score heat maps (G), mountain plots (H) and quadrant plots (I) from PFC injections of Cre-dependent virus in Rbp4-Cre control (G–I) or Rbp4-Cre;Cdh8fl/fl mice (J–L). Notation is as for Figure 3. Bar and line graphs (M–O) plot z score mean (M), standard deviation (N) and skew (O) in each quadrant in Rpb4-Cre control and Cdh8 cKO mice. Lines connecting data across quadrants are taken from the same section. Error bars show SEM. Results from two-way ANOVA are shown beneath each graph.
To distinguish and compare the impact of Cdh8 disruption on PFC axons specifically, a Cre-dependent AAV expressing synaptophysin-mRuby was injected into PFC of Cdh8-cKO and control mice and striatal terminal fields were compared using Hotspot analysis at P56 (Figures 6G–6L). The distribution of z score heatmaps, aligned mountain plots, and quadrant plots suggest that PFC terminal axon territories exhibit a ventral shift, with Cdh8-cKO axons more robustly invading ventromedial territories and avoiding dorsomedial zones (Figures 6G–6I vs.6J–6L). We quantified the mean, standard deviation, and skew of the z score distributions across striatal quadrants and across genotypes (as in Figures 3K–3M) and compared patterns in Rbp4-Cre control and cKO mice (Figures 6M–6O). The data show that skew is significantly reduced (or more normally distributed; e.g., Figure S1C) in Cdh8-cKO compared to Rbp4-Cre control (Figure 6O). These results indicate that Rbp4-Cre-mediated knockout of Cdh8 diminishes corticostriatal axonal targeting.
Cdh8 removal from corticostriatal projection neurons reduces synapse function
Cdh8 is also found concentrated at asymmetric synapses in the dorsal striatum.13 To test whether unilateral removal of Cdh8 regulates corticostriatal synaptogenesis, we compared VGlut1/Homer1 apposition density in the dorsal striatum in Cdh8-cKO and control (Rbp4-Cre and wildtype) mice. No differences between genotypes were observed at either P21 or P56 (Figures 7A–7C). Comparisons across striatal regions (dorsal, lateral, and ventral, Figure 4B), also showed no impact of genotype (Figures 3A and 3B). In contrast, whole-cell recordings showed a significant increase in sEPSC interevent intervals in SPNs from Cdh8 cKO mice compared to littermate controls at P21 (Figure 7D). These findings were sustained at P56 (Figures 7F and 7G). A significant increase in amplitude was also observed at P21 but its small magnitude and absence at P56 suggests it is unlikely to be biologically meaningful (Figures 7E and 7H). Although we observed no changes in glutamatergic synapse density, cadherins can influence dendritic spine shape in hippocampus.41,42 Likewise, decreased afferent activity during striatal development might be anticipated to decrease spine density or slow maturation.36 To examine these possibilities, we labeled biocytin-filled SPNs with Alexa 594, imaged them at high magnification, and analyzed spines using NeuronStudio (Figure 7I; Figure S3C). Spine density increased between P21 and P56 as expected, but there were no genotype-dependent differences detected at either age (Figure 7J). There were also no significant differences in head diameter, but a decrease in spine length was observed at P56 (Figures S3C–S3E). Collectively the data suggest that Cdh8 has a modest impact on synapse maturation and a larger effect on glutamatergic synapse function.
Figure 7.

Cdh8 cKO reduces presynaptic function
(A–J) Confocal images of sections through the striatum of P56 control (Rbp4-Cre) and Cdh8 cKO mice immunolabeled for VGlut1 and Homer, shown individually and as an overlay (A; as shown). Bar and scatterplots in (B) and (C) compare VGlut1/Homer apposition density in the medial striatum assessed using strategy shown in Figure 5 (1-way ANOVA; p > 0.05). Cumulative frequency plots and traces from whole-cell patch clamp recordings in SPNs from P21 (D, E) or P56 (F–H) control (Cdh8fl/fl) or Cdh8-cKO slices showed significantly longer sEPSC interevent intervals at both ages (D, F, G; Kolmogorov-Smirnov test ∗∗∗p = 0.0005; ∗∗∗∗p < 0.0001) and a very modest increase in sEPSC amplitude (E, H; Kolmogorov-Smirnov test ∗∗p = 0.0043, P21 and p = 0.05, P56; n = 15–20 cells/5 animals per group). Confocal images (maximum intensity projections, deconvolved) of dendritic segments from filled medial striatal projection neurons at P21 (I). Bar and scatterplot (J) compares spine density at P21 and P56. A two-way ANOVA shows an impact of age (p < 0.0001), but none of genotype; 5–15 cells per group).
Instrumental learning
In a final set of experiments, we tested whether Rbp4Cre-mediated Cdh8 deletion altered action-outcome associations that rely on intact prefrontal-dorsomedial striatal connectivity.43,44,45 Using touchscreen-based operant chambers, we subjected male mice to a 4-day, instrumental learning paradigm in which they learn to associate an action with a reward. In wildtype mice, this instrumental paradigm drives goal-directed learning and is substantiated by sensitivity to outcome devaluation.46,47 Under a continuous reinforcement (CRF) schedule on day 1, all mice learned to associate a nose poke to a lit screen with a strawberry milk reward, displaying a similar number of responses (Figure 8A; CRF). On subsequent days 2–4 under a random interval (RI) reward schedule, control mice progressively increased the number of responses as the interval extended from 15 to 30 s, as expected46,48 (Figure 8A). In contrast, Cdh8-cKO mice showed no development of instrumental learning across training sessions (Figure 8A and legend). The failure of the Cdh8-cKO mice to learn this task prevented us from progressing to reward devaluation experiments that could be used to parse goal-directed from habitual responding. There were no significant genotype-dependent differences in overall motor activity (inferred by beam breaks) in any of the sessions (Figure 8B), nor were there significant differences in mean reward collection latencies (Figure 8C). These findings suggest that reduced performance of Cdh8-cKO mice was neither a function of reduced locomotor activity nor reduced motivation for the reward. Additionally, neither locomotion nor reward collection latencies correlated significantly with performance on the instrumental learning task on the first day of RI-30 testing (Spearman, reward collection latency: R = −0.56, p = 0.13; locomotion, R = 0.20, p = 0.63), supporting that the deficits observed in Cdh8-cKO mice are in instrumental learning. The poor performance of the Cdh8-cKO mice supports that Cdh8 expression in corticostriatal projection neurons is required for basic action-outcome learning.
Figure 8.

Cdh8-cKO mice exhibit reduced performance in an instrumental learning task
(A–C) Line graph (A) shows mean response times during an instrumental learning paradigm in which mice were rewarded every time they touched a screen (continuous reinforcement, CRF); or at random intervals (RI) within 15 or 30 s windows, as indicated (bars are SEM; n = 5 wildtype control CON; gray and 8 Cdh8 cKO mice; purple). Trace lines show individual animals. Cdh8 cKO mice failed to learn this task (A) two-way ANOVA, all mice: details in graph; 1-way ANOVA, Cdh8 mice only: p = 0.3; test for a linear trend: p = 0.1785. Bar graph/scatterplots show each session’s beam breaks (B) and reward collection latencies (C). While there were no genotype dependent differences in collection latencies, both groups showed a decrease over time, supporting that the mice were motivated to obtain the reward. Details of two-way ANOVA data are reported in each panel.
Discussion
We combined circuit-based mapping and molecular and functional assessments of synaptogenesis to outline the developmental time course over which PFC axons establish terminal territories within the striatum. We used the same assessments to show how corticostriatal terminals are modified by Cdh8 over time. The data show that the adult-like distribution of PFC projections to the medial striatum is largely defined by P7, with no evidence for widescale axonal or synaptic pruning over this period. The data also show that conditional, Rpb4-Cre-mediated deletion of Cdh8 from corticostriatal axons reduced targeting specificity, diminished synapse function, and produced significant deficits in instrumental learning.
One of the key findings is also the simplest: the adult-like topography of PFC projections to the striatum emerges developmentally by a targeted growth mechanism. Although there are numerous exceptions (e.g.,49,50), the literature is dominated by models in which axon growth is promoted and restrained toward a principal target within which terminal arbors overshoot and then are subsequently pruned to their final position/s.51 During development, PFC axons grow toward and innervate a defined striatal territory that closely matches adult patterns reported here and in prior work.9,10 Here, Hotspot data shows that z scores in medial regions of the striatum skew positively and more prominently over time, consistent with an active targeting mechanism.
Cdh8, which can bind homophilically and is enriched in cortical projection neurons and striatal SPNs13,52 appears to be part of this mechanism. PFC axons lacking Cdh8 were less targeted/more normally distributed in the striatum, consistent with previous work in the retina showing that retinal bipolar cells lacking Cdh8 extend their axons beyond their normal target layer.11 In most cases, type II cadherins have been shown to generate a high level of synapse specificity by acting combinatorially,11,53,54,55,56,57 and we predict an even greater impact on PFC axon targeting with simultaneous manipulation of several cadherins. Likely candidates for Cdh8 collaboration in the dorsal striatum are N-cadherin56 and Cdh11, the latter of which can bind Cdh8 heterophilically and is expressed in a partially overlapping pattern in the PFC and striatum.12,14,52,58 We expect these actions to occur in the context of complementary mechanisms driven by other molecules, such as Pcdh17, which has an expression pattern that overlaps that of Cdh8, and which may be important for cortical neuron development.59,60
Relative positions of cortical projections in the striatum are probably also driven in part by the location, molecular cues, and actions of other axon populations. In particular, glutamatergic thalamic innervation precedes cortical innervation,61 and medial parafascicular nucleus axons are confined to a medial zone of the striatum62 that cleaves close to the PFC terminal territory. This lays out the possibility that thalamic axons could provide cues for cortical axons to follow. In this light, Sema3E, PlexinD1 and Ten-m3, which support thalamostriatal synapse targeting63,64 may also play roles targeting PFC axons.
Our data also support that corticostriatal synapses do not undergo a phase of widescale synapse pruning while circuits are maturing during early development and adolescence.65,66 Synaptogenesis in the lateral striatum led medial striatum, consistent with the developmental gradient of SPN generation,16,67 and there was a steady increase in corticostriatal (VGlut1-labeled) pre-and postsynaptic appositions and dendritic spine density that dovetails with prior reports of a steady increase in SPN dendritic spine and asymmetric synapse density in the dorsal striatum.30,68,69,70,71 These events are in keeping with the strong influence of emergent cortical activity on striatal synapse development and maturation.36,69 They are also consistent with the close relationship between the generation of dendritic arbors and synapse formation.30,72 However, there was little evidence here or in previous work that cortical inputs to the dorsal striatum undergo a period of significant synapse elimination as part of a process of circuit refinement during the first eight weeks of life.29,30,65,68,69,70 It may be that use-dependent synapse sculpting is exerted differentially, as may be the case with different cortical layers,73 or contemporaneously, if increased input from one cortical area is balanced by loss from another. These are possibilities we would not have detected and could be revealed by activity-based manipulations. It should be underscored that corticostriatal synapses may be eliminated in adulthood as part of activity-mediated processes and certainly are under pathological circumstances, as happens in adult rodents in response to 6-OHDA lesion or in humans with Parkinson’s.74,75,76 However, such loss in the striatum appears to be motivated by circumstances that lie outside the large-scale pruning commonly associated with circuit formation during early life.77,78 This absence is also consistent with the idea that corticostriatal territories are largely directed from the outset.
Although corticostriatal synapse density rose between P21 and P56, sEPSC interevent intervals were similar at both ages. While counterintuitive, this functional outcome is in line with what has been reported previously in the dorsal striatum.30 This suggests that glutamatergic inputs from thalamus, cortex, or other regions may be weighted differently over time or that changes in release probability are actively compensating as new synapses are formed during this epoch.79 Spontaneous EPSC amplitudes were also similar at both ages and selective stimulation of PFC corticostriatal terminals showed that cortically evoked responses were largely unchanged between P21 and P56, indicating that adult-like functional properties of corticostriatal glutamatergic synapses are largely established by P21.30,69 Over the same postnatal period, we observed a significant decrease in intrinsic excitability which has been described previously,30,69 perhaps indicating compensatory (or homeostatic) adjustments to neuronal output as numbers of synapse appositions increased. Rbp4-Cre-mediated deletion of Cdh8 had no impact on the generation of corticostriatal synaptic appositions but did produce a lasting reduction in sEPSC frequency. While excitatory currents in SPNs are dominated by cortical inputs, we did not distinguish their source for this assessment, and based on Rbp4-Cre and Cdh8 expression, decreased responses could also reflect the loss of Cdh8 from thalamus.62,80
In contrast to the altered targeting of corticostriatal axonal arbors in Cdh8 cKOs, we observed no change in the density of corticostriatal (VGlut1-expressing) synapse appositions in the striatum or in the density of SPN dendritic spines in Cdh8 cKOs suggesting that the mistargeted axons form synapses. These findings are in line with data from Cdh8 knockout mice in which peripheral sensory neurons that normally express Cdh8 formed synapses but displayed reduced cold sensitivity,81 and mistargeted retinal bipolar cell axons formed synapses that failed to encode OFF visual responses.11 These data also support the idea that the impact of Cdh8 loss likely involves losing appropriate connections and gaining inappropriate ones, as evidenced here by the greatly impaired performance of Cdh8 cKO mice on an instrumental learning task. Since Rbp4-Cre is expressed in brain regions, other than the PFC and striatum, such as hippocampus and parafasicular nucleus that also express Cdh8, additional sources may contribute to poor task performance. Notably, however, action-outcome association is still learned normally when either the dorsal hippocampus is silenced or parafascicular nucleus is lesioned.82,83 Additionally, the expression of Rbp4-Cre in subpopulations of amacrine and retinal ganglion cell populations important for coding light intensity or motion84 was also unlikely to have interfered with performance in the instrumental learning task since light-based cue detection in Cdh8 cKO mice was sufficient for them to perform at wildtype levels under continuous reinforcement conditions.
Finally, we show that Hotspot analysis can be used to identify and quantitatively track patterns in a brain region containing few anatomical landmarks and one that is also expanding in size. Key advantages of Hotspot are its simplicity and z score-based readouts that can be used for detecting altered connectivity, which could serve as a basis for selecting targets or time points worthy of high-resolution approaches requiring very large datasets and high computational demands.
Limitations of the study
PFC projections to the striatum were analyzed based on the expression and transport of fluorescent reporters that were introduced stereotactically. While coordinates were kept as consistent as possible, injection size and placement varied between animals. In Cdh8 cKO mice our evaluations were restricted to those populations expressing Rbp4-Cre in the cerebral cortex and did not evaluate those striatal projections arriving from Rbp4-Cre-negative neurons. Conversely, behavioral outcomes reflect all neurons expressing Rbp4-Cre and Cdh8, a population that extends beyond the prefrontal cortex. There are strong data to support the relevance of PFC to striatal projections for learning to associate action with outcome, but there could have been unexpected consequences arising from the deletion of Cdh8 from layer V in other cortical areas or from other brain regions. Terminal distribution patterns in the striatum were estimated by systematic sampling, a strategy that could have missed interesting details. Future analyses will also be improved when brain registration strategies can be readily implemented in the pipeline for developing and adult brains.
STAR★Methods
Key resources table
| REAGENT or RESOURCE | SOURCE | IDENTIFIER |
|---|---|---|
| Antibodies | ||
| chicken anti-Homer 1 | Synaptic Systems | 160006; RRID:AB_2631222 |
| anti-chicken Alexa 488 | Jackson ImmunoResearch | 703-545-155; RRID:AB_2340375 |
| guinea pig anti-VGLUT1 | Millipore-Sigma | AB5905; RRID:AB_2301751 |
| anti-guinea pig Alexa 647 | Jackson ImmunoResearch | 706-605-148; RRID:AB_2340476 |
| rabbit anti-ß-catenin | Millipore | 06734; RRID:AB_310231 |
| goat anti-Cdh8 | Santa Cruz | sc6461; RRID:AB_2078271 |
| mouse anti-N-cadherin | BD Transduction | 610921; RRID:AB_2077527 |
| rabbit anti-tubulin | AbCam | Ab125267; RRID:AB_2210370 |
| Bacterial and virus strains | ||
| pENN.AAV1.hSyn.TurboRFP.WPRE.RBG | Addgene | 105552 (Wilson) |
| AAV1-hSyn-EGFP | Addgene | 50465 (Roth) |
| AAV1 hSyn FLEx mGFP-2A-Synaptophysin-mRuby | Stanford Vector Core | GVVC-AAV-100 (Luo) |
| pAAV1-CaMKIIa -hCHR2(H134R)-EYFP | Addgene | 26969 (Deisseroth) |
| Chemicals, peptides, and recombinant proteins | ||
| Triton-X-100 | Sigma | T-8787 |
| Vectashield | Vector Labs | H-1000 |
| GABAzine | Sigma | SR-95531 |
| dAPV | Sigma | A-8054 |
| Experimental models: Organisms/strains | ||
| C57BL/6J | Jackson Labs | RRID: IMSR_JAX:000664 |
| B6(129S4)-Cdh8<tm2c(KOMP)Wtsi>/DlbeJ | this paper | JAX:037592 (projected) |
| RBP4-Cre | MMRC | MMRRC_037128; GENSAT |
| B6. Cg-Gt(ROSA)26Sortm9(CAG-tdTomato)Hze/J | Jackson Labs | RRID: IMSR_JAX:007909 |
| NEX-Cre | K. Nave | Goebbels et al., 2006 |
| B6.129S4-Gt (ROSA)26Sortm2(FLP∗) Sor/J | Jackson Labs | RRID: IMSR_JAX:012930 |
| Oligonucleotides | ||
| CSD-lacF (LacZ Cassette) | Integrated DNA Technologies | GCTACCATTACCAGTTGGTCTGGTGTC |
| CSD-neoF (Neo Cassette) | Integrated DNA Technologies | GGGATCTCATGCTGGAGTTCTTCG |
| CSD-LoxF (LoxP sites) | Integrated DNA Technologies | GAGATGGCGCAACGCAATTAATG |
| CSD-Cdh8-R | Integrated DNA Technologies | AGCCCACCATAAAGTCATCCCATCC |
| CSD-Cdh8-tTr | Integrated DNA Technologies | ACCAGCCTCTATAAAGTACTCAAGTTGG |
| CSD-Cdh8-F | Integrated DNA Technologies | GCACATACCTTCACATCAAGGCTGC |
| RBP4(31125)F | Integrated DNA Technologies | GGGCGGCCTCGGTCCTC |
| GS Cre R2 | Integrated DNA Technologies | CCCCAGAAATGCCAGATTACGTAT |
| Cre Up 2 (Universal Cre) | Integrated DNA Technologies | GATCTCCGGTATTGAAACTCCAGC |
| Cre Dn 2 (Universal Cre) | Integrated DNA Technologies | GCTAAACATGCTTCATCGTCGG |
| oIMR8052 | Integrated DNA Technologies | GCG AAG AGT TTG TCC TCA ACC |
| oIMR8545 | Integrated DNA Technologies | AAA GTC GCT CTG AGT TGT TAT |
| oIMR8546 | Integrated DNA Technologies | GGA GCG GGA GAA ATG GAT ATG |
| Recombinant DNA | ||
| Cdh8(tm2a(KOMP)Wtsi) | UC Davis KOMP Repository) | CSD42057 |
| Software and algorithms | ||
| Image J/FIJI | Schindelin et al.85 | RRID: SCR_002285 |
| StereoInvestigator; Neurolucida; Neuroexplorer | MBF Bioscience | RRID:SCR_001775 |
| pClamp10 | Molecular Devices | RRID:SCR_011323 |
| Autoquant: AutoDeblur/AutoVisualize X | MediaCybernetics | RRID:SCR_002465 |
| NeuronStudio | Rodriguez et al.86 | RRID:SCR_013798 |
| Prism | GraphPad | RRID:SCR_002798 |
| Hotspot Analysis | this paper | github.com/deannabenson/HotspotAnalysis |
Resource availability
Lead contact
Further information and requests for resources and reagents should be directed to and will be fulfilled by the lead contact, DLB (deanna.benson@mssm.edu).
Materials availability
Cdh8fl/fl line generated in this study has been deposited at Jackson Labs [JAX: 037592].
Experimental model and study participant details
Mice of both sexes from the following lines were used to generate data: C57BL/6J (WT) mice (IMSR_JAX:000664); Cadherin-8 floxed mice (Cdh8fl/fl/; see below); RBP4-Cre mice (MMRRC_037128; GENSAT); Ai9 Cre reporter mice (IMSR_JAX:007909); and NEX-Cre mice (generous gift from Klaus-Armin Nave, Max Planck, Göttingen.32 All animals were kept with dams until weaning age (P21) and then housed in single-sex groups of 3 - 5 animals per cage. The care and treatment of all animals were in strict accordance with guidelines of the Institutional Animal Care and Use Committee of the ISMMS and those of the National Institutes of Health.
The Cdh8fl/fl/ mice were generated through embryonic stem cell germline transmission using a construct obtained from UC Davis, KOMP Repository: Cdh8tm2aKOMPWtsi.87 ES cells were injected into C57BL/6J blastocysts (Jackson Laboratories) at the ISMMS Mouse Genetics Core. The Cdh8 construct contains a lacZ cassette adjacent to a Neo cassette that are flanked by FRT sites and exon 3 of Cdh8, flanked by LoxP sites. Insertion and germline transmission in progeny was confirmed by long-range PCR. Site of insertion was also consistent with the expression pattern of LacZ staining, which matched published studies of Cdh8 mRNA distribution.13,14 The Neo (and LacZ) cassette was then removed by crossing the Cdh8fl/fl mice with a Flp recombinase line (IMSR_JAX:012930) and its deletion was confirmed by PCR. For this and all crosses, genotype was assessed with tail DNA extracted using RED Extract-N-Amp PCR Ready Mix (Sigma-Aldrich) followed by a polymerase chain reaction (PCR) using the relevant primers (Table S1). Amplicons were then visualized in a 1.5% agarose gel with ethidium bromide. Mice (Cdh8tm2c have been deposited at Jackson Labs (JAX: 037592).
Method details
Stereotaxic Surgeries
Mice were anesthetized by hypothermia (P0 - P1 pups) or with continuous delivery of isoflurane (P14 or older) and mounted in a stereotaxic frame (David Kopf Instruments, Tujunga, CA). Mice were injected with AAV1-hSyn-TurboRFP or -mGFP (Addgene or UPenn Vector Core; 105552; gift from James M Wilson); 50465; gift from Bryan Roth) at P0, P14 or P49 (7 days prior to sacrifice). For Rbp4-Cre mice, pAAV1 hSyn-FLEx mGFP-2A-Synaptophysin-mRuby (Stanford Vector Core; gift from Liqun Luo88) was introduced at P7 or P42 (14 days prior to sacrifice). For electrophysiological studies, PFC-neurons were transduced with pAAV1-CaMKIIa-hCHR2(H134R)-EYFP (Addgene 26969; gift from Karl Deisseroth89) 14-days prior to recording. Virus was delivered unilaterally using a Drummond Nanoject III at a speed of 2 nl/sec, into the PFC using the following coordinates from bregma: P0: A/P= 0.3, M/L= ± 0.1, D/V= -0.9; P14: A/P= 1.4, M/L= ± 0.3, D/V = - 1.6; P49: A/P=1.9, M/L= ± 0.3, D/V = -2.2 and total volume according to brain size and titer (adapted from90 or S1: A/P = -1.5, M/L = ±3.0, D/V = -0.7.
Tissue Preparation
Animals were perfused transcardially with saline (P7) or 1% paraformaldehyde (P21, P56) to clear vasculature, followed by ice chilled 4% paraformaldehyde in phosphate-buffered saline (PBS), pH 7.2 for 10 min. Brains were post-fixed for 10 - 14 h at 4°C, cryoprotected in 7% sucrose/PBS, and sectioned coronally using a vibratome (VT1000S, Leica Biosystems) at a setting of 50 μm through the entire extent of the striatum. All sections were collected and kept in order.
Stereology
For systematic random sampling, every 5th section was sampled beginning at the caudal end of the olfactory bulb to the anterior hippocampus. Tissue was washed in 1X PBS, mounted in VectaShield with DAPI (Vector Labs, H1200), and visualized on a Zeiss AxioImager widefield microscope using a 100X, 1.4 N.A. objective lens. Using StereoInvestigator (MBF Bioscience), axon length was estimated by counting axons crossing a virtual spaceball hemisphere (radius: 3 μm) within a guard zone height of 10 μm and a grid size of 200 μm x 300 μm (3 - 5 axons per grid) mapped in a systematically random fashion across striatum. Bundled internal capsule fibers running through the striatum were excluded. The PFC was defined as the anterior cingulate (ACC), prelimbic (PL) and infralimbic (IL) cortex (Figure 1B). Regions of interest (PFC, injection site, and striatum) were delineated using the Nissl (DAPI) staining pattern and the Allen Brain Mouse Atlas as a reference. Volumes were measured using the Cavalieri Estimator probe (MBF). With the Cavalieri estimator, one overlays a systematic, random sample of images of tissue sections (at a known distance apart) with a regular grid of points. Points within the region of interest are marked and volume is calculated based on numbers of points and distance between sections.91 We used Cavalieri_V_estimator (Image J), with gridpoint spacing set at 140 μm, every 250 μm on stitched tiled images acquired on a Zeiss LSM780 confocal microscope using a 20X objective lens.
Hotspot analysis
Sections were sampled as above and tiled images were captured and stitched using a Zeiss LSM 780 or 980 confocal microscope and a 20X objective. Eight-bit images were exported as 8-bit tifs to generate ROIs using FIJI. For Hotspot Analysis, we utilized the Getis Ord Gi∗ Statistic.15 This statistical method calculates the density of pixel values within a neighborhood, Gi, and the expected density of pixel values under the null hypothesis, E(Gi). It then uses those two values along with the variance of the dataset to generate a z score, which can be used to discern the likelihood that the observed level of pixel clustering within a neighborhood has occurred by chance. The Gi statistic is explained below:
The expected value of a given pixel under the null hypothesis of spatial randomness is the global mean pixel value:
| (X) = Σx /n |
where:
x are pixel values
n are the number of pixels in an image.
Then, the expected Gi statistic within any given neighborhood is:
| (Gi) =Σwij(d)E(Xj)/ ΣXj = Σwij(d)/n |
where:
wij(d) are all the pixels j within distance d of pixel i.
ΣXj is the sum of all pixel values j within distance d.
The actual density of pixel values within a neighborhood is calculated as:
where:
xj represents all the pixels in the neighborhood
The z score comparing the expected and actual Gi statistics is calculated as:
| Zi = Gi − (Gi)/ Sqr(Var(Gi)) |
where:
V(Gi) is the variance of the Gi statistic
By delineating an ROI, the dorsal striatum, and removing by thresholding the saturated pixels that comprise the bundles of descending axons in the internal capsule, maps were created by using the Gi statistic associated with a 20 x 20 pixel-sized neighborhood (local mean; size based on results from pilot studies). The output of this Python script provided a visual representation of axon clustering through the striatum and the summary statistics representing the z-scores for each pixel neighborhood. The custom scripts used for Hotspot Analysis can be found at: github.com/deannabenson/HotspotAnalysis.
The center point for each striatal ROI was used to generate four quadrants (DM, VM, DL, VL) and these were used to plot frequency distribution of z scores in each quadrant (see Figure 2). These divisions were also used to compare z score means, standard deviations and skew across mice. For this analysis, Hotspot data from striatal sections were taken from approximately level 2 or 3 (see Figure 3) from several different mice (one to two sections per mouse). Only mice having injections that were confined within PL, IL and ACC were included.
Immunohistochemistry and synapse analysis
Tissue sections that were collected as outlined for stereological studies were permeabilized using 0.25% Triton-X-100 (Sigma) for 5 - 7 min (RT) and blocked with 5% normal donkey serum (Jackson ImmunoResearch) for 1h, RT, all in PBS. Sections were then incubated sequentially: first in chicken-anti-Homer 1 (1:500, Synaptic Systems, Cat#160 006)/2% serum/PBS followed by anti-chicken Alexa-488 (1:200, Jackson ImmunoResearch); and second in guinea pig anti-vesicular glutamate transporter 1 antibody (VGLUT1, 1:1000, Millipore-Sigma, Cat#AB5905)/2% serum/PBS followed by anti-guinea pig Alexa-647 (1:200: Jackson ImmunoResearch). Sections were coverslipped in Mowiwol and sealed with nail polish. Single, optical confocal images were acquired using a 100X, 1.4 N.A. objective set at a zoom factor of 2 using an upright, fixed-stage Zeiss LSM780 (resolution, 24 pixels per micron). Images were captured across three regions in striatum (dorsal, lateral, ventral; Figure 5B); five images per section, four sections per mouse, and 3 - 5 mice per group. Images were imported into FIJI, and puncta were segmented by thresholding and used to generate masks. Puncta size and density (number per area) were assessed using "analyze particles" function set to exclude puncta below 0.07 μm2, a value determined in pilot studies and maintained throughout. Appositions were assessed by multiplying VGLUT1 and Homer image masks using the "image calculator" function, setting all unmatched pixels to zero. For presentation, images were processed with a Gaussian blur.
Western Blot
Whole-cell lysates were generated from cortex, striatum, and cerebellum (10 mM HEPES, 2 mM EDTA, 2 mM EGTA, 0.5 mM DTT, phosphatase and protease inhibitor cocktails; Sigma) via 3 X 5s pulses using a Kontes pestle gun. Samples were centrifuged 1500 g for 10 mins at 4°C, and protein concentrations were assessed using a Bradford assay (BioRad). Proteins (25 μg) per lane were separated using 8% SDS-PAGE, transferred to Immunoblot PVDF membranes (Millipore), blocked with LI-COR Odyssey Blocking Buffer with 0.1% Tween 20 (Thermo), incubated with primary antibodies directed against Cdh8 (sc6461, Santa Cruz), N-cadherin (BD Transduction Labs; 610921), ß-catenin (Millipore; 06734), ß-tubulin (Abcam; Ab125267). Membranes were washed and incubated with DyLight 800 or DyLight 680 conjugated secondaries (Pierce) and then imaged using a LI-COR Odyssey CLX imager (LI-COR Biosciences).
Electrophysiology
Whole-cell patch-clamp recordings from Cdh8fl/fl or Cdh8 cKO spiny projection neurons (SPNs) in the dorsal medial striatum were conducted in acute coronal slices (350 μm-thick) taken after deep anesthesia with isoflurane and rapid decapitation at P21 or P56. After 1h incubation at 37°C, slices were placed in an immersion chamber containing gabazine (GBZ; 10 μM; Sigma) at 31°C, which was used for all electrophysiological experiments. Recordings were made with a Multiclamp 700B amplifier (Molecular Devices, Sunnyvale, CA). Analog signals were low-pass filtered, digitized, and analyzed with pClamp10 software (Molecular Devices, Sunnyvale, CA). SPNs were visualized with an infrared camera (IR-1000; DAGE MTI) mounted on an upright epifluorescence microscope (BX50WI; Olympus). Whole-cell recordings were acquired using glass micropipettes with a resistance of 2–4 MΩ and filled with an intracellular solution containing 124 mM K-gluconate, 10 mM HEPES, 10 mM phosphocreatine di(Tris), 0.2 mM EGTA, 4 mM Mg2ATP, 0.3 mM Na2GTP, and (0.3%) biocytin. SPNs were recorded for 3 min following a 5 min equilibration period. After recording sEPSC activity in voltage-clamp mode, SPNs were identified electrophysiologically in current-clamp mode by observing characteristic patterns of action potentials induced by a series of depolarizing current pulses (10 s interpulse intervals, 500 ms-long pulses, 20 pA current intervals).92,93,94 Recordings of SPN firing characteristics were used for analysis in Clampfit for properties of intrinsic excitability. Input-output (I/O) experiments were conducted on acute slices collected from P21 and P56 WT mice that had been injected with an EYFP-tagged channelrhodopsin-2 virus in the PFC 14 days prior to recordings.95 PFC-terminals surrounding SPNs in DMS were stimulated utilizing a transistor–transistor logic (TTL)-pulsed microscope objective-coupled LEDs (473 nm, 20 mW/mm2; Prizmatix). Input-output curves were generated by increasing light intensity in a step-wise manner (∼1.2 mW/mm – 2 per step), from the minimal stimulation level 1 at resting membrane potential to evoke glutamatergic mediated responses. The elicited power of light stimuli was measured using an optical power meter (Thorlabs). For each stimulus, optically-evoked EPSC (oEPSC) amplitudes were normalized to the evoked amplitude response at maximal stimulation intensity for every individual cell to account for any potential impact of variations in viral expression levels or terminal densities as described.31
Morphometric analysis of biocytin-filled neurons
General procedures and spine morphometric analyses followed our general previously published protocols.93,94 All recorded SPNs were filled with biocytin (Tocris Bioscience) contained in the patch pipette. After recording, slices were immersed in 4% paraformaldehyde overnight at 4°C, permeabilized with 0.1% Triton X-100 for 2 h at RT, and labeled with streptavidin-conjugated Alexa Fluor 594 (1:300; Jackson ImmunoResearch) at 4°C for 48 h. SPNs were then imaged on an upright, fixed stage, confocal LSM 780 (Zeiss) using a 63X 1.4 N.A. objective, and Nyquist sampling to visualize and render dendritic spines (0.067 x 0.067 x 0.474 μm per voxel). Z-stacks were deconvolved using AutoDeblur/AutoVisualize X (MediaCybernetics). Dendritic spine density and morphology were assessed using NeuronStudio.86 Spines were defined as shorter than 2 μm and wider than 300 nm.96
Behavior
Instrumental learning was carried out in Bussey Saksida touchscreen-based operant chambers (Lafayette Instruments) using a protocol established previously46 in which mice were trained to nosepoke a single, lit response window to obtain a reward (strawberry milk). The presence of a reward was cued by the presentation of a tone. Two 60-minute training sessions served to habituate mice to the apparatus, and this was followed by a 2 h continuous reinforcement schedule (CRF) in which each nose poke was rewarded with a reward. Mice then progressed to the testing phase which each 60 m session was administered over four consecutive days. The first session was CRF, and the remaining three were random interval (RI) schedules in which the probability of the reward remained constant over a 15 s (day 2), 30 s (day 3), or 30 s (day 4) intervals. The random interval timer was initiated by the first nose poke. Schedules were controlled and data were collected using ABET II Touch software (Lafayette) and then exported to Excel.
Quantification and statistical analysis
Both sexes were used, and data were analyzed for sex differences. Because no sex-dependent differences were found, data from both males and females were pooled except for behavior, where only male mice were used. Group sizes were 3 - 5 mice per genotype for anatomical and synaptic studies (5 images per region; 3 - 5 sections per animal) and ∼15 cells per condition, from 8 - 15 brain slices, from 5 - 6 mice per genotype/sex. Where relevant, genotype identity was coded and analyzed blind. Data were expressed as mean + SEM. Repeated measures ANOVA with post hoc Bonferroni or Holm-Šídák corrections for multiple comparisons and 2-way ANOVA or mixed-effects model analysis were used to delineate impact of the manipulation vs. genotype or age. Unpaired Student’s t-tests and Mann-Whitney U (Wilcoxon’s rank sum) test were used for comparison between conditions and cell types for electrophysiology experiments. For analysis of dendritic spines, groups were compared using 1-way ANOVA. Spine-head diameter and spine length cumulative frequency distributions were compared using two-sample Kolmogorov–Smirnov tests. For all experiments, a minimum criterion of p < 0.05 was used for biological significance. Additional specifics are given in figure legends.
Acknowledgments
We thank Frances Williams, Romario Thomas, and Mofida Abdelmageed for technical support. We would like to thank Dr. Sijie Hao for help in developing synapse analysis strategies, and to acknowledge the ISMMS Microscopy and Advanced Bioimaging Core for access to instruments and expertise, and the ISMMS Mouse Genetics and Gene Targeting Core and Dr. Kevin Kelley for reviving the Rpb4-Cre line and for generating and cryopreserving the Cdh8 conditional mutant mouse, which was made with ES cells that were generated by the trans-NIH Knock-Out Mouse Project (KOMP) and obtained from the KOMP Repository at UC Davis (U42RR024244). This work was supported by the following funding agencies and charitable organizations: NCRR (NIH) R01 NS107512 (GWH, DLB), R01 MH104491 (GWH, DLB), F31 CA268947 (PDV), F31 NS117089 (AH), F31 MH126543 (YZ), F31 MH115541 (RM), T32 MH087004 (CAG, KT), T32 AG049688 (ARM), Autism Speaks Weatherstone Predoctoral Fellowship Grant 10544 (RM), Rainwater Charitable Fdn (CAG).
Author contributions
REM, DLB, and GWH conceived the study. REM, YZ, DLB, and GWH designed the experiments. Methodology and implementation: stereology (RM); Hotspot development (YZ); Hotspot analysis (YZ, REM, and DLB), synapse analysis (REM and DLB); floxed mouse (LGF and REM), behavior (AH); electrophysiology (CAG); neuron reconstruction (REM, CAG, KT); anatomy and imaging pipeline (REM, YZ, PDV, ARM, and NT); analysis (REM, YZ, DLB, GWH, and MGB). REM, DLB, GWH, YZ, MGB, and AH contributed to the interpretation of results. Writing-original draft: REM and DLB; Writing-review and editing: REM, YZ, DLB, GWH, MGB; LGF, KT, AM, NT, and PDV.
Declaration of interests
The authors declare no competing interests.
Inclusion and diversity
One or more of the authors of this paper self-identifies as an underrepresented ethnic minority in their field of research or within their geographical location. One or more of the authors of this paper self-identifies as a gender minority in their field of research. One or more of the authors of this paper self-identifies as a member of the LGBTQIA+ community. One or more of the authors of this paper received support from a program designed to increase minority representation in their field of research.
Published: September 22, 2023
Footnotes
Supplemental information can be found online at https://doi.org/10.1016/j.isci.2023.108002.
Supplemental information
Data and code availability
All original code and example datasets have been deposited at GitHub and are publicly available. Any additional information required to reanalyze data in this paper is available from the lead contact upon request.
References
- 1.Balleine B.W., Delgado M.R., Hikosaka O. The role of the dorsal striatum in reward and decision-making. J. Neurosci. 2007;27:8161–8165. doi: 10.1523/JNEUROSCI.1554-07.2007. [DOI] [PMC free article] [PubMed] [Google Scholar]
- 2.Kennerley S.W., Walton M.E., Behrens T.E.J., Buckley M.J., Rushworth M.F.S. Optimal decision making and the anterior cingulate cortex. Nat. Neurosci. 2006;9:940–947. doi: 10.1038/nn1724. [DOI] [PubMed] [Google Scholar]
- 3.Klune C.B., Jin B., DeNardo L.A. Linking mPFC circuit maturation to the developmental regulation of emotional memory and cognitive flexibility. Elife. 2021;10:e64567. doi: 10.7554/eLife.64567. [DOI] [PMC free article] [PubMed] [Google Scholar]
- 4.Li W., Pozzo-Miller L. Dysfunction of the corticostriatal pathway in autism spectrum disorders. J. Neurosci. Res. 2020;98:2130–2147. doi: 10.1002/jnr.24560. [DOI] [PMC free article] [PubMed] [Google Scholar]
- 5.Shepherd G.M.G. Corticostriatal connectivity and its role in disease. Nat. Rev. Neurosci. 2013;14:278–291. doi: 10.1038/nrn3469. [DOI] [PMC free article] [PubMed] [Google Scholar]
- 6.Foster N.N., Barry J., Korobkova L., Garcia L., Gao L., Becerra M., Sherafat Y., Peng B., Li X., Choi J.-H., et al. The mouse cortico-basal ganglia-thalamic network. Nature. 2021;598:188–194. doi: 10.1038/s41586-021-03993-3. [DOI] [PMC free article] [PubMed] [Google Scholar]
- 7.Alexander G.E., DeLong M.R., Strick P.L. Parallel Organization of Functionally Segregated circuits linking basal ganglia and cortex. Annu. Rev. Neurosci. 1986;9:357–381. doi: 10.1146/annurev.ne.09.030186.002041. [DOI] [PubMed] [Google Scholar]
- 8.Hooks B.M., Papale A.E., Paletzki R.F., Feroze M.W., Eastwood B.S., Couey J.J., Winnubst J., Chandrashekar J., Gerfen C.R. Topographic precision in sensory and motor corticostriatal projections varies across cell type and cortical area. Nat. Commun. 2018;9:3549. doi: 10.1038/s41467-018-05780-7. [DOI] [PMC free article] [PubMed] [Google Scholar]
- 9.Hunnicutt B.J., Jongbloets B.C., Birdsong W.T., Gertz K.J., Zhong H., Mao T. A comprehensive excitatory input map of the striatum reveals novel functional organization. Elife. 2016;5:e19103. doi: 10.7554/eLife.19103. [DOI] [PMC free article] [PubMed] [Google Scholar]
- 10.Hintiryan H., Foster N.N., Bowman I., Bay M., Song M.Y., Gou L., Yamashita S., Bienkowski M.S., Zingg B., Zhu M., et al. The mouse cortico-striatal projectome. Nat. Neurosci. 2016;19:1100–1114. doi: 10.1038/nn.4332. [DOI] [PMC free article] [PubMed] [Google Scholar]
- 11.Duan X., Krishnaswamy A., De la Huerta I., Sanes J.R. Type II cadherins guide assembly of a direction-selective retinal circuit. Cell. 2014;158:793–807. doi: 10.1016/j.cell.2014.06.047. [DOI] [PubMed] [Google Scholar]
- 12.Frei J.A., Niescier R.F., Bridi M.S., Durens M., Nestor J.E., Kilander M.B.C., Yuan X., Dykxhoorn D.M., Nestor M.W., Huang S., et al. Regulation of neural circuit development by Cadherin-11 provides implications for autism. eNeuro. 2021;8 doi: 10.1523/ENEURO.0066-21.2021. ENEURO.0066-21.2021. [DOI] [PMC free article] [PubMed] [Google Scholar]
- 13.Friedman L.G., Riemslagh F.W., Sullivan J.M., Mesias R., Williams F.M., Huntley G.W., Benson D.L. Cadherin-8 expression, synaptic localization, and molecular control of neuronal form in prefrontal corticostriatal circuits. J. Comp. Neurol. 2015;523:75–92. doi: 10.1002/cne.23666. [DOI] [PMC free article] [PubMed] [Google Scholar]
- 14.Suzuki S.C., Inoue T., Kimura Y., Tanaka T., Takeichi M. Neuronal circuits are subdivided by differential expression of type-II classic cadherins in postnatal mouse brains. Mol. Cell. Neurosci. 1997;9:433–447. doi: 10.1006/mcne.1997.0626. [DOI] [PubMed] [Google Scholar]
- 15.Getis A., Ord J.K. The analysis of spatial association by use of distance statistics. Geogr. Anal. 2010;24:189–206. [Google Scholar]
- 16.Bayer S.A., Altman J. Directions in neurogenetic gradients and patterns of anatomical connections in the telencephalon. Prog. Neurobiol. 1987;29:57–106. doi: 10.1016/0301-0082(87)90015-3. [DOI] [PubMed] [Google Scholar]
- 17.Marchand R., Lajoie L. Histogenesis of the striopallidal system in the rat. Neurogenesis of its neurons. Neuroscience. 1986;17:573–590. doi: 10.1016/0306-4522(86)90031-x. [DOI] [PubMed] [Google Scholar]
- 18.Deacon T.W., Pakzaban P., Isacson O. The lateral ganglionic eminence is the origin of cells committed to striatal phenotypes: neural transplantation and developmental evidence. Brain Res. 1994;668:211–219. doi: 10.1016/0006-8993(94)90526-6. [DOI] [PubMed] [Google Scholar]
- 19.van der Kooy D., Fishell G. Neuronal birthdate underlies the development of striatal compartments. Brain Res. 1987;401:155–161. doi: 10.1016/0006-8993(87)91176-0. [DOI] [PubMed] [Google Scholar]
- 20.Sohur U.S., Padmanabhan H.K., Kotchetkov I.S., Menezes J.R.L., Macklis J.D. Anatomic and molecular development of corticostriatal projection neurons in mice. Cerebr. Cortex. 2014;24:293–303. doi: 10.1093/cercor/bhs342. [DOI] [PMC free article] [PubMed] [Google Scholar]
- 21.Balleine B.W., O’Doherty J.P. Human and rodent homologies in action control: Corticostriatal determinants of goal-directed and habitual action. Neuropsychopharmacology. 2010;35:48–69. doi: 10.1038/npp.2009.131. [DOI] [PMC free article] [PubMed] [Google Scholar]
- 22.Rushworth M.F.S., Walton M.E., Kennerley S.W., Bannerman D.M. Action sets and decisions in the medial frontal cortex. Trends Cognit. Sci. 2004;8:410–417. doi: 10.1016/j.tics.2004.07.009. [DOI] [PubMed] [Google Scholar]
- 23.Calhoun M.E., Mao Y., Roberts J.A., Rapp P.R. Reduction in hippocampal cholinergic innervation is unrelated to recognition memory impairment in aged rhesus monkeys. J. Comp. Neurol. 2004;475:238–246. doi: 10.1002/cne.20181. [DOI] [PubMed] [Google Scholar]
- 24.Van Eden C.G., Uylings H.B. Postnatal volumetric development of the prefrontal cortex in the rat. J. Comp. Neurol. 1985;241:268–274. doi: 10.1002/cne.902410303. [DOI] [PubMed] [Google Scholar]
- 25.Winnubst J., Bas E., Ferreira T.A., Wu Z., Economo M.N., Edson P., Arthur B.J., Bruns C., Rokicki K., Schauder D., et al. Reconstruction of 1,000 projection neurons reveals new cell types and organization of long-range connectivity in the mouse brain. Cell. 2019;179:268–281.e13. doi: 10.1016/j.cell.2019.07.042. [DOI] [PMC free article] [PubMed] [Google Scholar]
- 26.Groenewegen H.J., Vermeulen-Van der Zee E., te Kortschot A., Witter M.P. Organization of the projections from the subiculum to the ventral striatum in the rat. A study using anterograde transport of Phaseolus vulgaris leucoagglutinin. Neuroscience. 1987;23:103–120. doi: 10.1016/0306-4522(87)90275-2. [DOI] [PubMed] [Google Scholar]
- 27.Kelley A.E., Domesick V.B., Nauta W.J. The amygdalostriatal projection in the rat--an anatomical study by anterograde and retrograde tracing methods. Neuroscience. 1982;7:615–630. doi: 10.1016/0306-4522(82)90067-7. [DOI] [PubMed] [Google Scholar]
- 28.Fentress J.C., Stanfield B.B., Cowan W.M. Observation on the development of the striatum in mice and rats. Anat. Embryol. 1981;163:275–298. doi: 10.1007/BF00315705. [DOI] [PubMed] [Google Scholar]
- 29.Sharpe N.A., Tepper J.M. Postnatal development of excitatory synaptic input to the rat neostriatum: an electron microscopic study. Neuroscience. 1998;84:1163–1175. doi: 10.1016/s0306-4522(97)00583-6. [DOI] [PubMed] [Google Scholar]
- 30.Krajeski R.N., Macey-Dare A., van Heusden F., Ebrahimjee F., Ellender T.J. Dynamic postnatal development of the cellular and circuit properties of striatal D1 and D2 spiny projection neurons. J. Physiol. 2019;597:5265–5293. doi: 10.1113/JP278416. [DOI] [PMC free article] [PubMed] [Google Scholar]
- 31.Britt J.P., Benaliouad F., McDevitt R.A., Stuber G.D., Wise R.A., Bonci A. Synaptic and behavioral profile of multiple glutamatergic inputs to the nucleus accumbens. Neuron. 2012;76:790–803. doi: 10.1016/j.neuron.2012.09.040. [DOI] [PMC free article] [PubMed] [Google Scholar]
- 32.Goebbels S., Bormuth I., Bode U., Hermanson O., Schwab M.H., Nave K.A. Genetic targeting of principal neurons in neocortex and hippocampus of NEX-Cre mice. Genesis. 2006;44:611–621. doi: 10.1002/dvg.20256. [DOI] [PubMed] [Google Scholar]
- 33.Memi F., Killen A.C., Barber M., Parnavelas J.G., Andrews W.D. Cadherin 8 regulates proliferation of cortical interneuron progenitors. Brain Struct. Funct. 2019;224:277–292. doi: 10.1007/s00429-018-1772-4. [DOI] [PMC free article] [PubMed] [Google Scholar]
- 34.Harris J.A., Mihalas S., Hirokawa K.E., Whitesell J.D., Choi H., Bernard A., Bohn P., Caldejon S., Casal L., Cho A., et al. Hierarchical organization of cortical and thalamic connectivity. Nature. 2019;575:195–202. doi: 10.1038/s41586-019-1716-z. [DOI] [PMC free article] [PubMed] [Google Scholar]
- 35.Gerfen C.R., Paletzki R., Heintz N. GENSAT BAC cre-recombinase driver lines to study the functional organization of cerebral cortical and basal ganglia circuits. Neuron. 2013;80:1368–1383. doi: 10.1016/j.neuron.2013.10.016. [DOI] [PMC free article] [PubMed] [Google Scholar]
- 36.Kozorovitskiy Y., Saunders A., Johnson C.A., Lowell B.B., Sabatini B.L. Recurrent network activity drives striatal synaptogenesis. Nature. 2012;485:646–650. doi: 10.1038/nature11052. [DOI] [PMC free article] [PubMed] [Google Scholar]
- 37.Leone D.P., Heavner W.E., Ferenczi E.A., Dobreva G., Huguenard J.R., Grosschedl R., McConnell S.K. Satb2 regulates the differentiation of both callosal and subcerebral projection neurons in the developing cerebral cortex. Cerebr. Cortex. 2015;25:3406–3419. doi: 10.1093/cercor/bhu156. [DOI] [PMC free article] [PubMed] [Google Scholar]
- 38.Harris J.A., Hirokawa K.E., Sorensen S.A., Gu H., Mills M., Ng L.L., Bohn P., Mortrud M., Ouellette B., Kidney J., et al. Anatomical characterization of Cre driver mice for neural circuit mapping and manipulation. Front. Neural Circ. 2014;8:76. doi: 10.3389/fncir.2014.00076. [DOI] [PMC free article] [PubMed] [Google Scholar]
- 39.Graybuck L.T., Daigle T.L., Sedeño-Cortés A.E., Walker M., Kalmbach B., Lenz G.H., Morin E., Nguyen T.N., Garren E., Bendrick J.L., et al. Enhancer viruses for combinatorial cell-subclass-specific labeling. Neuron. 2021;109:1449–1464.e13. doi: 10.1016/j.neuron.2021.03.011. [DOI] [PMC free article] [PubMed] [Google Scholar]
- 40.Lein E.S., Hawrylycz M.J., Ao N., Ayres M., Bensinger A., Bernard A., Boe A.F., Boguski M.S., Brockway K.S., Byrnes E.J., et al. Genome-wide atlas of gene expression in the adult mouse brain. Nature. 2007;445:168–176. doi: 10.1038/nature05453. [DOI] [PubMed] [Google Scholar]
- 41.Bozdagi O., Wang X.B., Nikitczuk J.S., Anderson T.R., Bloss E.B., Radice G.L., Zhou Q., Benson D.L., Huntley G.W. Persistence of coordinated long-term potentiation and dendritic spine enlargement at mature hippocampal CA1 synapses requires N-cadherin. J. Neurosci. 2010;30:9984–9989. doi: 10.1523/JNEUROSCI.1223-10.2010. [DOI] [PMC free article] [PubMed] [Google Scholar]
- 42.Huntley G.W., Elste A.M., Patil S.B., Bozdagi O., Benson D.L., Steward O. Synaptic loss and retention of different classic cadherins with LTP-associated synaptic structural remodeling in vivo. Hippocampus. 2012;22:17–28. doi: 10.1002/hipo.20859. [DOI] [PMC free article] [PubMed] [Google Scholar]
- 43.Yin H.H., Ostlund S.B., Knowlton B.J., Balleine B.W. The role of the dorsomedial striatum in instrumental conditioning. Eur. J. Neurosci. 2005;22:513–523. doi: 10.1111/j.1460-9568.2005.04218.x. [DOI] [PubMed] [Google Scholar]
- 44.Balleine B.W., Dickinson A. Goal-directed instrumental action: contingency and incentive learning and their cortical substrates. Neuropharmacology. 1998;37:407–419. doi: 10.1016/s0028-3908(98)00033-1. [DOI] [PubMed] [Google Scholar]
- 45.Woon E.P., Sequeira M.K., Barbee B.R., Gourley S.L. Involvement of the rodent prelimbic and medial orbitofrontal cortices in goal-directed action: A brief review. J. Neurosci. Res. 2020;98:1020–1030. doi: 10.1002/jnr.24567. [DOI] [PMC free article] [PubMed] [Google Scholar]
- 46.Hussein A., Tielemans A., Baxter M.G., Benson D.L., Huntley G.W. Cognitive deficits and altered cholinergic innervation in young adult male mice carrying a Parkinson’s disease Lrrk2G2019S knockin mutation. Exp. Neurol. 2022;355:114145. doi: 10.1016/j.expneurol.2022.114145. [DOI] [PMC free article] [PubMed] [Google Scholar]
- 47.Shan Q., Ge M., Christie M.J., Balleine B.W. The acquisition of goal-directed actions generates opposing plasticity in direct and indirect pathways in dorsomedial striatum. J. Neurosci. 2014;34:9196–9201. doi: 10.1523/JNEUROSCI.0313-14.2014. [DOI] [PMC free article] [PubMed] [Google Scholar]
- 48.Shiflett M.W., Brown R.A., Balleine B.W. Acquisition and performance of goal-directed instrumental actions depends on ERK signaling in distinct regions of dorsal striatum in rats. J. Neurosci. 2010;30:2951–2959. doi: 10.1523/JNEUROSCI.1778-09.2010. [DOI] [PMC free article] [PubMed] [Google Scholar]
- 49.Agmon A., Yang L.T., Jones E.G., O’Dowd D.K. Topological precision in the thalamic projection to neonatal mouse barrel cortex. J. Neurosci. 1995;15:549–561. doi: 10.1523/JNEUROSCI.15-01-00549.1995. [DOI] [PMC free article] [PubMed] [Google Scholar]
- 50.Simpson H.D., Kita E.M., Scott E.K., Goodhill G.J. A quantitative analysis of branching, growth cone turning, and directed growth in zebrafish retinotectal axon guidance. J. Comp. Neurol. 2013;521:1409–1429. doi: 10.1002/cne.23248. [DOI] [PubMed] [Google Scholar]
- 51.Riccomagno M.M., Kolodkin A.L. Sculpting neural circuits by axon and dendrite pruning. Annu. Rev. Cell Dev. Biol. 2015;31:779–805. doi: 10.1146/annurev-cellbio-100913-013038. [DOI] [PMC free article] [PubMed] [Google Scholar]
- 52.Brasch J., Katsamba P.S., Harrison O.J., Ahlsén G., Troyanovsky R.B., Indra I., Kaczynska A., Kaeser B., Troyanovsky S., Honig B., Shapiro L. Homophilic and heterophilic interactions of type II cadherins identify specificity groups underlying cell-adhesive behavior. Cell Rep. 2018;23:1840–1852. doi: 10.1016/j.celrep.2018.04.012. [DOI] [PMC free article] [PubMed] [Google Scholar]
- 53.Basu R., Duan X., Taylor M.R., Martin E.A., Muralidhar S., Wang Y., Gangi-Wellman L., Das S.C., Yamagata M., West P.J., et al. Heterophilic type II cadherins are required for high-magnitude synaptic potentiation in the hippocampus. Neuron. 2017;96:160–176.e8. doi: 10.1016/j.neuron.2017.09.009. [DOI] [PMC free article] [PubMed] [Google Scholar]
- 54.Kuwako K.I., Nishimoto Y., Kawase S., Okano H.J., Okano H. Cadherin-7 regulates mossy fiber connectivity in the cerebellum. Cell Rep. 2014;9:311–323. doi: 10.1016/j.celrep.2014.08.063. [DOI] [PubMed] [Google Scholar]
- 55.Osterhout J.A., Josten N., Yamada J., Pan F., Wu S.W., Nguyen P.L., Panagiotakos G., Inoue Y.U., Egusa S.F., Volgyi B., et al. Cadherin-6 mediates axon-target matching in a non-image-forming visual circuit. Neuron. 2011;71:632–639. doi: 10.1016/j.neuron.2011.07.006. [DOI] [PMC free article] [PubMed] [Google Scholar]
- 56.Vagnozzi A.N., Moore M.T., Lin M., Brozost E.M., Kc R., Agarwal A., Schwarz L.A., Duan X., Zampieri N., Landmesser L.T., Philippidou P. Coordinated cadherin functions sculpt respiratory motor circuit connectivity. Elife. 2022;11:e82116. doi: 10.7554/eLife.82116. [DOI] [PMC free article] [PubMed] [Google Scholar]
- 57.Duan X., Krishnaswamy A., Laboulaye M.A., Liu J., Peng Y.-R., Yamagata M., Toma K., Sanes J.R. Cadherin combinations recruit dendrites of distinct retinal neurons to a shared interneuronal scaffold. Neuron. 2018;99:1145–1154.e6. doi: 10.1016/j.neuron.2018.08.019. [DOI] [PMC free article] [PubMed] [Google Scholar]
- 58.Patel S.D., Ciatto C., Chen C.P., Bahna F., Rajebhosale M., Arkus N., Schieren I., Jessell T.M., Honig B., Price S.R., Shapiro L. Type II cadherin ectodomain structures: implications for classical cadherin specificity. Cell. 2006;124:1255–1268. doi: 10.1016/j.cell.2005.12.046. [DOI] [PubMed] [Google Scholar]
- 59.Chang H., Hoshina N., Zhang C., Ma Y., Cao H., Wang Y., Wu D.-D., Bergen S.E., Landén M., Hultman C.M., et al. The protocadherin 17 gene affects cognition, personality, amygdala structure and function, synapse development and risk of major mood disorders. Mol. Psychiatr. 2018;23:400–412. doi: 10.1038/mp.2016.231. [DOI] [PMC free article] [PubMed] [Google Scholar]
- 60.Hoshina N., Tanimura A., Yamasaki M., Inoue T., Fukabori R., Kuroda T., Yokoyama K., Tezuka T., Sagara H., Hirano S., et al. Protocadherin 17 regulates presynaptic assembly in topographic corticobasal Ganglia circuits. Neuron. 2013;78:839–854. doi: 10.1016/j.neuron.2013.03.031. [DOI] [PubMed] [Google Scholar]
- 61.Tran H. SES Repository, University of Sydney; 2013. The Role of Ten-M3 in the Development of the Mouse Thalamostriatal Pathway. [Google Scholar]
- 62.Mandelbaum G., Taranda J., Haynes T.M., Hochbaum D.R., Huang K.W., Hyun M., Umadevi Venkataraju K., Straub C., Wang W., Robertson K., et al. Distinct cortical-thalamic-striatal circuits through the parafascicular nucleus. Neuron. 2019;102:636–652.e7. doi: 10.1016/j.neuron.2019.02.035. [DOI] [PMC free article] [PubMed] [Google Scholar]
- 63.Ding J.B., Oh W.J., Sabatini B.L., Gu C. Semaphorin 3E-Plexin-D1 signaling controls pathway-specific synapse formation in the striatum. Nat. Neurosci. 2011;15:215–223. doi: 10.1038/nn.3003. [DOI] [PMC free article] [PubMed] [Google Scholar]
- 64.Tran H., Sawatari A., Leamey C.A. The glycoprotein Ten-m3 mediates topography and patterning of thalamostriatal projections from the parafascicular nucleus in mice. Eur. J. Neurosci. 2015;41:55–68. doi: 10.1111/ejn.12767. [DOI] [PubMed] [Google Scholar]
- 65.Brust V., Schindler P.M., Lewejohann L. Lifetime development of behavioural phenotype in the house mouse (Mus musculus) Front. Zool. 2015;12:S17. doi: 10.1186/1742-9994-12-S1-S17. [DOI] [PMC free article] [PubMed] [Google Scholar]
- 66.Faust T.E., Gunner G., Schafer D.P. Mechanisms governing activity-dependent synaptic pruning in the mammalian CNS. Nat. Rev. Neurosci. 2021;22:657–673. doi: 10.1038/s41583-021-00507-y. [DOI] [PMC free article] [PubMed] [Google Scholar]
- 67.Uryu K., Butler A.K., Chesselet M.F. Synaptogenesis and ultrastructural localization of the polysialylated neural cell adhesion molecule in the developing striatum. J. Comp. Neurol. 1999;405:216–232. doi: 10.1002/(sici)1096-9861(19990308)405:2<216::aid-cne6>3.0.co;2-6. [DOI] [PubMed] [Google Scholar]
- 68.Hattori T., McGeer P.L. Synaptogenesis in the corpus striatum of infant rat. Exp. Neurol. 1973;38:70–79. doi: 10.1016/0014-4886(73)90008-3. [DOI] [PubMed] [Google Scholar]
- 69.Peixoto R.T., Wang W., Croney D.M., Kozorovitskiy Y., Sabatini B.L. Early hyperactivity and precocious maturation of corticostriatal circuits in Shank3B(-/-) mice. Nat. Neurosci. 2016;19:716–724. doi: 10.1038/nn.4260. [DOI] [PMC free article] [PubMed] [Google Scholar]
- 70.Savage J.C., St-Pierre M.-K., Carrier M., El Hajj H., Novak S.W., Sanchez M.G., Cicchetti F., Tremblay M.È. Microglial physiological properties and interactions with synapses are altered at presymptomatic stages in a mouse model of Huntington’s disease pathology. J. Neuroinflammation. 2020;17:98. doi: 10.1186/s12974-020-01782-9. [DOI] [PMC free article] [PubMed] [Google Scholar]
- 71.Tepper J.M., Sharpe N.A., Koós T.Z., Trent F. Postnatal development of the rat neostriatum: electrophysiological, light- and electron-microscopic studies. Dev. Neurosci. 1998;20:125–145. doi: 10.1159/000017308. [DOI] [PubMed] [Google Scholar]
- 72.Cline H.T. Dendritic arbor development and synaptogenesis. Curr. Opin. Neurobiol. 2001;11:118–126. doi: 10.1016/s0959-4388(00)00182-3. [DOI] [PubMed] [Google Scholar]
- 73.Johnson C.M., Peckler H., Tai L.-H., Wilbrecht L. Rule learning enhances structural plasticity of long-range axons in frontal cortex. Nat. Commun. 2016;7:10785. doi: 10.1038/ncomms10785. [DOI] [PMC free article] [PubMed] [Google Scholar]
- 74.McNeill T.H., Brown S.A., Rafols J.A., Shoulson I. Atrophy of medium spiny I striatal dendrites in advanced Parkinson’s disease. Brain Res. 1988;455:148–152. doi: 10.1016/0006-8993(88)90124-2. [DOI] [PubMed] [Google Scholar]
- 75.Ingham C.A., Hood S.H., Taggart P., Arbuthnott G.W. Plasticity of synapses in the rat neostriatum after unilateral lesion of the nigrostriatal dopaminergic pathway. J. Neurosci. 1998;18:4732–4743. doi: 10.1523/JNEUROSCI.18-12-04732.1998. [DOI] [PMC free article] [PubMed] [Google Scholar]
- 76.Kuo H.-Y., Yang Y.-H., Chen S.-Y., Kuo T.-H., Lin W.-T., Liu F.-C. Differential Development of dendritic spines in striatal projection neurons of direct and indirect pathways in the caudoputamen and nucleus accumbens. eNeuro. 2023;10 doi: 10.1523/ENEURO.0366-22.2023. ENEURO.0366-22.2023. [DOI] [PMC free article] [PubMed] [Google Scholar]
- 77.Rakic P., Bourgeois J.P., Eckenhoff M.F., Zecevic N., Goldman-Rakic P.S. Concurrent overproduction of synapses in diverse regions of the primate cerebral cortex. Science. 1986;232:232–235. doi: 10.1126/science.3952506. [DOI] [PubMed] [Google Scholar]
- 78.Wilton D.K., Dissing-Olesen L., Stevens B. Neuron-glia signaling in synapse slimination. Annu. Rev. Neurosci. 2019;42:107–127. doi: 10.1146/annurev-neuro-070918-050306. [DOI] [PubMed] [Google Scholar]
- 79.Choi S., Lovinger D.M. Decreased probability of neurotransmitter release underlies striatal long-term depression and postnatal development of corticostriatal synapses. Proc. Natl. Acad. Sci. USA. 1997;94:2665–2670. doi: 10.1073/pnas.94.6.2665. [DOI] [PMC free article] [PubMed] [Google Scholar]
- 80.Ding J., Peterson J.D., Surmeier D.J. Corticostriatal and thalamostriatal synapses have distinctive properties. J. Neurosci. 2008;28:6483–6492. doi: 10.1523/JNEUROSCI.0435-08.2008. [DOI] [PMC free article] [PubMed] [Google Scholar]
- 81.Suzuki S.C., Furue H., Koga K., Jiang N., Nohmi M., Shimazaki Y., Katoh-Fukui Y., Yokoyama M., Yoshimura M., Takeichi M. Cadherin-8 is required for the first relay synapses to receive functional inputs from primary sensory afferents for cold sensation. J. Neurosci. 2007;27:3466–3476. doi: 10.1523/JNEUROSCI.0243-07.2007. [DOI] [PMC free article] [PubMed] [Google Scholar]
- 82.Bradfield L.A., Balleine B.W. Thalamic control of dorsomedial striatum regulates internal state to guide goal-directed action selection. J. Neurosci. 2017;37:3721–3733. doi: 10.1523/JNEUROSCI.3860-16.2017. [DOI] [PMC free article] [PubMed] [Google Scholar]
- 83.Bradfield L.A., Leung B.K., Boldt S., Liang S., Balleine B.W. Goal-directed actions transiently depend on dorsal hippocampus. Nat. Neurosci. 2020;23:1194–1197. doi: 10.1038/s41593-020-0693-8. [DOI] [PubMed] [Google Scholar]
- 84.Sabbah S., Berg D., Papendorp C., Briggman K.L., Berson D.M. A Cre mouse line for probing irradiance- and direction-encoding retinal networks. eNeuro. 2017;4 doi: 10.1523/ENEURO.0065-17.2017. ENEURO.0065-17.2017. [DOI] [PMC free article] [PubMed] [Google Scholar]
- 85.Schindelin J., Arganda-Carreras I., Frise E., Kaynig V., Longair M., Pietzsch T., Preibisch S., Rueden C., Saalfeld S., Schmid B., et al. Fiji: an open-source platform for biological-image analysis. Nat. Methods. 2012;9:676–682. doi: 10.1038/nmeth.2019. [DOI] [PMC free article] [PubMed] [Google Scholar]
- 86.Rodriguez A., Ehlenberger D.B., Hof P.R., Wearne S.L. Rayburst sampling, an algorithm for automated three-dimensional shape analysis from laser scanning microscopy images. Nat. Protoc. 2006;1:2152–2161. doi: 10.1038/nprot.2006.313. [DOI] [PubMed] [Google Scholar]
- 87.Skarnes W.C., Rosen B., West A.P., Koutsourakis M., Bushell W., Iyer V., Mujica A.O., Thomas M., Harrow J., Cox T., et al. A conditional knockout resource for the genome-wide study of mouse gene function. Nature. 2011;474:337–342. doi: 10.1038/nature10163. [DOI] [PMC free article] [PubMed] [Google Scholar]
- 88.Beier K.T., Steinberg E.E., DeLoach K.E., Xie S., Miyamichi K., Schwarz L., Gao X.J., Kremer E.J., Malenka R.C., Luo L. Circuit architecture of VTA dopamine neurons revealed by systematic input-output mapping. Cell. 2015;162:622–634. doi: 10.1016/j.cell.2015.07.015. [DOI] [PMC free article] [PubMed] [Google Scholar]
- 89.Lee J.H., Durand R., Gradinaru V., Zhang F., Goshen I., Kim D.-S., Fenno L.E., Ramakrishnan C., Deisseroth K. Global and local fMRI signals driven by neurons defined optogenetically by type and wiring. Nature. 2010;465:788–792. doi: 10.1038/nature09108. [DOI] [PMC free article] [PubMed] [Google Scholar]
- 90.Arruda-Carvalho M., Wu W.-C., Cummings K.A., Clem R.L. Optogenetic examination of prefrontal-amygdala synaptic development. J. Neurosci. 2017;37:2976–2985. doi: 10.1523/JNEUROSCI.3097-16.2017. [DOI] [PMC free article] [PubMed] [Google Scholar]
- 91.Gundersen H.J., Bendtsen T.F., Korbo L., Marcussen N., Møller A., Nielsen K., Nyengaard J.R., Pakkenberg B., Sørensen F.B., Vesterby A. Some new, simple and efficient stereological methods and their use in pathological research and diagnosis. APMIS. 1988;96:379–394. doi: 10.1111/j.1699-0463.1988.tb05320.x. [DOI] [PubMed] [Google Scholar]
- 92.Fino E., Glowinski J., Venance L. Effects of acute dopamine depletion on the electrophysiological properties of striatal neurons. Neurosci. Res. 2007;58:305–316. doi: 10.1016/j.neures.2007.04.002. [DOI] [PubMed] [Google Scholar]
- 93.Matikainen-Ankney B.A., Kezunovic N., Mesias R.E., Tian Y., Williams F.M., Huntley G.W., Benson D.L. Altered development of synapse structure and function in striatum caused by Parkinson’s disease-linked LRRK2-G2019S Mutation. J. Neurosci. 2016;36:7128–7141. doi: 10.1523/JNEUROSCI.3314-15.2016. [DOI] [PMC free article] [PubMed] [Google Scholar]
- 94.Guevara C.A., Matikainen-Ankney B.A., Kezunovic N., LeClair K., Conway A.P., Menard C., Flanigan M.E., Pfau M., Russo S.J., Benson D.L., Huntley G.W. LRRK2 mutation alters behavioral, synaptic, and nonsynaptic adaptations to acute social stress. J. Neurophysiol. 2020;123:2382–2389. doi: 10.1152/jn.00137.2020. [DOI] [PMC free article] [PubMed] [Google Scholar]
- 95.Cummings K.A., Clem R.L. Prefrontal somatostatin interneurons encode fear memory. Nat. Neurosci. 2020;23:61–74. doi: 10.1038/s41593-019-0552-7. [DOI] [PMC free article] [PubMed] [Google Scholar]
- 96.Yuste R., Bonhoeffer T. Morphological changes in dendritic spines associated with long-term synaptic plasticity. Annu. Rev. Neurosci. 2001;24:1071–1089. doi: 10.1146/annurev.neuro.24.1.1071. [DOI] [PubMed] [Google Scholar]
Associated Data
This section collects any data citations, data availability statements, or supplementary materials included in this article.
Supplementary Materials
Data Availability Statement
All original code and example datasets have been deposited at GitHub and are publicly available. Any additional information required to reanalyze data in this paper is available from the lead contact upon request.