

Abstract
Magnetic resonance imaging (MRI) of focal or diffuse myelin damage or remyelination may provide important insights into disease progression and potential treatment efficacy in multiple sclerosis (MS). We performed post‐mortem MRI and histopathological myelin measurements in seven progressive MS cases to evaluate the ability of three myelin‐sensitive MRI scans to distinguish different stages of MS pathology, particularly chronic demyelinated and remyelinated lesions. At 3 Tesla, we acquired two different myelin water imaging (MWI) scans and magnetisation transfer ratio (MTR) data. Histopathology included histochemical stainings for myelin phospholipids (LFB) and iron as well as immunohistochemistry for myelin proteolipid protein (PLP), CD68 (phagocytosing microglia/macrophages) and BCAS1 (remyelinating oligodendrocytes). Mixed‐effects modelling determined which histopathological metric best predicted MWF and MTR in normal‐appearing and diffusely abnormal white matter, active/inactive, inactive, remyelinated and ischemic lesions. Both MWI measures correlated well with each other and histology across regions, reflecting the different stages of MS pathology. MTR data showed a considerable influence of components other than myelin and a strong dependency on tissue storage duration. Both MRI and histology revealed increased myelin densities in inactive compared with active/inactive lesions. Chronic inactive lesions harboured single scattered myelin fibres indicative of low‐level remyelination. Mixed‐effects modelling showed that smaller differences between white matter areas were linked to PLP densities and only to a small extent confounded by iron. MWI reflects differences in myelin lipids and proteins across various levels of myelin densities encountered in MS, including low‐level remyelination in chronic inactive lesions.
Keywords: histopathology, iron, MRI, MTR, multiple sclerosis, remyelination
1. INTRODUCTION
Multiple sclerosis (MS) is a chronic inflammatory disease of the central nervous system (CNS), leading to the formation of focal areas of destruction, phagocytosis and digestion of CNS myelin sheaths. Remyelination may follow demyelination [1], but the proportion of remyelinated MS lesions varies greatly between individuals at autopsy [2]. Fostering remyelination reduces axonal loss and may thus curtail MS progression [3], rendering it an important target of new therapeutic trials. Non‐invasive myelin quantification by means of magnetic resonance imaging (MRI) will be a key component of such trials [4]. Among the many MRI techniques for assessing myelin in vivo, multi‐echo spin‐echo T2 MWI [5, 6, 7, 8, 9] is considered one of the most myelin‐specific [10, 11, 12, 13] as it separately quantifies the MRI signal from water protons in the myelin phospholipid bilayers. The mobility of these protons is highly restricted, resulting in a faster T2 decay than water protons within axons, cell bodies and the extracellular space. The ratio of the short T2 signal component over the total water signal, termed myelin water fraction (MWF), is considered a surrogate measure of myelin content [5, 14].
Recently, active/inactive MS lesions have gained particular interest because of their chronic inflammatory activity [15] and propensity to accumulate iron at their edge in microglia and macrophages [16, 17]. This iron can be visualised using MRI, therefore serving as a biomarker for MS severity [18]. Several pathological [19, 20] and imaging studies [18, 21] have suggested an almost mutual exclusion or significantly lower frequency of remyelination in iron rim or active/inactive lesions, when compared with lesions without iron rims, which was attributed to inflammation. This scenario would serve to partially explain more severe disease in patients with rim lesions.
Here, we compared different MRI‐based myelin scans for the quantitation of myelin in seven progressive MS cases. MS lesions in various stages of de‐ and remyelination, with particular interest in active/inactive lesions, normal‐appearing and diffusely abnormal white matter (WM) were included and characterised with histopathology and MRI‐based myelin measures: 3D multi‐echo T2 gradient‐ and spin‐echo (GraSE) MWI [22], 3D multi‐echo spin‐echo MWI [23, 24] and 3D MTR [25]. Histopathology included Luxol Fast Blue (LFB) staining for phospholipids and diaminobenzidine‐enhanced Turnbull blue (TBB) staining for iron. In addition, immunohistochemical stainings for proteolipid protein (PLP), one of the major myelin proteins, CD68 for phagocytosing microglia/macrophages and BCAS1 staining for remyelinating oligodendrocytes were obtained [26].
2. MATERIALS AND METHODS
2.1. Post‐mortem samples
Seven post‐mortem brains of progressive MS patients (six with secondary‐progressive MS, one with primary‐progressive MS) were included. Whole brains had been fixed in 4% neutral‐buffered formalin for 3–4 weeks at room temperature. Four cases from the archive at the Neuroimmunology department of the Center for Brain Research, Medical University of Vienna (MUV), Austria, had been fixed in formalin and stored for 9–14 years in 1% formalin diluted in phosphate‐buffered saline (PBS) at 4°C. Three cases derived from the Division of Neuropathology and Neurochemistry, MUV, Austria, were fixed and stored in formalin for up to 1 year. Basic epidemiological and clinical data are provided in Table 1.
TABLE 1.
Relevant demographic information about the post‐mortem brain samples, including approximate time since fixation in years
| Age [years] | Sex | Clinical course | Disease duration [years] | Storage time in 1% PFA/PBS [years] | |
|---|---|---|---|---|---|
| Case 1 | 34 | M | SPMS | 10 | 10 |
| Case 2 | 41 | M | SPMS | 11.4 | 14 |
| Case 3 | 46 | F | SPMS | 37 | 9 |
| Case 4 | 67 | M | PPMS | 7.3 | 12 |
| Case 5 | 61 | F | SPMS | 33 | <1 |
| Case 6 | 52 | M | SPMS | 24 | <1 |
| Case 7 | 60 | F | SPMS | 34 | <1 |
Note: Causes of death were unrelated to multiple sclerosis (MS) and included myocardial infarction, cardiovascular death and pancreatic cancer. Post‐mortem interval times are unknown.
Abbreviations: M/F, male/female; PFA/PBS, paraformaldehyde/phosphate‐buffered saline; PPMS, primary‐progressive multiple sclerosis; SPMS, secondary‐progressive multiple sclerosis.
2.2. MRI data acquisition
For Cases 6 and 7, whole brains were available for MRI. Of all other cases, smaller tissue slabs were scanned. Their diameters ranged from 21.1 to 110.2 mm and their thickness from 4.2 to 23.8 mm. Scanning was performed on two identical 3T MRI systems (Philips Achieva, Best, The Netherlands) in 2015–2016; four cases at the University of British Columbia (UBC) and three cases at MUV. For all samples, we acquired 32‐echo 3D‐GraSE T2 data for MWI (TE/∆TE/TR = 10/10/719 ms, reconstructed 0.9 × 0.9 × 1.5 mm3 by use of overcontiguous slices) [22]. 3D‐MTR images were acquired for all cases, except Case 6 (TE/TR = 3.7/84.6 ms, reconstructed 0.9 × 0.9 × 2 mm3, flip angle(exc/mtc) = 18°/520°, sinc‐gaussian pulse shape, ∆f = 1.1 kHz below Larmor frequency, 16.5 ms duration). Data acquisition at UBC (Cases 1–4) also included 3D multi‐echo spin‐echo imaging [Carr–Purcell–Meiboom–Gill (CPMG), TE/∆TE/TR = 10/10/1200 ms, reconstructed 0.9 × 0.9 × 3 mm3] [23, 24]. Acquisition times varied by case, but CPMG acquisition times were on average twice as long as for the GraSE sequence. T2‐weighted images were acquired for registration purposes at TE/TR = 100 ms/2500 ms, 0.66 × 0.66 × 0.7 mm3. Acquisition parameters were minimally adapted to adjust for the different sample sizes. Only for Case 5, the 3D‐GraSE sequence was substantially changed necessitated by the much larger field‐of‐view. The study and tissue scanning protocol were approved by the clinical research ethics boards of both sites (UBC: H15‐011, MUV: EK No. 1491‐2017).
2.3. MRI data processing
Data processing and analysis were implemented in MATLAB 2017b. MWF was computed as previously described [5, 27]. Briefly, T2 distributions were obtained using the extended phase graph algorithm [28] and regularised, non‐negative least squares fitting. T2 distributions of all tissue samples in multiple WM regions were consulted. Subsequently, the MWF was determined as the T2 signal fraction between 12 and 25 ms relative to all water (intra‐/extra‐cellular water T2 range: 25–100 ms). MTR maps were calculated as the ratio of the signal difference between the on‐resonance and off‐resonance scan relative to the off‐resonance scan [25].
2.4. Tissue preparation
After scanning, whole‐brain cases were cut into 1 cm thick coronal double‐hemispheric slices. All other tissue slabs were directly processed for histology. Samples were dehydrated (Miles Scientific™ autotechnicon device) and embedded in paraffin. Paraffin blocks were cut into 10 μm thick serial sections with a tetrander microtome (R. Jung AG, Heidelberg).
Sections were stained for haematoxylin and eosin (H&E) to assess general pathology, Luxol fast blue–periodic‐acid Schiff (LFB‐PAS) to visualize myelin and classify MS lesions, and diaminobenzidine (DAB)‐enhanced TBB to detect iron [17]. Iron is stored in myelin‐forming oligodendrocytes and in the inner and outer loops of the myelin sheaths [29] and is a known confounder to MWI and MTR [30, 31, 32]. Immunohistochemistry for mouse monoclonal PLP (Serotec, MCA839G, dilution 1:1000) was performed by heat‐steaming sections in ethylenediaminetetraacetic acid (EDTA, pH 9.0, 1 h) for antigen retrieval. Unspecific antibody binding was blocked by incubation in 10% fetal calf serum (FCS) diluted in Dako wash buffer (DAKO, 20 min, room temperature). After overnight incubation at 4°C, a biotinylated donkey anti‐mouse secondary antibody was applied. Sections were then incubated with avidin‐conjugated horseradish peroxidase (Sigma Aldrich, dilution 1:500 in 10% FCS/DAKO, 1 h, room temperature) and developed with the chromogen DAB, producing a brown PLP signal. For CD68 (Dako, M0814, Clone KP1, dilution 1:2000) and BCAS1 (Santa Cruz, sc‐136342, dilution 1:4000), sections were steamed in TRIS buffer (pH 6.0, 1 h). Primary antibodies were applied overnight at 4°C. After the application of an appropriate biotinylated secondary anti‐mouse antibody, the Envision system was used according to the manufacturer's protocol. Stainings were visualised by DAB development for 2 × 5 min, producing a brown reaction product. Stainings were scanned using an Agfa Duoscan® device under standardised brightness conditions, at 800 pixels/inch, and saved as RGB TIFF.
2.5. MRI to Histology registration
Figure 1 provides an overview of the MRI‐histology registration procedure. Histology images were downsampled by a factor of two along both dimensions. LFB‐PAS and PLP sections were colour‐deconvolved using ImageJ version 1.43r (A.C. Ruifrok, NIH, Bethesda, MD) to extract the blue channel, that is, the LFB dye, of the LFB‐PAS double‐stained sections and the red channel, that is, the DAB dye, of the haematoxylin‐counterstained PLP sections. Because mounting the sections on glass slides can introduce small 2D distortions, TBB and PLP were registered to the LFB section using 2D FSL FLIRT [33] (default parameters, five degrees‐of‐freedom). Initial registrations utilised sections prior to colour‐deconvolution. Registration matrices were then applied to the lower‐contrast, colour‐deconvolved sections (Figure 1A).
FIGURE 1.
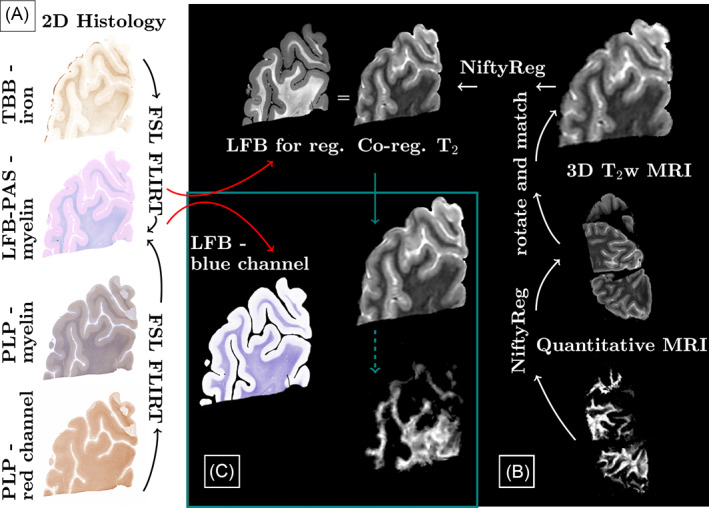
Overview of processing pipeline. Differently stained histology sections were aligned with 2D FSL FLIRT. To register all quantitative images, first a pipeline was established based on the 3D T2 scans, which were reoriented and resliced to match the histology. Registration between histology and magnetic resonance imaging (MRI) was performed using NiftyReg. Quantitative maps were then registered to the 3D T2 and the already established pipeline and registration matrices were applied
Within‐MRI and histology‐MRI registrations were performed using NiftyReg's Aladin and f3d (default parameters) [34]. To approximate the resolutions, MR images were zero‐padded to half the voxel size in‐plane and to that same voxel size through‐plane. Histology images were down‐sampled by a factor of 6.5 for the co‐registration. This factor was varied if co‐registration results were visually deemed to be of insufficient quality (factor range 6–8.5). T2‐weighted MRIs were then reoriented and sliced to match the histology section plane (Figure 1B). Manual corrections, such as removal of tissue from unrelated sections, were performed for all cases individually prior to co‐registration. Lastly, registered images were up‐sampled to match the histology resolution (Figure 1C). MRI data were sent to the histology space to avoid altering the regions‐of‐interest (ROIs), which were manually defined on the histology sections in FSLview. For the quantitative analysis, all 3D MRIs were registered to the T2‐weighted images. Linear registrations were performed using individual echoes of the quantitative data (default parameters). Subsequently, quantitative maps were transformed using NiftyReg's resample and were then subjected to the same pipeline as the T2‐weighted images, that is, volume re‐orientation, slice selection and mapping to histology (Figure 1B).
2.6. Manual ROI definition
ROIs were identified by microscopical inspection of H&E, LFB‐PAS and PLP‐stained slices using an Olympus BX50® microscope by two readers (VE, SH). Non‐lesional normal‐appearing white matter (NAWM) was identified by well‐preserved myelin in both LFB‐PAS and PLP stainings. Diffusely abnormal white matter (DAWM) had ill‐defined areas of LFB‐PAS but no PLP reduction [35]. Lesional WM included active/inactive (AcInL), inactive lesions (InaL), shadow plaques (SdP) and ischemic lesions (IsL). Active/inactive lesions had few LFB‐ and PLP‐positive myelin degradation products within phagocytes at the lesion borders, while their centres were almost completely devoid of myelin in the PLP and LFB stainings. Macrophages in the active/inactive lesion cores were LFB‐negative and frequently harbored PAS‐positive material. Inactive lesions occasionally showed PAS‐positive macrophages, but no LFB‐ or PLP‐positive myelin remnants within phagocytes anywhere. Shadow plaques displayed sharp borders of LFB‐myelin reduction, resulting from thinner remyelinating sheaths, and evenly distributed intact myelin throughout the plaque. We further encountered circumscribed lesions of myelin reduction but not depletion, similar to shadow plaques. However, these lesions had ill‐defined borders and increased LFB intensity around blood vessels traversing the lesions, that is, a non‐homogenous LFB‐intensity reduction within the lesion. Their coarse texture indicated pronounced widening of the extracellular spaces. Some amount of astrogliosis with perivascular accentuation could be found in the H&E stainings, as well as hyalinisation of vessel walls. These were labelled ischemic lesions. However, territorial infarction was not encountered in any of the cases in our sample. ROIs were manually outlined on the LFB‐PAS images. Anatomical and pathological boundaries were generously spared. To account for small differences in slice matching and imperfect registration, the masks were adapted to optimally match the TBB and PLP scans and the registered T2‐weighted MRI. CD68 stainings were qualitatively evaluated for the distinction between active/inactive (CD68 rim of microglia/macrophages present) and inactive (no CD68 rim present) lesions. BCAS1 stainings were evaluated with a counting grid in NAWM, DAWM and centres of active/inactive, inactive and remyelinated lesions. The evaluated area covered 1 mm, equivalent to four neighbouring visual fields at 20× magnification. Only clearly and strongly BCAS1‐positive glial cells were counted.
2.7. Data analysis
ROIs were automatically matched using their voxel location and the classification assigned to each ROI. We applied bwconncomp, a region‐detection algorithm in MATLAB, to correlate histological and MRI values in all ROIs. Grey‐scale medians for each ROI were calculated in all MRI and histological images, representative of each ROI's myelin state.
2.8. Statistical analysis
Differences between active/inactive and inactive lesions were assessed by a two‐sided rank sum test (5% significance level). Correlations were performed on a per‐case basis to suppress the influence of varying post‐mortem delays, formalin fixation and storage times.
Weighted average within‐case slopes, intercepts and p values were obtained, with weights represented by the variance of the individual within‐section slopes, intercepts and correlation coefficients, respectively. Average correlation coefficients were determined by transforming the r values using Fisher's z‐transformation and subsequently computing the hyperbolic tangent of the average of the transformed r values. Finally, a linear mixed effects regression model was used in R to determine the standardised correlation coefficients as a measure of relative importance of LFB, PLP, TBB and storage time in predicting MWF and MTR (lm.beta package) [36]. The data offset was modelled with two random factors that accounted for inter‐ and intra‐subject variability. Collinearity between predictors was evaluated using the vif function [37]. BCAS1 count differences were tested using an ANCOVA with ROI as fixed factor and slice ID as random factor to correct for multiple data points being derived from each case.
3. RESULTS
Matching MRI and histology data, we obtained 27 section planes from the seven MS cases. GraSE MWF data of Case 5 were excluded because of unexpectedly low contrast, presumably related to changes in acquisition (increased slice thickness to accommodate a larger number of slices). One section from Case 6 was also excluded because of unreliable GraSE MWF signal, likely resulting from too low flip angles in this area of the brain.
All cases showed pathological alterations typical of progressive MS, including DAWM, active/inactive and inactive lesions as well as remyelinated shadow plaques. Classical active lesions were not observed. Major confounding pathology was noted in Case 7, which harboured ischemic lesions together with severely atherosclerotic large meningeal arteries. Only lesions of either clear ischemic or MS origin were analyzed. In total, 610 ROIs were outlined (median size 5.69 mm2, range: 0.14 –32.09 mm2). Figure 2 shows matched MRI and histology with corresponding ROIs from four MS cases (Figure 2A–D).
FIGURE 2.
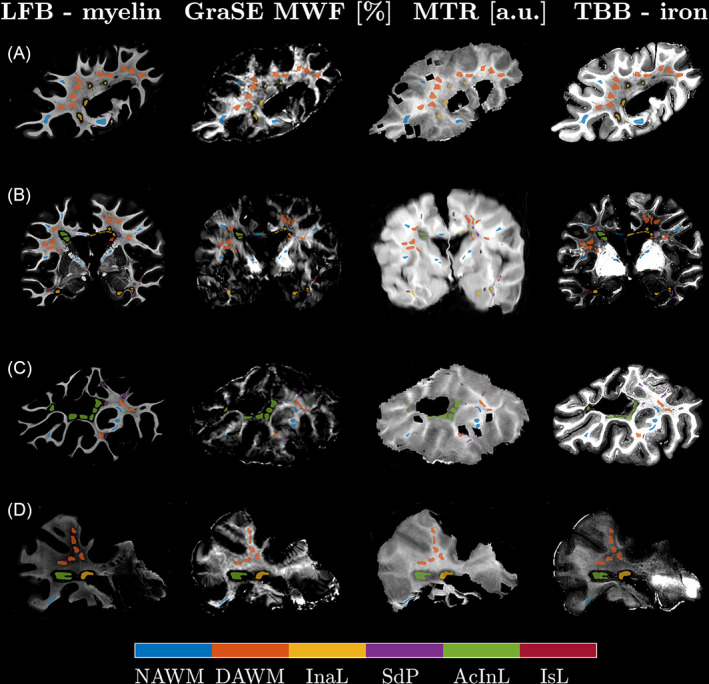
Qualitative comparison of the histology and co‐registered MRI data for four sections from four cases (A: Case 4, B: Case 7, C: Case 1, D: Case 2). The histological images were contrast‐inverted to visually match the magnetic resonance imaging (MRI) contrasts so that lower intensities represent lower myelin or iron concentrations. Co‐registration achieved good matching of the MRI to the LFB stains, which were chosen as histology reference. Region of interests (ROIs) were centred in representative regions, yielding good local correspondence of ROIs on visual inspection. The ROIs were drawn with a gap to avoid partial volume effects at anatomical or lesion borders. AcInL, active/inactive lesions; DAWM, diffusely abnormal WM; InaL, inactive lesions; IsL, ischemic lesions; NAWM, normal‐appearing WM; SdP, shadow plaques
Histological stainings of one section of Case 7 are exemplified in Figure 3. Figure 3A and corresponding enlargements (Figure 3C,D) display accumulation of activated microglia and macrophages at an active/inactive but not at an inactive lesion edge. TBB staining (Figure 3B,E,F) showed matching iron accumulation only at the edge of the active/inactive lesion. NAWM was predominantly found in subcortical WM areas, since the progressive MS cases displayed typical widespread diffuse myelin injury in deep WM areas (Figure 3G, black arrows). Inactive, but not active/inactive lesions, harboured scattered thin myelin sheaths in their centres (compare Figure 3I,J). BCAS1 staining (Figure 3H) showed the highest cell densities in peri‐plaque WM close to the rim of active/inactive lesions (Figure 3K), but on average hardly any positive cells in the lesion cores. A subset of inactive lesions, however, displayed clustered positive cells in the lesion centre (Figure 3L). Upon morphological evaluation of BCAS1+ cells, we noted that one portion of positive cells had strong cytoplasmic immunoreactivity, and either absent or very short and dystrophic‐appearing processes. This type of BCAS1+ cell morphology was found in NAWM, DAWM and was most prominent in periplaque WM close to active/inactive lesions (Figure 3K). Conversely, BCAS1+ cells in inactive and remyelinated lesion cores had multiple, partly parallel processes (Figure 3L).
FIGURE 3.
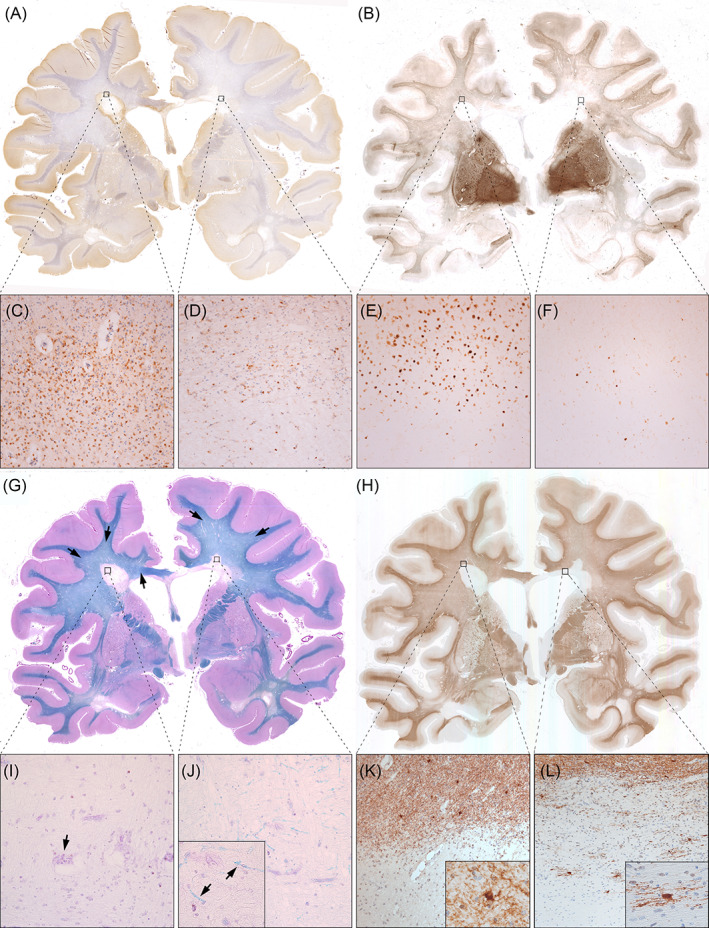
Histological sections of a double‐hemispheric coronal slice level of Case 7. (A) CD68 immunohistochemistry revealed accumulated activated microglia and macrophages at the edge of an active/inactive periventricular lesion (left black square, enlarged in C), but not at the inactive periventricular lesion edge (right black square, enlarged in D). (B) Similarly, TBB staining showed iron accumulation at the active/inactive (E), but not at the inactive lesions edge (F). Both lesions had iron loss in their centres. In WM, iron staining was highest subcortically, gradually decreased in DAWM and towards lesions, and was lowest within lesion centres. (G) Luxol fast blue–periodic‐acid Schiff (LFB‐PAS) myelin staining visually distinguished areas of normal‐appearing white matter (NAWM) (mainly subcortically and in the capsula interna), diffusely abnormal white matter (DAWM) and multiple sclerosis (MS) lesions. Black arrows indicate the ill‐defined DAWM, characterised by reduced myelin intensity. Both periventricular MS lesions (enlarged in I and J) showed myelin loss. Notably, scattered thin myelin sheaths were present within some inactive lesion centres (J, high magnification inset with arrows), but never in active/inactive lesions (I). Occasional macrophages with PAS‐positive cytoplasmic inclusions, indicative of remote demyelination, were found. (H) BCAS1 immunohistochemistry revealed moderate immunoreactivity in myelin, rendering exquisite histological myelin contrast. Strongly BCAS1‐positive glial cells without processes and dystrophic morphology accumulated in areas of WM damage, such as DAWM (see quantitative data) and WM abutting active/inactive lesion edges (K). Process‐bearing actively remyelinating oligodendrocytes could be found exclusively in few inactive lesions (L) and shadow plaques
Ischemic lesions were reminiscent of shadow plaques regarding their myelin densities but differed morphologically. Shadow plaques were characterised by a sharp border and homogeneously thin myelin sheaths in the plaque area. By contrast, ischemic lesions showed a gradient of myelin intensity, including ill‐defined borders, as well as a coarse lesion tissue texture with loss of whole myelin fibres, but preservation of normal myelin sheath thickness in the remaining fibres.
3.1. Comparison of MRI‐based myelin estimates
Figure 4A displays the regression between GraSE and CPMG MWF (R 2 = 0.863, slope = 0.858%/%, intercept = −0.42% MWF), which demonstrated excellent agreement of these two myelin water scans. However, the regression of CPMG MWF and MTR was insignificant (Figure 4C, R 2 < 0.01). Note that CPMG data were only acquired in samples with storage times longer than 9 years. The MTR – GraSE MWF relationship was modelled by two different, storage time‐dependent regression lines (Figure 4B). GraSE MWF and MTR correlated significantly in tissue blocks with storage times of <1 year (R 2 = 0.523), but not in those with extended storage times (R 2 < 0.01). Notably, the regression intercepts in all correlations with MTR were different from zero. In cases stored <1 year, the intercept for GraSE MWF and MTR was 19.3 a.u. In cases with extended storage, the intercepts were 14.2 a.u. and 14.5 a.u., when comparing GraSE MWF and CPMG MWF with MTR, respectively.
FIGURE 4.
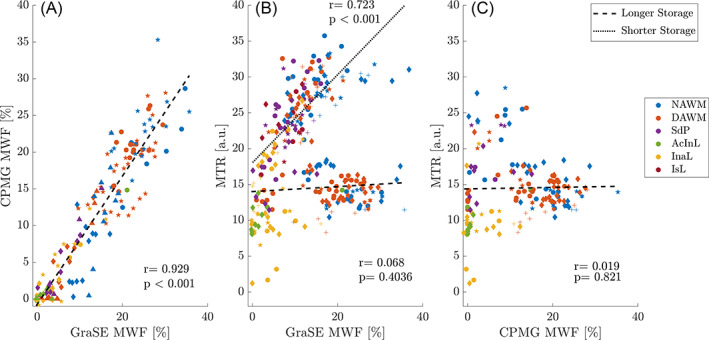
Correlation of all MRI metrics. Both myelin water fraction (MWF) estimates showed excellent agreement with a minimal intercept (A), whereas correlations between MWF and magnetisation transfer ratio (MTR) depended on storage times (B,C). Correlations between MWF and MTR were significant in tissues with storage times of <1 year (dotted line) and were non‐significant for tissues with extended storage time >9 years (dashed line). Note that CPMG data were only available for samples with extended storage time (C). Symbols indicate different cases; colours distinguish different tissue types. AcInL, active/inactive lesions; DAWM, diffusely abnormal WM; InaL, inactive lesions; IsL, ischemic lesions; NAWM, normal‐appearing WM; SdP, shadow plaques
3.2. Histological and MRI‐based myelin measurements in different ROIs
Figure 5 displays the stratification of histological optical densities and MRI data according to ROI. WM LFB (Figure 5A) and PLP (Figure 5C) optical densities were highest in NAWM, followed by DAWM, shadow plaques and inactive lesions, and were lowest in active/inactive lesions. LFB and PLP densities in ischemic lesions resembled those of shadow plaques. In contrast to LFB, PLP hardly differed between NAWM and DAWM. Iron was lower in DAWM compared to NAWM, and markedly depleted in active/inactive and inactive lesions (Figure 5E). In shadow plaques, iron densities ranged between the densities of DAWM and demyelinated lesions. Few high NAWM iron densities were derived from Case 1.
FIGURE 5.
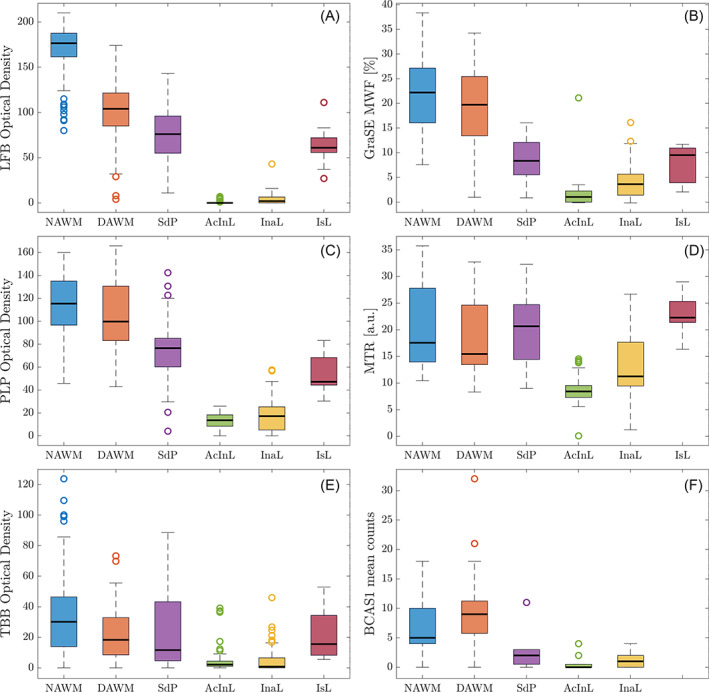
Comparison of quantitative MRI values and optical densities across regions of interest. Panels on the left display the histological density measurements [LFB (A), PLP (C), TBB (E)], panels on the right the magnetic resonance imaging (MRI) myelin measurements (GraSE myelin water fraction (MWF) (B), magnetisation transfer ratio (MTR) (D)). Panel F displays the separately obtained BCAS1 counts. LFB and proteolipid protein (PLP) differences between region of interests (ROIs), including in lesions, were well reflected in both MWF measurements. By contrast, MTR changes appeared more closely linked to the Turnbull Blue (TBB) staining intensities and MTR values overlapped between regions. Note that the data collection for Carr–Purcell–Meiboom–Gill (CPMG) and MTR were incomplete, thus not all ROIs are present in the MTR plot. AcInL, active/inactive lesions; DAWM, diffusely abnormal WM; InaL, inactive lesions; IsL, ischemic lesions; NAWM, normal‐appearing WM; SdP, shadow plaques
Of all MRI metrics (Figure 5B,D, CPMG data not shown), relative differences in GraSE MWF between ROIs closely matched LFB and PLP intensity distributions (Figure 5A,C). All myelin MRI metrics were reduced in DAWM compared to NAWM, although less so than LFB. MWF in all WM lesions was lower than in NAWM or DAWM. In shadow plaques and ischemic lesions, MWF was between active/inactive lesions and DAWM, reflecting LFB and PLP relations. By contrast, MTR in shadow plaques exceeded NAWM MTR. All three MRI measures yielded higher values in inactive compared to active/inactive lesions, sensitively reflecting histological myelin data. After Bonferroni correction, LFB (p < 0.001), GraSE MWF (p = 0.016) and MTR (p < 0.001) were significantly higher in inactive compared to active/inactive lesions. BCAS1 counts, indicative of the number of actively remyelinating oligodendrocytes, were in line with the observations from LFB and MWF (Figure 5F). The number of BCAS1+ cells in lesion areas was generally lower than counts in NAWM and DAWM. Active/inactive lesions had, on average, lower BCAS1+ counts than inactive lesions and shadow plaques, although the difference was not statistically significant (p = 0.987). However, significantly more BCAS1‐positive cells were found in DAWM compared to NAWM (p < 0.001).
Per‐case correlations and average correlation coefficients (data not shown) between the MRI metrics and stainings reflect the findings of Figures 4 and 5, that is, good correlations between myelin MRI metrics and myelin stainings (median R 2 LFB‐MRI = [0.45–0.63], PLP‐MRI = [0.35–0.69]), albeit with a non‐zero intercept in correlations with MTR. Exemplarily, Figure 6 presents the GraSE MWF versus LFB correlations. Note that MWF and MTR varied between cases and that sections only containing NAWM and DAWM but no lesions exhibited typically insignificant, flat correlations.
FIGURE 6.
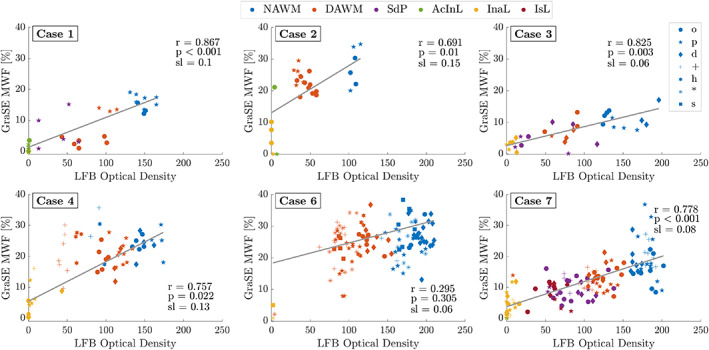
Within‐case correlations between LFB and GraSE MWF across all ROIs. In order to suppress between‐section deviations, all correlations shown are weighted averages of the individual within‐section correlations. Different symbols distinguish data from different sections of a case. Different colours indicate the different region of interest (ROI) types. The slopes of the average correlations ranged from 0.06% to 0.15% MWF per optical density unit. All correlations were significant. Case 5 is not shown as the GraSE data were deemed unreliable for analysis. AcInL, active/inactive lesions; DAWM, diffusely abnormal WM; InaL, inactive lesions; IsL, ischemic lesions; NAWM, normal‐appearing WM; SdP, shadow plaques
Despite moderate to strong correlation coefficients across different tissue classes, within tissue class correlations were substantially weaker. To determine the extent to which LFB, PLP and TBB, in combination, predict the MRI metrics within specific tissue classes, we applied a linear mixed effects model. Time since fixation was added as a fixed effect to account for differences in the MRI metrics related to storage time. Table 2 summarizes the significant contributors that were determined in the regression model. BCAS1 data were not included as they were separately obtained and analyzed.
TABLE 2.
Linear mixed‐effects model ANOVA predictors of MRI myelin measurements
| GraSE MWF | CPMG MWF | MTR | |
|---|---|---|---|
| Normal‐appearing WM (NAWM) |
PLP p = 0.002 (β = 0.543) TBB p = 0.052 (β = −0.198) |
Time p = 0.010 (β = 0.732) | Time p = 0.020 (β = −0.506) |
| Diffusely abnormal WM (DAWM) |
PLP p < 0.001 (β = 0.534) TBB p = 0.020 (β = −0.227) |
Time p < 0.001 (β = 0.857) |
PLP p < 0.001 (β = 0.233) LFB p = 0.003 (β = 0.174) TBB p = 0.016 (β = −0.132) |
| Time β = −0.346 | |||
| Shadow Plaques (SdP) |
PLP p = 0.062 (β = 0.582) Time p = 0.070 (β = −0.409) |
– | LFB p = 0.059 (β = 0.192) |
|
Time β = 0.148 TBB β = −1.076 | |||
| Active/Inactive lesions (AcInL) | – | PLP p = 0.091 (β = 0.408) | LFB p < 0.001 (β = 0.489) |
| PLP β = 0.511 |
LFB β = −2.65 Time β = 2.656 |
||
| Inactive lesions (InaL) | LFB p = 0.084 (β = 0.255) | LFB p = 0.063 (β = 0.544) | Time p = 0.002 (β = −0.626) |
| Time β = 0.890 | |||
| Ischemic lesions (IsL) | – | N/A | – |
| TBB β = 0.423 | PLP β = 0.587 |
Note: Unadjusted p values are reported together with their relative importance coefficients. Values reported in bold font are p < 0.05, non‐bolded values reflect p values between 0.05 and 0.1. If no significant factor was reported by the ANOVA or the largest β‐coefficient did not correspond to the significant entry, the highest importance factor is listed in grey in the second half of the respective cell.
Abbreviations: CPMG, Carr–Purcell–Meiboom–Gill; GraSE, gradient and spin‐echo; MTR, magnetisation transfer ratio; MWF, myelin water fraction; PLP, proteolipid protein.
PLP significantly explained variations in NAWM and DAWM GraSE MWF, while CPMG MWF and MTR were strongly influenced by tissue storage time. TBB significantly related to DAWM GraSE MWF and MTR. Similar to NAWM, MRI myelin values in shadow plaques were predicted by PLP, storage time and in part LFB.
In line with the above‐described differences between inactive and active/inactive lesions, the mixed effects model revealed some association between LFB and MWF in inactive, but not in active/inactive lesions. The latter only showed a dependency for MTR on LFB.
Standardised regression coefficients, that is, the amount of change that a variation in each of the predictor variables yields in the MRI‐measured myelin values, are provided together with the p values in Table 2.
4. DISCUSSION
We assessed the ability of three myelin‐sensitive MRI techniques to differentiate various degrees of myelin damage, recovery and lesional activity in a larger sample of progressive MS cases.
Using histochemical and immunohistochemical stainings for myelin, we showed low levels of myelin in completely inactive lesions, which was captured by the myelin imaging modalities applied here. Conversely, active/inactive lesions were almost completely devoid of myelin in all of our different myelin quantifications. We suggest that the weak myelin signal in inactive lesions may represent remyelination occurring in chronic MS lesions with neither microglia/macrophages nor iron rims. These low myelin levels were conspicuous in the high magnification of the histological stainings and captured by all investigated myelin‐sensitive MRI techniques and in part corroborated by BCAS1 stainings. Such mutual exclusion of iron rims or rims of active/inactive lesions and remyelination has previously been suggested by others [19, 21]. In addition, pathological work has clearly demonstrated a virtual absence of oligodendrocytes and remyelination in active/inactive lesions, which was not the case in completely inactive lesions [38]. Although myeloid cells may accomplish demyelination and axonal degeneration [39, 40, 41] at the rims of active/inactive lesions, the inflammatory and anti‐remyelinative activity in active/inactive lesions seems to be driven by interferon‐gamma secreting CD4 T‐cells [20]. Importantly, our data showed that BCAS1‐positivity is not exclusively a marker of remyelinating oligodendrocytes, but that it also marks degenerating glial cells in DAWM and in the vicinity of chronic active lesion edges.
Overall, the pronounced difference between active/inactive and chronic inactive lesions that we described here suggests that detecting and following subtle remyelination in vivo in chronic lesions may provide an additional avenue for assessing repair in MS and may be a relevant consideration for trials of remyelinating therapies, which typically are believed to be most efficacious in younger MS lesions.
4.1. Comparison of MWF, MTR and histopathological metrics
The excellent agreement of CPMG and GraSE MWF (R 2 = 0.863) corroborates in vivo comparisons [22]. We attributed the two different relationships of MWF with MTR to storage time. MTR in NAWM is known to decrease with formaldehyde fixation [42], likely because of fixation effects on T1 relaxation [42, 43], but longer‐term pH changes may also affect MTR similar to other off‐resonance techniques [44]. Storage‐related MTR shifts were most pronounced in NAWM and DAWM (up to 20 a.u.) and much larger than the difference in intercept. Between cases, acquisition differences and differences in iron content affected MTR. Increased TR results in MTR reductions [45], while strong WM iron depletion significantly increases MTR [17, 31, 32]. More work is warranted to understand the dependency of MTR on storage duration after formalin fixation.
Independently, non‐zero regression intercepts between MTR and LFB, PLP and the MWI metrics indicate that MTR reflects not only myelin lipids and proteins but also other tissue characteristics [46], despite being correlated with high R 2 (R 2 = 0.63 and 0.69, respectively). Although MTR is widely used to detect de‐ and re‐myelination [47], other non‐aqueous tissue components, such as axonal and glial cell membranes, soluble proteins in the extracellular space, and astrocytic and axonal densities also play a role [48]. Inflammation and edema further confound the specificity of MTR [49, 50], while MWF remains relatively unchanged [50, 51]. Note the large overlap in MTR across different tissue types and the relatively high MTR in active/inactive and inactive lesions, resulting from the non‐zero intercept.
Limitations of earlier MWI approaches [5, 23], such as small field‐of‐view and long acquisition times, have been overcome by introducing the 3D GraSE sequence [22]. However, the now widely used GraSE‐MWI approach has never been histopathologically validated. Previous MWF histopathological comparisons focused on LFB intensities [8] and recently, electron microscopy validated CPMG‐MWI in rat spinal cord samples [9]. We assessed myelin more broadly, including lipids as well as myelin proteins and iron to explain variations in MWF [35], with CD68 and BCAS1 for further validation. Gradient echoes in the GraSE sequence may make MWF more susceptible to static field inhomogeneities. However, in agreement with other work [31], we did not observe differences between GraSE and CPMG MWF, although TBB contributed to the prediction of GraSE MWF in some regions (Table 2). Iron was highly variable between cases in the present study, with low tissue iron concentrations possibly resulting from long disease durations in progressive cases [17].
Relative differences in MWF between tissues agreed well with the differences in LFB and PLP stainings, including in lesions. This demonstrates the excellent sensitivity of MRI‐based myelin imaging to the detection of different stages or degrees of de‐ or remyelination, despite low lesional myelin concentrations. Integrating different stainings in a multi‐linear regression showed that both myelin lipid and protein concentrations are needed to predict variations within tissue classes, such as within DAWM or between different shadow plaques. Notably, LFB and PLP explained much greater variation in MWF than TBB.
4.2. Active/inactive and inactive lesions
Differently from active/inactive lesions [19], inactive lesions do not have a rim of degradation products, but both are typically described as relatively free of myelin‐containing macrophages, microglial activation, and inflammation in their lesion centres [52]. By contrast, we observed non‐zero MWF and MTR in inactive lesions and found few, thin myelin sheaths in LFB sections, not seen in active/inactive lesions (Figure 3). LFB and both MWF and MTR showed consistently higher levels in inactive compared to active/inactive lesions.
Our findings agree with post‐mortem work showing significantly higher MTR in remyelinated compared to demyelinated lesions, but not in inactive compared to active/inactive lesions [48]. Moreover, in vivo susceptibility and myelin imaging demonstrated that rim lesions have less myelin than inactive lesions [53]. Most of these studies attributed the lower signal to the greater destructiveness of active/inactive lesions. However, both active/inactive and inactive lesions may contain BCAS1+ premyelinating oligodendrocytes, indicating the ability of both lesion types to remyelinate [26]. It is believed that while the rim of activated microglia and macrophages exists, it may prevent lesional myelin recovery [19, 21]. Our data suggest that inactive lesions, for which the rim has resolved, start to recover some thin myelin sheaths to a degree that the lipid signal can be detected on histological stainings and with myelin‐sensitive MRI techniques.
Thus, it may be possible to capture varying degrees of late remyelination also in vivo using MRI. All these observations warrant further investigation to better characterize the difference between active/inactive and inactive lesions.
Notably, our data suggest that BCAS1+ also stains degenerating glial cells. This is supported by the BCAS1+ cell morphology in areas of DAWM and periplaque WM, where cells had either no or short and twisted dystrophic processes. In line with this interpretation, dystrophic oligodendrocytes harbouring alpha‐synuclein inclusions in Multiple System Atrophy, a neurodegenerative disease with oligodendroglial pathology [54], frequently showed BCAS1 positivity with a lack of processes. By contrast, in few areas within inactive or partly remyelinated lesions many BCAS1+ cells had extensive branches and formed processes to multiple internodes, yielding a morphology reminiscent of that described for PLP‐positive myelinating oligodendrocytes [55]. However, this was only found in a few lesions and might relate to the transient nature of remyelination. Conversely, it might relate to the finding that in humans remyelination might be accomplished by mature oligodendrocytes [56] rather than oligodendrocyte progenitor cells. Nevertheless, oligodendrocyte progenitor cells are still discussed in the literature as the source of remyelination, at least in animal models [57]. In this respect, mature oligodendrocytes were almost completely absent from centres of active/inactive lesions, while some could be detected in centres of completely inactive lesions [38].
4.3. Normal appearing and diffusely abnormal WM, shadow plaques and ischemic lesions
Lower LFB but similar PLP signal between DAWM and NAWM (Figure 5) agrees with the lipid abnormality characteristic of DAWM [35]. Interestingly, our mixed effects model suggested that more subtle differences within NAWM and DAWM GraSE MWF relate to differing PLP concentrations. TBB also played a role in distinguishing subtle differences between NAWM and DAWM regions, in line with the importance of iron for myelin production in oligodendrocytes and previously described iron loss in DAWM [58]. Given the widespread diffuse injury, NAWM ROIs were confined to subcortical regions. These areas are more likely to be affected by misregistration errors, possibly explaining why the MRI‐measured NAWM‐DAWM difference was smaller than expected from their LFB intensities. It should be noted that NAWM and DAWM are typically MRI‐based concepts [59, 60, 61], however, we used histopathology here to identify these tissue areas. Thus, NAWM in our study is closer to truly normal WM and regions of DAWM might not correspond to the diffusely abnormal regions typically identified on proton density‐weighted images.
CPMG and MTR were predominantly related to storage time or a combination of predicting factors.
Shadow plaques and ischemic lesions were well reflected in GraSE MWF, but both lesion types had higher MTR than NAWM and DAWM. This may again relate to the inverse relationship between MTR and iron concentrations [30, 32]. Note that our shadow plaques yielded non‐zero TBB staining, although they have been generally found to remyelinate without iron recovery [17]. Regardless, myelin‐related regression coefficients for GraSE MWF in shadow plaques were noticeably larger than the TBB coefficients, indicating that iron plays a minor role in the estimation of MWF in shadow plaques. No specific histopathological factor predicted MWF or MTR of ischemic lesions.
4.4. Study strengths and limitations
We tested how myelin lipids, proteins and iron contribute to MWF and MTR. We demonstrated the sensitivity of these myelin imaging techniques on a case‐by‐case basis, in addition to providing validation of the GraSE sequence for MWI. Across cases, we utilised mixed effects modelling to provide a combined assessment of the role of lipids, proteins and iron to the MRI measures, rather than assessing them in isolation. Although potentially relevant for MTR [48], we did not stain for axonal density because of its strong collinearity with myelin. Collinearity in linear models can bias the regression coefficients and result in large standard deviations. Moreover, transmission electron microscopy work [9] and the lack of correlation between MWF and the T1w/T2w ratio [62] indicate that axonal density is much less likely to impact MWF. Assessing gliosis and inflammation, however, may shed further light on the observed lesional differences. Including such additional predictors requires to further increase in the sample size. BCAS1 staining was performed separately to support our initial findings. Dedicated sample selection to investigate specific tissue classes or class differences would be advantageous but was beyond the scope of the work presented here. Finally, although our study assessed the differential impact that LFB, PLP and TBB appear to have on MWF and MTR, the mechanisms of how lipids, proteins and iron exactly contribute to MWF and MTR remain to be elucidated.
Our investigation included MTR [6], rather than quantitative magnetisation transfer [48], as MTR is more frequently used, both in clinical trials and research. Assessing other techniques, for example, T2*‐based myelin mapping [7, 63], and in particular MTsat [64, 65] or inhomogeneous MT [66, 67], which can alleviate some of the T1‐bias in MTR, may be of interest in the future. Although other MRI techniques may have advantages over traditional MWI acquisitions, including potentially faster acquisition times [6], higher spatial resolution [68], improved signal‐to‐noise ratio and lower specific absorption rates, they are also known to be influenced by axonal water [12], magnetisation transfer effects [11, 49, 69] or to suffer phase errors because of field inhomogeneities and physiological noise [70, 71]. Current MWI approaches [14, 28] also have the advantage of being model‐free, and new developments may alleviate limitations in scan time and spatial resolution [72]. It should be noted that the different sequences investigated here used slightly different spatial resolutions, and some used slice interpolation. However, the sequences were generally set up as used in clinical research studies, with the exception of using higher spatial resolution in order to achieve better correspondence with histology.
In conclusion, both MWI strategies, the original CPMG and the faster GraSE acquisition, as well as MTR reflected the histologically assessed myelin concentrations across tissues and allowed to detect subtle within‐tissue class differences. Notably, the range of MWF and MTR values observed in inactive lesions appeared to reflect variable degrees of late, slowly progressing remyelination.
AUTHOR CONTRIBUTIONS
Vanessa Wiggermann: Acquisition and analysis of data, manuscript drafting. Verena Endmayr: Acquisition and analysis of data. Enedino Hernández‐Torres: Acquisition and analysis of data. Romana Höftberger: Acquisition and analysis of data. Gregor Kasprian: Acquisition and analysis of data. Simon Hametner: Acquisition and analysis of data, manuscript drafting. Alexander Rauscher: Conception and design of study, manuscript drafting.
FUNDING INFORMATION
This study was supported by the Research Methodology Grant from the BC Children's Hospital Research (former CFRI) and funding from the National multiple sclerosis Society (RG‐1507‐05301). Vanessa Wiggermann was supported by a graduate student award from the Multiple Sclerosis Society of Canada (EGID 2002). Verena Endmayr was supported by funding from the National Multiple Sclerosis Society (RG‐1507‐05301). Enedino Hernández‐Torres was supported by Consejo Nacional de Ciencia y Tecnologia (237961). We are grateful for additional support from NSERC (402039‐2011, 2016‐05371), CIHR (RN382474‐418628) and the Milan and Maureen Ilich Foundation. Alexander Rauscher is supported by Canada Research Chairs (950‐230363).
CONFLICT OF INTEREST
The authors have no conflicts to disclose related to the manuscript. Romana Höftberger has received speaker honoraria from Euroimmun, Novartis and Biogen.
ETHICS STATEMENT
The study and tissue scanning protocol were approved by the clinical research ethics boards of the University of British Columbia (UBC), #H15‐011, and the Medical University of Vienna (MUV), #1491–2017.
ACKNOWLEDGEMENTS
The authors wish to thank Marianne Leisser for supporting the histological analysis at the Medical University of Vienna, and Professor Hans Lassmann for allowing them to use tissue from the multiple sclerosis brain bank for this work. We wish to acknowledge the continued research support by Philips Healthcare.
Wiggermann V, Endmayr V, Hernández‐Torres E, Höftberger R, Kasprian G, Hametner S, et al. Quantitative magnetic resonance imaging reflects different levels of histologically determined myelin densities in multiple sclerosis, including remyelination in inactive multiple sclerosis lesions. Brain Pathology. 2023;33(6):e13150. 10.1111/bpa.13150
Simon Hametner and Alexander Rauscher contributed equally to this study.
DATA AVAILABILITY STATEMENT
The data that support the findings of this study are available from the corresponding author upon reasonable request.
REFERENCES
- 1. Goldschmidt T, Antel J, König FB, Brück W, Kuhlmann T. Remyelination capacity of MS brain decreases with disease chronicity. Neurology. 2009;72(22):1914–21. [DOI] [PubMed] [Google Scholar]
- 2. Patrikios P, Stadelmann C, Kutzelnigg A, Rauschka H, Schmidbauer M, Laursen H, et al. Remyelination is extensive in a subset of multiple sclerosis patients. Brain. 2006;129(12):3165–72. [DOI] [PubMed] [Google Scholar]
- 3. Stankoff B, Jadasz JJ, Hartung HP, Küry P, Zalc B, Lubetzki C. Repair strategies for multiple sclerosis: challenges, achievements and perspectives. Curr Opin Neurol. 2016;29(3):286–92. [DOI] [PubMed] [Google Scholar]
- 4. Oh J, Ontaneda D, Azevedo C, Klawiter EC, et al. Imaging outcome measures of neuroprotection and repair in MS. Neurology. 2019;92(11):519–33. [DOI] [PMC free article] [PubMed] [Google Scholar]
- 5. MacKay A, Whittall K, Adler J, Li D, et al. In vivo visualization of myelin water in brain by magnetic resonance. Magn Reson Med. 1994;31(6):673–7. [DOI] [PubMed] [Google Scholar]
- 6. Nguyen TD, Wisnieff C, Cooper MA, Kumar D, Raj A, Spincemaille P, et al. T2prep three‐dimensional spiral imaging with efficient whole brain coverage for myelin water quantification at 1.5 tesla. Magn Reson Med. 2012;67(3):614–21. [DOI] [PubMed] [Google Scholar]
- 7. Alonso‐Ortiz E, Levesque IR, Pike GB. MRI‐based myelin water imaging: a technical review. Magn Reson Med. 2015;73(1):70–81. [DOI] [PubMed] [Google Scholar]
- 8. Laule C, Leung E, Li DKB, Traboulsee A, et al. Myelin water imaging in multiple sclerosis: quantitative correlations with histopathology. Mult Scler. 2006;12(6):747–53. [DOI] [PubMed] [Google Scholar]
- 9. Chen HS, Holmes N, Liu J, Tetzlaff W, et al. Validating myelin water imaging with transmission electron microscopy in a rat spinal cord injury model. Neuroimage. 2017;153:122–30. [DOI] [PubMed] [Google Scholar]
- 10. Schmierer K, Scaravilli F, Altmann DR, Barker GJ, Miller DH. Magnetization transfer ratio and myelin in postmortem multiple sclerosis brain. Ann Neurol. 2004;56:407–15. [DOI] [PubMed] [Google Scholar]
- 11. Zhang J, Kolind SH, Laule C, MacKay AL. How does magnetization transfer influence mcDESPOT results? Magn Reson Med. 2015a;74(5):1327–35. [DOI] [PubMed] [Google Scholar]
- 12. Chang EH, Argyelan M, Aggarwal M, Chandon TSS, Karlsgodt KH, Mori S, et al. The role of myelination in measures of white matter integrity: combination of diffusion tensor imaging and two‐photon microscopy of CLARITY intact brains. Neuroimage. 2017;147:253–61. [DOI] [PMC free article] [PubMed] [Google Scholar]
- 13. Pareto D, Garcia‐Vidal A, Alberich M, Auger C, Montalban X, Tintoré M, et al. Ratio of T1‐weighted to T2‐weighted signal intensity as a measure of tissue integrity: comparison with magnetization transfer ratio in patients with multiple sclerosis. Am J Neuroradiol. 2020;41(3):461–3. [DOI] [PMC free article] [PubMed] [Google Scholar]
- 14. Whittall KP, MacKay AL, Graeb DA, Nugent RA, Li DK, Paty DW. In vivo measurement of T2 distributions and water contents in normal human brain. Magn Reson Med. 1997;37(1):34–43. [DOI] [PubMed] [Google Scholar]
- 15. Zrzavy T, Hametner S, Wimmer I, Butovsky O, Weiner HL, Lassmann H. Loss of ‘homeostatic’ microglia and patterns of their activation in active multiple sclerosis. Brain. 2017;140(7):1900–13. [DOI] [PMC free article] [PubMed] [Google Scholar]
- 16. Bagnato F, Hametner S, Yao B, van Gelderen P, Merkle H, Cantor FK, et al. Tracking iron in multiple sclerosis: a combined imaging and histopathological study at 7 Tesla. Brain. 2011;134(Pt 12):3602–15. [DOI] [PMC free article] [PubMed] [Google Scholar]
- 17. Hametner S, Wimmer I, Haider L, Pfeifenbring S, Brück W, Lassmann H. Iron and neurodegeneration in the multiple sclerosis brain. Ann Neurol. 2013;74(6):848–61. [DOI] [PMC free article] [PubMed] [Google Scholar]
- 18. Rahmanzadeh R, Galbusera R, Lu P‐J, et al. A new advanced MRI biomarker for remyelinated lesions in multiple sclerosis. Ann Neurol. 2022;93(3):486–502. [DOI] [PMC free article] [PubMed] [Google Scholar]
- 19. Dal‐Bianco A, Grabner G, Kronnerwetter C, Weber M, et al. Slow expansion of multiple sclerosis iron rim lesions: pathology and 7 T magnetic resonance imaging. Acta Neuropathol. 2017;133(1):25–42. [DOI] [PMC free article] [PubMed] [Google Scholar]
- 20. Starost L, Linder M, Herold M, et al. Extrinsic immune cell‐derived, but not intrinsic oligodendroglial factors contribute to oligodendroglial differentiation block in multiple sclerosis. Acta Neuropathol. 2020;140(5):715–36. [DOI] [PMC free article] [PubMed] [Google Scholar]
- 21. Absinta M, Sati P, Schindler M, Leibovitch EC, Ohayon J, Wu T, et al. Persistent 7‐tesla phase rim predicts poor outcome in new multiple sclerosis patient lesions. J Clin Invest. 2016;126(7):2597–609. [DOI] [PMC free article] [PubMed] [Google Scholar]
- 22. Prasloski T, Rauscher A, MacKay AL, Hodgson M, Vavasour IM, Laule C, et al. Rapid whole cerebrum myelin water imaging using a 3D GRASE sequence. Neuroimage. 2012;63(1):533–9. [DOI] [PubMed] [Google Scholar]
- 23. Kolind SH, Mädler B, Fischer S, Li DK, et al. Myelin water imaging: implementation and development at 3.0T and comparison to 1.5T measurements. Magn Reson Med. 2009;62(1):106–15. [DOI] [PubMed] [Google Scholar]
- 24. Mädler B, MacKay AL. In‐vivo 3D multi‐component T2‐relaxation measurements for quantitative myelin imaging at 3T. Proc Intl Soc Mag Reson Med. 2006;14:2112. [Google Scholar]
- 25. Finelli DA, Hurst GC, Amantia P Jr, Gullapali RP, Apicella A. Cerebral white matter: technical development and clinical applications of effective magnetization transfer (MT) power concepts for high‐power, thin‐section, quantitative MT examinations. Radiology. 1996;199:219–26. [DOI] [PubMed] [Google Scholar]
- 26. Fard MK, van der Meer F, Sánchez P, Cantuti‐Castelvetri L, et al. BCAS1 expression defines a population of early myelinating oligodendrocytes in multiple sclerosis lesions. Sci Transl Med. 2017;9(419):eaam7816. [DOI] [PMC free article] [PubMed] [Google Scholar]
- 27. Wiggermann V, Vavasour IM, Kolind SH, MacKay AL, Helms G, Rauscher A. Non‐negative least squares computation for in vivo myelin mapping using simulated multi‐echo spin‐echo T2 decay data. NMR Biomed. 2020;33(12):e4277. [DOI] [PubMed] [Google Scholar]
- 28. Prasloski T, Mädler B, Xiang Q‐S, MacKay A, Jones C. Applications of stimulated echo correction to multicomponent T2 analysis. Magn Reson Med. 2012b;67(6):1803–14. [DOI] [PubMed] [Google Scholar]
- 29. Meguro R, Asano Y, Odagiri S, Li C, Shoumura K. Cellular and subcellular localizations of nonheme ferric and ferrous iron in the rat brain: a light and electron microscopic study by the perfusion‐Perls and ‐Turnbull methods. Arch Histol Sytol. 2008;71(4):205–22. [DOI] [PubMed] [Google Scholar]
- 30. Langkammer C, Krebs N, Goessler W, Scheurer E, Yen K, Fazekas F, et al. Susceptibility induced gray‐white matter MRI contrast in the human brain. Neuroimage. 2012;59(2):1413–9. [DOI] [PMC free article] [PubMed] [Google Scholar]
- 31. Birkl C, Birkl‐Toeglhofer AM, Endmayr E, Höftberger R, Kasprian G, Krebs C, et al. The influence of brain iron on myelin water imaging. Neuroimage. 2019;199:545–52. [DOI] [PMC free article] [PubMed] [Google Scholar]
- 32. Birkl C, Birkl‐Toeglhofer AM, Kames C, Goessler W, Haybaeck J, Fazekas F, et al. The influence of iron oxidative state on quantitative MRI parameters in post mortem human brain. Neuroimage. 2020;220:117080. [DOI] [PubMed] [Google Scholar]
- 33. Jenkinson M, Bannister P, Brady JM, Smith SM. Improved optimization for the robust and accurate linear registration and motion correction of brain images. Neuroimage. 2002;17(2):825–41. [DOI] [PubMed] [Google Scholar]
- 34. Modat M, Cash DM, Daga P, Winston GP, Duncan JS, Ourselin S. Global image registration using a symmetric block‐matching approach. J Med Imaging. 2014;1(2):024003. [DOI] [PMC free article] [PubMed] [Google Scholar]
- 35. Laule C, Pavlova V, Leung E, Zhao G, MacKay AL, Kozlowski P, et al. Diffusely abnormal white matter in multiple sclerosis: further histologic studies provide evidence for a primary lipid abnormality with neurodegeneration. J Neuropathol Exp Neurol. 2013;72(1):42–52. [DOI] [PubMed] [Google Scholar]
- 36. Vittinghoff E, Glidden DV, Shiboski SC, McCulloch CE. Regression methods in biostatistics: linear, logistic, survival, and repeated measures models. Berlin, Germany: Springer Science & Business Media; 2005. p. 75. [Google Scholar]
- 37. Lin D, Foster DP, Ungar LH. VIF‐regression: a fast regression algorithm for large data. J Am Stat Assoc. 2011;106(493):232–47. [Google Scholar]
- 38. Heß K, Starost L, Kieran NW, Thomas C, Vincenten MCJ, Antel J, et al. Lesion stage‐dependent causes for impaired remyelination in MS. Acta Neuropathol. 2020;140(3):359–75. [DOI] [PMC free article] [PubMed] [Google Scholar]
- 39. Dal‐Bianco A, Schranzer R, Grabner G, Lanzinger M, et al. Iron rims in patients with multiple sclerosis as neurodegenerative marker? A 7‐tesla magnetic resonance study. Front Neurol. 2021;12:632749. [DOI] [PMC free article] [PubMed] [Google Scholar]
- 40. Dal‐Bianco A, Grabner G, Kronnerwetter C, Weber M, et al. Long‐term evolution of multiple sclerosis iron rim lesions in 7 T MRI. Brain. 2021;144(3):833–47. [DOI] [PubMed] [Google Scholar]
- 41. Maggi P, Kuhle J, Schädelin S, van der Meer F, et al. Chronic white matter inflammation and serum neurofilament levels in multiple sclerosis. Neurology. 2021;97(6):e543–53. [DOI] [PMC free article] [PubMed] [Google Scholar]
- 42. Schmierer K, Wheeler‐Kingshott CAM, Tozer DJ, Boulby PA, Parkes HG, Yousry TA, et al. Quantitative magnetic resonance of post‐mortem multiple sclerosis brain before and after fixation. Magn Reson Med. 2008;59(2):268–77. [DOI] [PMC free article] [PubMed] [Google Scholar]
- 43. Birkl C, Langkammer C, Golob‐Schwarzl N, Leoni M, Haybaeck J, Goessler W, et al. Effects of formalin fixation and temperature on MR relaxation times in the human brain. NMR Biomed. 2016;29(4):458–65. [DOI] [PubMed] [Google Scholar]
- 44. Ward KM, Balaban RS. Determination of pH using water protons and chemical exchange dependent saturation transfer (CEST). Magn Reson Med. 2000;44(5):799–802. [DOI] [PubMed] [Google Scholar]
- 45. Helms G, Dathe H, Dechent P. Modeling the influence of TR and excitation flip angle on the magnetization transfer ration (MTR) in human brain obtained from 3D spoiled gradient echo MRI. Magn Reson Med. 2010;64(1):177–85. [DOI] [PubMed] [Google Scholar]
- 46. West K, Kelm ND, Carson RP, Gochberg DF, Ess KC, Does MD. Myelin volume fraction imaging with MRI. Neuroimage. 2018;182:511–21. [DOI] [PMC free article] [PubMed] [Google Scholar]
- 47. Chen JT, Kuhlmann T, Jansen GH, Collins DL, Atkins HL, Freedman MS, et al. Voxel‐based analysis of the evolution of magnetization transfer ratio to quantify remyelination and demyelination with histopathological validation in a multiple sclerosis lesion. Neuroimage. 2007;36(4):1152–8. [DOI] [PubMed] [Google Scholar]
- 48. Schmierer K, Tozer DJ, Scaravilli F, Altmann DR, Barker GJ, Tofts PS, et al. Quantitative magnetization transfer imaging in postmortem multiple sclerosis brain. Magn Reson Med. 2007;26(1):41–51. [DOI] [PMC free article] [PubMed] [Google Scholar]
- 49. Vavasour IM, Laule C, Li DKB, Traboulsee AL, MacKay AL. Is the magnetization transfer ratio a marker for myelin in multiple sclerosis? J Magn Reson Imaging. 2011;33(3):710–8. [DOI] [PubMed] [Google Scholar]
- 50. Gareau PJ, Rutt BK, Karlik SJ, Mitchell JR. Magnetization transfer and multicomponent T2 relaxation measurements with histopathologic correlation in an experimental model of MS. J Magn Reson Imaging. 2000;11(6):586–95. [DOI] [PubMed] [Google Scholar]
- 51. Vavasour IM, Chang KL, Combes AJE, Meyers SM, Kolind SH, Rauscher A, et al. Water content changes in new multiple sclerosis lesions have a minimal effect on the determination of myelin water fraction values. J Neuroimaging. 2021;31(6):1119–25. [DOI] [PubMed] [Google Scholar]
- 52. Kornek B, Storch MK, Weissert R, Wallstroem E, Stefferl A, Olsson T, et al. Multiple sclerosis and chronic autoimmune encephalomyelitis: a comparative quantitative study of axonal injury in active, inactive, and remyelination lesions. Am J Pathol. 2000;157(1):267–76. [DOI] [PMC free article] [PubMed] [Google Scholar]
- 53. Yao T, Nguyen TD, Pandya S, Zhang Y, Hurtado Rúa S, Kovanlikaya I, et al. Combining quantitative susceptibility mapping with automatic zero reference (QSM0) and myelin water fraction imaging to quantify iron‐related myelin damage in chronic active MS lesions. Am J Neuroradiol. 2018;39(2):303–10. [DOI] [PMC free article] [PubMed] [Google Scholar]
- 54. Kaji S, Maki T, Ueda J, Ishimoto T, Inoue Y, Yasuda K, et al. BCAS1‐positive immature oligodendrocytes are affected by the α‐synuclein‐induced pathology of multiple system atrophy. Acta Neuropathol Commun. 2020;8(1):120. [DOI] [PMC free article] [PubMed] [Google Scholar]
- 55. Chang A, Staugaitis SM, Dutta R, Batt CE, et al. Cortical remyelination: a new target for repair therapies in multiple sclerosis. Ann Neurol. 2012;72(6):918–26. [DOI] [PMC free article] [PubMed] [Google Scholar]
- 56. Yeung MSY, Djelloul M, Steiner E, Bernard S, et al. Dynamics of oligodendrocyte generation in multipe sclerosis. Nature. 2019;566(7745):538–42. [DOI] [PMC free article] [PubMed] [Google Scholar]
- 57. Neumann B, Baror R, Zhao C, Segel M, et al. Metformin restores CNS remyelination capacity by rejuvenating aged stem cells. Cell Stem Cell. 2019;25(4):473–85. [DOI] [PMC free article] [PubMed] [Google Scholar]
- 58. Bagnato F, Hametner S, Boyd E, et al. Unentangling the R2* contrast in multiple sclerosis: a combined MRI‐histology study at 7.0 tesla. PLoS One. 2018;13(3):e0193839. [DOI] [PMC free article] [PubMed] [Google Scholar]
- 59. Zhao GJ, Li DKB, Cheng Y, Wang XY, Paty DW. MRI dirty‐appearing white matter in MS (abstract). Neurology. 2000;54(Suppl 3):A121. [Google Scholar]
- 60. Ge Y, Grossman RI, Babb JS, He J, Mannon LJ. Dirty‐appearing white matter in multiple sclerosis: volumetric MR imaging and magnetization transfer ratio histogram analysis. Am J Neuroradiol. 2003;24:1935–40. [PMC free article] [PubMed] [Google Scholar]
- 61. Allen IV, McQuaid S, Mirakhur M, Nevin G. Pathological abnormalities in the normal‐appearing white matter in multiple sclerosis. Neurol Sci. 2001;22:141–4. [DOI] [PubMed] [Google Scholar]
- 62. Arshad M, Stanley JA, Raz N. Test‐retest reliability and concurrent validity of in vivo myelin content indices: myelin water fraction and calibrated T1w/T2w image ratio. Hum Brain Mapping. 2017;38(4):1780–90. [DOI] [PMC free article] [PubMed] [Google Scholar]
- 63. Lee J, Nam Y, Choi JY, Kim EY, Oh SH, Kim DH. Mechanisms of T2* anisotropy and gradient echo myelin water imaging. NMR Biomed. 2017;30:e3513. [DOI] [PubMed] [Google Scholar]
- 64. Helms G, Dathe H, Kallenberg K, Dechent P. High‐resolution maps of magnetization trasfer with inherent correction for RF inhomogeneity and T1 relaxation obtained from 3D FLASH MRI. Magn Reson Med. 2008;60(6):1396–407. [DOI] [PubMed] [Google Scholar]
- 65. Rahmanzadeh R, Weigel M, Lu P‐J, Melie‐Garcia L, et al. A comparative assessment of myelin‐sensitive measures in multiple sclerosis patients and healthy subjects. NeuroImage Clin. 2022;36:103177. [DOI] [PMC free article] [PubMed] [Google Scholar]
- 66. Van Obberghen E, Mchinda S, le Troter A, Prevost VH, et al. Evaluation of the sensitivity of inhomogeneous magnetization transfer (ihMT) MRI for multiple sclerosis. Am J Neuroradiol. 2018;39(4):634–41. [DOI] [PMC free article] [PubMed] [Google Scholar]
- 67. Hertanu A, Soustelle L, Buron J, Le Priellec J, et al. T1D‐weighted ihMT imaging—part II. Investigating the long‐ and short‐T1D components correlation with myelin content. Comparison with R1 and the macromolecular proton fraction. Magn Reson Med. 2022;87(5):2329–46. [DOI] [PubMed] [Google Scholar]
- 68. Ouellette R, Mangeat G, Polyak I, Warntjes M, et al. Validation of rapid magnetic resonance myelin imaging in multiple sclerosis. Ann Neurol. 2020;87(5):710–24. [DOI] [PubMed] [Google Scholar]
- 69. West DJ, Teixeria RP, Wood TC, Hajnal JV, et al. Inherent and unpredictable bias in multi‐component DESPOT myelin water fraction estimation. Neuroimage. 2019;195:78–88. [DOI] [PMC free article] [PubMed] [Google Scholar]
- 70. Nam Y, Kim DH, Lee J. Physiological noise compensation in gradient‐echo myelin water imaging. Neuroimage. 2015;120:345–9. [DOI] [PubMed] [Google Scholar]
- 71. Alonso‐Ortiz E, Levesque IR, Paquin R, Pike GB. Field inhomogeneity correction for gradient echo myelin water fraction imaging. Magn Reson Med. 2017;78(1):49–57. [DOI] [PubMed] [Google Scholar]
- 72. Dvorak AV, Wiggermann V, Gilbert G, Vavasour IM, et al. Multi‐spin echo T2 relaxation imaging with compressed sensing (METRICS) for rapid myelin water imaging. Magn Reson Med. 2020;84(3):1264–79. [DOI] [PubMed] [Google Scholar]
Associated Data
This section collects any data citations, data availability statements, or supplementary materials included in this article.
Data Availability Statement
The data that support the findings of this study are available from the corresponding author upon reasonable request.