

Abstract
Previous studies of human traumatic brain injury (TBI) have shown diffuse axonal injury as varicosities or spheroids in white matter (WM) bundles when using immunoperoxidase‐ABC staining with 22C11, a mouse monoclonal antibody against amyloid precursor protein (APP). These findings have been interpreted as TBI‐induced axonal pathology. In a mouse model of TBI however, when we used immunofluorescent staining with 22C11, as opposed to immunoperoxidase staining, we did not observe varicosities or spheroids. To explore this discrepancy, we performed immunofluorescent staining with Y188, an APP knockout‐validated rabbit monoclonal that shows baseline immunoreactivity in neurons and oligodendrocytes of non‐injured mice, with some arranged‐like varicosities. In gray matter after injury, Y188 intensely stained axonal blebs. In WM, we encountered large patches of heavily stained puncta, heterogeneous in size. Scattered axonal blebs were also identified among these Y188‐stained puncta. To assess the neuronal origin of Y188 staining after TBI we made use of transgenic mice with fluorescently labeled neurons and axons. A close correlation was observed between Y188‐stained axonal blebs and fluorescently labeled neuronal cell bodies/axons. By contrast, no correlation was observed between Y188‐stained puncta and fluorescent axons in WM, suggesting that these puncta in WM did not originate from axons, and casting further doubt on the nature of previous reports with 22C11. As such, we strongly recommend Y188 as a biomarker for detecting damaged neurons and axons after TBI. With Y188, stained axonal blebs likely represent acute axonal truncations that may lead to death of the parent neurons. Y188‐stained puncta in WM may indicate damaged oligodendrocytes, whose death and clearance can result in secondary demyelination and Wallerian degeneration of axons. We also provide evidence suggesting that 22C11‐stained varicosities or spheroids previously reported in TBI patients might be showing damaged oligodendrocytes, due to a cross‐reaction between the ABC kit and upregulated endogenous biotin.
Keywords: amyloid beta, argyrophilic staining, axonopathy, brain trauma, Fluoro‐jade dyes, intracranial hemorrhage
The knockout‐validated antibody Y188 against APP (C‐terminus) can detect TBI‐induced pathology including axonal blebs in gray matter, and punctate and perivascular staining in white matter, but the widely used N‐terminal antibody 22C11 cannot. We also showed increased staining for endogenous biotin after TBI, which will be recognized by ABC when immunoperoxidase staining is performed. Therefore, previous studies demonstrating axonal pathology in TBI patients by 22C11 immunoperoxidase‐ABC staining might be a result of misinterpretation and thus needs to be revisited.

1. INTRODUCTION
Traumatic brain injury (TBI) is a leading cause of morbidity and mortality, especially in age groups from adolescence to early adulthood [1]. A major pathological consequence of TBI is neurodegeneration in key structures including the cortex and hippocampus, manifested as diffuse axonal injury (DAI; [2, 3, 4]), neuronal loss, and cognitive impairment [5, 6], which may evolve into chronic dementia as in Alzheimer's or Parkinson's diseases (see [7] for a review). Research aimed at mitigating this progression depends on identifying biomarkers for neurodegeneration at the early stage of TBI when preventing the transition of primary injury into more serious secondary damage might still be possible. Immunohistochemical staining with a mouse monoclonal antibody (Clone 22C11) against the amyloid precursor protein (APP) has been widely used to detect axonal pathology, which includes intensely stained varicosities or spheroids in white matter (WM) bundles, at time points as early as 3 h after TBI [7, 8, 9, 10, 11, 12, 13, 14, 15, 16].
APP immunostaining has long been considered the “Gold‐standard” for detecting TBI‐induced axonal injury [7, 12], although 22C11‐stained varicosities or spheroids may not be specific to TBI since similar staining has been reported in brain samples from patient controls [10, 14, 17]. It has also been suggested that APP‐stained varicosities or spheroids may represent the injury‐induced interruption of anterograde axonal transport and reflect APP accumulation and swelling in damaged axons [7]. However, the existing evidence remains insufficient to determine the axonal identity of these varicosities or spheroids. In many previous studies using tissue from TBI patients, 22C11 staining was performed using the immunoperoxidase‐ABC protocol; thereby making double labeling with 22C11 and axonal markers impractical and complicating efforts to verify the axonal identity of 22C11‐stained structures [7, 8, 9, 10, 11, 13, 14, 15, 16, 17]. A recent study did employ double immunofluorescent staining [12], but produced contradictory findings: a portion of 22C11 staining demonstrated colocalization with staining for the axonal protein SNTF (spectrin N‐terminal fragment) in tissue from patients with severe TBI, but samples from a swine model of TBI exhibited notably little colocalization between 22C11 and axonal SNTF staining. Taken together, these findings raise questions regarding the cellular origin of the structures stained by 22C11.
In the present study, we tested the suitability of 22C11 staining as a method to reveal neuropathology in mice subjected to lateral fluid percussion injury (lFPI), a well‐established mouse model for TBI [5, 6, 18, 19, 20]. Immunofluorescent staining was performed in order to enhance the contrast in brain slices and to allow for subsequent double staining to assess the cellular identity of 22C11‐positive structures. Unexpectedly, our immunofluorescent staining failed to show the 22C11‐positive varicosities and/or spheroids that previous studies have identified in TBI patients using the immunoperoxidase‐ABC technique [8, 9, 15, 16]. A review of the literature suggested that 22C11 might not be specific to APP, since 22C11 staining has also been reported in APP gene knockout mice [21, 22]. By contrast, the rabbit monoclonal Y188 has been validated with brains from transgenic knockout mice and therefore is APP‐specific [21, 22]. Therefore, we performed immunofluorescent staining in parallel with Y188 and 22C11 to compare APP immunoreactivity between naïve and lFPI mice. Immunoperoxidase‐ABC staining with biotinylated secondary antibodies was also performed with Y188 or 22C11, to provide a better comparison to previous studies using immunoperoxidase‐ABC staining in tissue from TBI patients [8, 9, 15, 16]. The possibility that endogenous biotin might confound the detection of biotinylated secondary antibodies was also assessed since this small molecule has been detected in many regions of the brain [23, 24].
2. MATERIALS AND METHODS
2.1. Mice
In the present study, we used four colonies of male mice at 8 weeks old from Jackson Laboratory (Bar Harbor, ME): C57/B6; B6.Cg‐Tg (Thy1‐YFP) HJrs/J (or YFP); PV‐CRE;tdTomato+/− (or PV/Tomato) and B6.129S7‐APP tm 1Dbo/J (or APP knockout). The procedures and protocols for all animal studies were approved by Institutional Animal Care and Use Committees of Children's Hospital of Philadelphia and University of Pennsylvania, in accordance with international guidelines on the ethical use of animals [25].
To get YFP mice that express eYFP in projecting (excitatory) neurons including cortical and hippocampal pyramidal cells, hemizygous for Tg(Thy1‐YFP)HJrs (JAX stock 003782) were back‐crossed with non‐carrier mice of C57/B6J, which is predicted to produce half of the offspring as hemizygous (YFP carrier). Genotyping was performed by checking a small piece of fresh tissue out of the ear auricle from P21 to adulthood under a fluorescent microscope [26], confirmed by our PCR genotyping (data not shown). The microscopic genotyping is based on the notion that trigeminal nuclei harbor YFP‐expressing neurons in the hemizygotes [27] and these trigeminal neurons give rise to YFP‐labeled axons to the targets (including the ear). To produce PV/Tomato mice that express tdTomato in parvalbumin‐positive (inhibitory) interneurons, PV‐CRE transgenic mice (129P2Pvalbtm1(cre)Arbr/J; Jackson Laboratory, JAX stock 008069) were crossed with tdTomato reporter mice (129S6‐Gt(ROSA)26Sorm14(CAG‐tdTomato)Hze/J; Jackson Laboratory, JAX stock 007908). These breeder pairs would produce all offspring as PV/Tomato heterozygous and thus, no genotyping was needed. APP knockout mice (Homozygous; [28]) and their wild‐type controls were genotyped by and directly received from Jackson laboratory.
2.2. PCR genotyping of YFP mice
To confirm the microscopic genotyping of YFP mice, PCR genotyping was performed in the first breeding pairs and some of their offspring. After genomic DNA was extracted from the tail, PCR was set using 2 pairs of primers (Transgene forward: ACA GAC ACA CAC CCA GGA CA and reverse: CGG TGG TGC AGA TGA ACT T; Internal positive control forward: CTA GGC CAC AGA ATT GAA AGA TCT and reverse: GTA GGT GGA AAT TCT AGC ATC ATC C), as suggested by Jackson Labs. The PCR reaction was catalyzed by Taq DNA Polymerase from Thermus aquaticus (Catalog #: D1806; Sigma‐Aldrich). After running SeaKem LE agarose gel (1.5% in TAE; Lonza USA, Morristown, NJ), digital photos of ladder and genomic DNA bands were acquired with Image Lab System (Bio‐Rad).
2.3. Lateral fluid percussion injury
We employed our model of lFPI to produce TBI in the rodent. Lateral FPI was conducted as established in our protocol [19, 20], but with a higher‐pressure setting. In brief, on day 1 a parietal craniectomy on the right side was performed in mice anaesthetized with ketamine (10 mg/100 g body weight) and xylazine (1 mg/100 g). A Luer‐loc needle hub (3 mm inner diameter) was secured above the skull opening with cyanoacrylate adhesive and dental acrylic. On day 2 the hub was filled with saline and connected via high‐pressure tubing to the LFPI device (Department of Biomedical Engineering, Virginia Commonwealth University, Richmond, VA), consisting of a fluid‐filled cylinder with a moveable piston at one end and a Luer fitting at the other. The piston end is adjacent to a pendulum which is raised to the height needed to deliver the desired pressure when the pendulum is released and strikes the piston. The Luer fitting on the injury device is connected via tubing to the Luer hub on the mouse. Close injury was produced by a brief pressure pulse established when the pendulum strikes the piston, and delivered via saline‐filled tubing to the dura. A mild lFPI mouse model has been established in our laboratory by delivering a pressure pulse of approximately 1.8–2.1 atm [6, 19, 20]. Since preliminary experiments showed unstable and less pathological staining after injury by 1.8–2.1 atm, we raised the impact to 2.6–2.7 atm. We also noticed that mice rarely survive an impact of 3.0 atm or more. Compared to 1.5–5 min of righting time in the lFPI 1.8 atm group [6], the lFPI 2.6–2.7 atm mice demonstrated a righting time of 5–15 min. The term “lFPI” used in the present study refers to lFPI 2.6 atm group, except for those cases denoted as “lFPI 1.8 atm.” Injured mice with gross tissue damage visible to the naked eye (such as open injury or brain herniation beyond the craniectomy window) were excluded from the present study. Sham animals received all the above procedures except the fluid pulse. However, we would mainly use naïve mice as a more stringent negative controls for injured tissue, considering that subtle damage to the cortical region might not be completely avoided in sham animals during craniectomy surgery (see “Results”). The mice were kept for different periods of time before sacrifice as indicated.
2.4. Tissue preparation and slicing
The mice were deeply anesthetized with 0.5 mL of 5% chloral hydrate and perfused with 15 mL of 0.1 M phosphate buffer (PB) followed by 50 mL of freshly made 4% paraformaldehyde (PFA) in PB at room temperature (RT). Brains were removed and post‐fixed in the same PFA solution for 90 min at RT. Frontal slices were cut in PB at 50 μm of thickness with a Leica VT 1000s vibratome (Leica Microsystems Inc.). To minimize the number of animals used, six series of slices from each brain were collected in PB for different staining with an interval of 300 μm between two adjacent slices within an identical series [29, 30].
2.5. Fluoro‐Jade C staining
To confirm brain injury in each lFPI mouse, Fluoro‐Jade C (FJC) staining [31] was routinely performed prior to immuno‐ or silver staining. lFPI mice at time points of 1, 3, and 10 h, 1, 2, 5, 7, and 14 d, or 1, 2, and 3 m, and age‐matched naïve or sham mice were used for FJC staining. Vibratome slices were fixed again in 4% PFA at 4°C for 24 h. They were subsequently mounted onto Superfrost Plus glass slides in 0.1 M PBS (not in distilled water [DW] as recommended in the original study [31] since DW makes brain slices wrinkle). Dried on a heating plate at 55°C for 60 min, the slides were rinsed in basic alcohol solution (1% NaOH in 80% ethanol) for 5 min, and then 2 min in 70% ethanol and DW, respectively. After treatment with 0.06% potassium permanganate for 20 min and briefly rinsed with DW, they were incubated in the dark with 0.0004% FJC (Histo‐Chem, Inc.) in 0.1% acetic acid for 20 min. Rinsed three times in DW, the slides were dried on the heating plate for 5 min. Finally, they were coverslipped with DPX Mountant (Millipore‐Sigma) after clearing with xylene three times (30 s twice and 1 min).
2.6. Immunohistochemical staining
To reveal APP immunoreactivity in the brain we performed free floating immunofluorescent staining [29] in order to raise the contrast of the brain slices from 1, 3 and 10 h, 1, 2, 5, or 7 and 14 d after lFPI, and age‐matched naïve or sham mice. Slices were permeabilized with 0.3% triton X‐100 and nonspecific staining was blocked with a mixture of 5% normal donkey serum and 1% bovine serum albumin (BSA). After incubation with 22C11 (1:200 in PBS; Millipore‐Sigma) or Y188 (1:500; Abcam) for 60 min at RT and overnight at 4°C, visualization was done using Alexa Fluor 594‐conjugated donkey anti‐mouse IgG (red; 1:250; Jackson Immuno Research) or Alexa Fluor 488‐conjugated donkey anti‐rabbit IgG (green; 1:250; Jackson Immuno Research) for 75 min at RT, together with Hoechst (Molecular probes, Eugene, OR) to counter‐stain nuclei of all cells in the brain slices.
For further identification of 22C11‐ or Y188‐stained structures, double immunofluorescent staining [29] was performed with different combinations of primary antibodies as indicated in the text. We also performed co‐staining of Y188 with a mouse monoclonal anti‐Olig2 (an oligodendrocyte marker; 1:200; Santa Cruz Biotechnology) or rat monoclonal anti‐glycophorin A‐associated protein (Ly76, Colone TER‐119, a red blood cell marker; 1:500; Abcam). To confirm the astrocytic staining of 22C11, co‐staining was also performed with 22C11 and a rat monoclonal antibody against glial fibrillary acidic protein (GFAP; A generous gift from Dr. Judith B. Grinspan, Children's Hospital of Philadelphia). To block mouse‐rat cross‐reaction [32] or the reverse (rat‐mouse) cross‐reaction between the primary and second antibodies [33], a sequential protocol was followed when co‐staining with both mice (22C11) and rat (GFAP) primary antibodies [33]: staining with the mouse primary (22C11) and visualizing with donkey anti‐mouse IgG secondary (1:250) followed by staining with the rat primary (anti‐GFAP) and visualizing with donkey anti‐rat IgG secondary at a comparatively lower concentration (1:500).
Due to TBI‐induced microvessel injury ([34]) or inflammation‐induced high permeability of blood vessels, the injured mouse brain slices might be rich in endogenous mouse IgG that can be recognized by anti‐mouse or anti‐rat secondaries [33]. Before performing immunostaining with a mouse (22C11 or Olig2) and/or rat primary antibody (GFAP or Ly76) on brain slices from injured mice, we treated the slices with endogenous mouse IgG blocking reagent (M.O.M. or mouse on mouse; MKB‐2213, 1:25; Vector labs) for 1 h at RT. Unbound M.O.M. was thoroughly washed away by rinsing four times with PBS, prior to primary antibody incubation. The slices from immunofluorescent staining were mounted on a pre‐cleaned slide glass, cover‐slipped with aqueous mounting medium, and kept in dark. Fluorescent samples were observed and images were acquired with Olympus Fluoview 1000 system (Olympus America). Confocal settings were optimized and kept identical when imaging injured versus naïve, or knockout versus wild‐type mouse brain slices.
To provide a better comparison to previous data from TBI patients [7, 8, 15], we performed free floating immunoperoxidase‐ABC staining [35]. Slices were incubated with 1% H2O2 for 30 min at RT to block endogenous peroxidase. They were then treated with 0.3% triton X‐100 and blocked with a mixture of 5% normal goat serum and 1% BSA. After incubation with 22C11 or Y188 for 60 min at RT and overnight at 4°C, the slices were incubated with biotinylated goat anti‐mouse or goat anti‐rabbit IgG (1:200; Vector Labs) for 60 min at RT, respectively. Then, they were incubated with a premixed ABC solution that contains avidin and biotin‐horseradish peroxidase (HRP) conjugate (ABC Elite kit, 1:100; Vector Labs) for 60 min at RT. Visualization for HRP was performed with 3,3′‐Diaminobenzidine (DAB; Millipore‐Sigma) in the presence of 0.003% H2O2 for 15 min at RT. To detect endogenous biotin, we also incubated brain slices directly with HRP‐conjugated avidin (Av‐HRP; 1:100; Vector Labs) before DAB staining, without prior incubation with the primary and secondary antibodies, and ABC. DAB‐stained slices were mounted on Superfrost Plus glass slides and air‐dried in a fume hood for 3 d. After dehydration with 100% ethanol (5 min, three times) and clearance with xylene (5 min, three times), the slices were coverslipped with Eukitt® Mounting Medium (Millipore‐Sigma).
2.7. Silver staining
To demonstrate neuropathological findings with silver staining, one series of vibratome slices from 0.5, 1, 3, and 10 h, 1, 2, 5, 7, and 14 d, or 1, 2, and 3 m after lFPI, and age‐matched naïve or sham mice were further fixed in 4% PFA at 4°C for 7 d. The slices were then stained with NeuroSilver Kit (PK301; FD NeuroTechnologies Inc). This silver staining kit was designed to selectively stain degenerated neurons and/or neuropiles [36], based on the argyrophilic feature of these degenerated structures as demonstrated previously [37, 38]. The free‐floating protocol optimized by the manufacturer (FD NeuroBiotechnologies) was strictly followed, with special precautions to avoid sodium and ethanol. NeuroSilver‐stained slices were mounted on Superfrost Plus glass slides and thoroughly air‐dried in the dark. They were then treated solely with xylene (5 min, three times) and coverslipped with Eukitt® Mounting Medium. Both DAB‐ and NeuroSilver‐stained slices were observed and imaged with Eclipse microscopy‐ NIS Elements (Nikon, Irvine, CA 92618).
3. RESULTS
3.1. Neurodegeneration revealed with FJC staining
Prior to immunostaining and/or silver staining, we confirmed injury to each brain after lFPI by FJC staining [31], which has been used to detect neuronal cell bodies after TBI [39, 40]. In naïve mice, we never detected positive neurons in the cortex (Figure 1A) or hippocampus (Figure 1D), although some astrocytes could be stained (arrow). Starting at 1 h after lFPI, large numbers of positive neuronal cell bodies would be seen in visual and auditory associate cortices (Figure 1B), with some proximal dendrites being stained (Figure 1C). A small number of positive neurons could also be seen in somatosensory and motor areas. In the dorsal hippocampus, FJC‐stained neurons were most abundant in the dentate gyrus (DG) near the vertex where the supra‐ and infra‐pyramidal blades meet but could also be spotted in subregion CA3ab. More positive neurons would be seen at the intermediate (Figure 1E, F) to ventral hippocampus; Figure 1G), mainly localized in granule cell layers and subregion CA3c, with neurons in the hilus of DG. 10 h after lFPI, the number of FJC‐stained neurons peaked. At this time point, dotted appearance of dendritic arbors could be clearly seen in DG and CA3c. LFPI mice demonstrated a higher number of positive astrocytes (Figure 1E, arrow) than naïve controls (Figure 1D, arrow), in accordance with increased gliogenesis previously demonstrated [5]. FJC‐stained neurons would dramatically decrease 2 d after lFPI, as shown elsewhere [39, 40]. 7 d after injury, FJC‐positive neurons could only occasionally be spotted. Instead, we encountered some axons stained with FJC. Flurojade‐C‐stained neurons in area CA1 (Figure 1H) were never observed in cases with “clean” injuries (i.e., no gross tissue damage visible to the naked eye). All FJC‐stained cortical and hippocampal neurons were located ipsilateral to lFPI, except for a small group of granule cells at the vertex of the suprapyramidal and infrapyramidal blades of the granule cell layer in contralateral DG of dorsal hippocampus (Figure 1I and inset).
FIGURE 1.
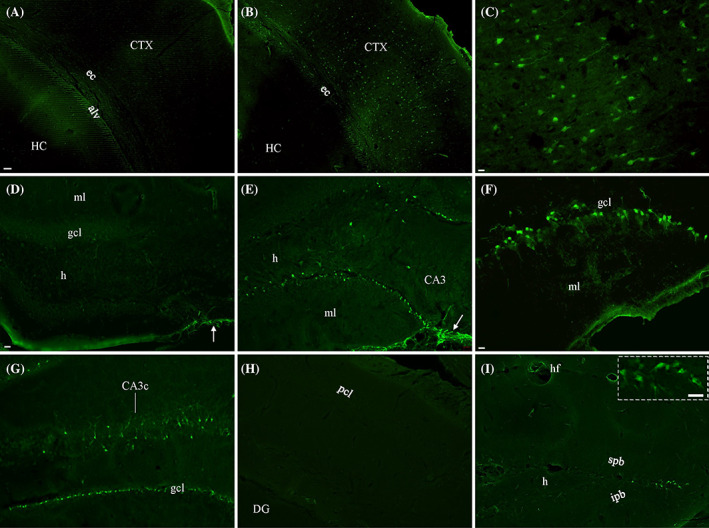
Evaluation of neuronal damage in lFPI mice by staining with Fluor‐Jade C (FJC). Unlike in naïve controls (A), a large number of FJC‐stained cortical neurons were seen in lFPI mice (B). At higher magnification, these positive neurons showed intense staining in cell bodies (C), with a few proximal dendrites visible. (D) Some astrocytes (arrow) but no neurons were stained in the hippocampus from naïve mice. (E) Along with more positive astrocytes (arrow), lFPI mice showed numerous FJC‐stained granule cells and a few hilar cells in the dentate gyrus of dorsal hippocampus. (F) Positive dentate granule cells are highlighted. (G) An increased number of FJC‐stained neurons could be seen in granule cell layers (gcl) and subregion CA3c of ventral hippocampus. (H) No FJC‐stained neurons could be found in area CA1 from lFPI mice. (I) A few granule cells were stained at the vertex of the suprapyramidal (spb) and infrapyramidal blades (ipb) in dorsal hippocampus on the contralateral side, highlighted in inset . alv, alveus; CA3c, subregion CA3c of the hippocampus (HC); CTX, cortex; DG, dentate gyrus; ec, external capsule; h, hilus; ml, molecular layer (of DG); pcl, pyramidal cell layer (of area CA1). Scale bars: 50 μm in (A) and (B); 10 μm in (C, F, and inset); 20 μm in (D), (E), and (G)–(I).
3.2. Immunofluorescent staining with 22C11 or Y188 in naïve mice
APP is expressed in normal brains [21, 22] and plays important physiological roles [41, 42]. We tested two different antibodies for their ability to reveal the distribution pattern of APP in naïve mice, starting with 22C11, a mouse monoclonal antibody against APP that has been widely used in previous studies on human brains after TBI (see “Introduction”). 22C11 showed diffuse and blurred staining in most neurons in naïve mice (Figure 2A), except for more pronounced staining in a subset of cortical neurons (Figure 2B) which exhibited cytosolic staining in cell bodies (Inset). Sharper and more intense staining could be seen in apical dendrites of pyramidal neurons in the cortex (Figure 2B, arrowheads) and hippocampus than in other brain regions. Weaker staining was observed in cell bodies of principal neurons or interneurons in the hippocampus than in dendritic layers (Figure 2C, D). Astrocyte‐like staining could be clearly seen in WM bundles, with higher density in the external capsule (ec; Figure 2E). The strongest staining noted was achieved in ependymal cells (Figure 2F). Another characteristic of 22C11 was perivascular‐like staining (Figure 2C, double arrows), as reported elsewhere [17]. Occasionally, we encountered long fibers (Figure 2D, arrowheads) stained by 22C11.
FIGURE 2.

Immunofluorescent staining in naïve mice with the mouse monoclonal against amyloid precursor protein (APP), Clone 22C11. (A) Confocal photomicrographs acquired from a brain slice across the cortex and hippocampus in a Z‐stack of 10 μm. (B) Stained cortical pyramidal neurons and their apical dendrites (triangles) under higher magnification. Cytosolic staining pattern is highlighted in (inset). (C) and (D) No sharp somatic staining was observed in hippocampal pyramidal cells (pcl) and granule cells (gcl). Instead, high background staining was seen in dendritic areas within the hippocampus (ml, so, and sr). Perivascular staining indicated with (double arrows). (E) Astrocytic‐like staining in external capsule (ec), the major white matter bundle of our focus. (F) Intensely stained ependymal cells (ep) surrounding the lateral ventricles (lv). (G)–(I) Single confocal image showing double staining with 22C11 (green) and a rabbit monoclonal against glial fibrillary acidic protein (GFAP; red) in ec and hippocampus. Whereas GFAP staining could be seen all over the slice, 22C11‐stained fibrous structures were predominantly found in ec. After merge, 22C11 would stain the central part of GFAP‐verified astrocytes, resulting in partial colocaliztion (I, arrows). Unlike ec, very small fraction of GFAP‐stained astrocytes in the hippocampus were costained with 22C11. hf, hippocampal fissure; so, stratum oriens; sr, stratum radiatum. Scale bars: 50 μm in (A); 10 μm in (B)–(I).
To test if the astrocyte‐like staining by 22C11 in WM bundles (Figure 2E) was indeed derived from astrocytes, we performed sequential staining with 22C11 followed by a rat monoclonal antibody against GFAP, according to a previously reported protocol [33]. Unlike 22C11 which demonstrated fibrous astrocyte‐like staining predominantly in ec (Figure 2G), GFAP showed clear staining in astrocytes all over the hippocampus and ec (Figure 2H). Colocalization of 22C11 and GFAP was largely restricted to this WM bundle (arrows), especially in the central part of astrocytes, as can be seen under higher magnification (Figure 2G–I). Occasionally, colocalization could also be found in the hippocampus, especially in stratum oriens of area CA1. Virtually all the discrete, non‐diffuse astrocyte‐like staining by 22C11 overlapped with GFAP staining, although not all glia had 22C11 staining, suggesting that in naïve slices, 22C11 was binding to an antigen present in some astrocytes, especially in WM.
By contrast, Y188 clearly demonstrated APP immunoreactivity in neurons throughout the brain including the cortex (Figure 3A) and hippocampus (Figure 3A–C). Membrane staining by Y188 could be clearly confirmed in both principal neurons (Figure 3B, C) and interneurons (Figure 3B, arrows) in addition to weak cytosolic staining, exhibiting a ring of particles encircling the neuronal cell body (inset). Whereas some proximal dendrites might be clearly stained, the axons were usually not visible after Y188 staining. Y188 immunoreactivity could also be identified as puncta along WM bundles such as the corpus callosum and ec (Figure 3D). The punctate staining might be present in rows (arrowheads), in a similar fashion seen in the arrangement of oligodendrocytes. No staining of astrocytes or microglia was ever observed with Y188.
FIGURE 3.

Immunofluorescent staining in Naïve mice with the rabbit monoclonal against APP, Clone Y188. (A) A stack of confocal photomicrographs showing Y188 staining in a brain slice across the cortex and hippocampus. Both the cortical and hippocampal neurons were clearly stained. Under higher magnification, cell membrane staining (with weak cytosolic staining) is prominent in principal neurons of hippocampal area CA1 (B) and dentate gyrus (C), exhibiting as particles around cytosol (inset). Note that inhibitory neurons were also sharply stained by Y188 (arrows). Positive staining could also be seen in ec (D), in which some puncta were in arrangement of rows (arrowheads). (E)–(G) Single confocal image showing close correlation (triangles) between Y188 (Green) and Olig2 staining (Red) found in corpus callosum. At higher magnification (insets), olygodendrocytic cell bodies exhibited an obvious polarity of Y188 staining (green), encircling Olig2‐positive nuclei (red). Note that the dorsal hippocampal commissure (dhc) is devoid of both stainings (lower inset in G). Scale bars: 50 μm in (A); 20 μm in (B)–(D); 10 μm in (E)–(G); 2 μm in insets at high magnification for (E)–(G).
To check if the Y188‐stained puncta in WM bundles originated from oligodendrocytes, we costained with Olig2 (Figure 3E–G), an oligodendrocyte transcription factor, and a marker for the nucleus and occasionally the cell body of oligodendrocytes. Under low magnification, Y188 staining in the corpus callosum (Figure 3E, green) resembled the putative neuronal varicosities labeled by immunoperoxidase‐ABC staining with 22C11 [7]. Olig2 staining (Figure 3F, red) however, was seen in a close relationship (Figure 3G) to the rows of Y188‐stained puncta. Under higher magnification, Y188 stained the entire cell body of an oligodendrocyte, but with obvious polarity in the cytosol (Figure 3E inset). Olig2‐stained nuclei (Figure 3F inset) were encircled by Y188‐stained cell bodies (Figure 3G inset). We refer to the combined neuronal and oligodendrocyte staining by Y188 in naïve controls as “basal staining,” hoping to differentiate it from the staining pattern in injured mice.
3.3. Validating specificity of 22C11 and Y188 using APP knockout mice
To determine if 22C11 or Y188 or both are specific for APP, we performed double antibody staining with 22C11 and Y188 on slices collected at similar dorsal‐ventral coordinates from wild‐type and APP knockout mice. In wild‐type mice (Figure 4A–C), subtle co‐staining was observed in hippocampal pyramidal cells (Figure 4A, inset), and perfect co‐staining could be clearly seen in some cortical neurons (Figure 4B, inset). In WM bundles (such as the ec shown here), Y188 and 22C11 stained different cell groups (Figure 4C, inset), consistent with the single antibody staining patterns described above (Figures 2 and 3). In knockout mice (Figure 4D –F), Y188 staining was completely absent. However, the staining pattern of 22C11 looked similar to that seen in wild‐type mice (Figures 4A –C and 2). This finding corroborates previous reports [21, 22] suggesting that Y188 (but not 22C11) is specific to APP. Therefore, in the rest of the experiments described here, we used Y188 to assess APP immunoreactivity in lFPI mice.
FIGURE 4.

Validating specificity of 22C11 and Y188 by comparing staining of APP knockout and wild‐type mice. In wild‐type mice (A)‐(C), Y188 (green) showed sharp staining in hippocampal (A) and cortical neurons (B), and sparse staining in corpus callosum (cc, C). On the contrast, 22C11 (red) showed faint staining in these neurons. In addition to intense staining of ependymal cells, 22C11 also stained out astrocytes in cc. Arrowhead: perivascular staining. Double staining with both Y188 and 22C11 in the same cells and/or area is highlighted in insets. In APP null mice (D)–(F), we could not find green staining from Y188. However, 22C11 showed the same staining pattern as in wild‐type animals (A)–(C). As a result, double staining in APP knockouts exhibited 22C11 immunoreactivity (red) only. sl‐m, stratum lacunosum‐moleculare. Scale bars: 10 μm in all panels, including insets .
3.4. Immunofluorescent staining with Y188 in WM bundles after lFPI
In contrast to the immunoperoxidase‐ABC staining with 22C11 performed in many previous TBI studies of WM bundles (for review, see [7]), here we used immunofluorescent staining with Y188. 3 h after lFPI large numbers of puncta were intensely stained on the ipsilateral side. The punctate staining reached the peak at 10 h after lFPI (Figure 5A). Along with basal‐pattern staining in the surrounding neurons (Figure 5B, C), these heavily stained puncta were heterogeneous in size and usually formed large patches (Figure 5D). The patches of puncta would usually be found in ec and alveus (Figure 5A, D), along with some in fimbria and dorsal fornix, but not in corpus callosum (cc; Figure 5A). In addition to puncta, another characteristic pattern of WM staining in injured animals was the sporadic appearance of spherical or conical structures (referred to hereafter as spheres or cones), with or without a long tail (Figure 5D, triangles). We also encountered aggregates of perivascular staining (Figure 5A, arrows). Under higher magnification, stained structures were oriented as if they were emerging from the blood vessels (Figure 5D and Inset). Different from heavily stained puncta and sporadic long‐tail structures, these perivascular aggregates could be found as early as 1 h after lFPI, predominantly seen along ventricular bank. The corpus callosum was devoid of intensely stained puncta and long‐tail structures, except that a small aggregate of perivascular staining might be spotted on both sides at the upper‐medial corner of the third ventricular bank.
FIGURE 5.

Immunofluorescent staining 10 h after lFPI with Y188 in white matter (WM) bundles, at the level of dorsal hippocampus. (A) Stack of confocal photomicrographs showing patches of intense staining in ec and alveus (alv). Compared to the basal pattern of staining in area CA1 (B and Figure 3) and dentate gyrus (C and Figure 3), ec and alv was rich in pathological staining shown as intensely stained puncta in heterogeneous size and conical structures bearing a log tail (D, triangles). Arrows indicate clusters of staining surrounding a blood vessel (asterisks). Under higher magnification (D), these perivascular structures were so arranged as if they were emerging from the vessel (Inset). alv, alveus. Scale bars: 50 μm in (A); 20 μm in (B)–(D); 5 μm in (inset).
3.5. Immunofluorescent staining with Y188 in gray matter areas after lFPI
In addition to intense staining in WM bundles, in the gray matter of the cortex, we encountered numerous intensely stained spheres measuring 3–5 μm in diameter, much smaller than nearby cell bodies but larger than puncta seen in WM. Beginning as early as 1 h after lFPI, the staining density reached its peak at 3 h (Figure 6). Stained spheres were distributed in layers III to VI, predominantly in the visual and auditory associated cortices (Figure 6A), but also in primary sensory and motor cortices, although with much lower density. These Y188‐stained spheres are axonal blebs, that is, the distal ends of truncated axonal segments, comparable to previous reports [43, 44]. The blebs were connected to the parent cell bodies via the truncated axon segments, and were in close proximity to the cell bodies, with the length of the remaining axonal segments being 1–5 times the diameter of the cell body (Figure 6B). Unlike the blebs, both the cell bodies and the axonal segments kept their normal size, and the parent cell bodies showed a basal staining pattern at very early time points. As the time after injury increased the truncated axonal segment became enlarged and intensely stained, and by 10 h after lFPI formed a large and elongated conical structure with the axonal bleb serving as its base (Figure 6C). At this time point, the parent cell body still had a basal pattern of staining. At much later time points, four to 5 d after lFPI, we saw fewer axonal blebs. Instead, some pyramidal cell bodies together with the most proximal portion of their apical dendrites would become densely stained (Figure 6D, E). In comparison, control mice never demonstrated either axonal blebs or intensely stained cell bodies (Figure 6F).
FIGURE 6.

Temporal changes in morphology of Y188‐stained axonal blebs in gray matter (cortex) after lFPI. (A) Intensely stained axonal blebs in layers III to VI of somatosensory and primary motor cortices. (B) Round axonal blebs in cortex connecting to parent cell bodies via a weakly stained remaining segment of the proximal axon 3 h after injury. The length of the connecting axonal segments would measure 1–5 times of the cell bodies. Arrowheads indicate the remaining segment of the proximal axons. (C) At 10 h, some of the connecting axonal segments were swollen and heavily stained, exhibiting as conical structures with the original axonal blebs serving as the bases. The parent cell bodies exhibited basal stain. (D) and (E) 5 days after injury a group of pyramidal cell bodies (together with their proximal dendrites) showed heavy staining amid basal staining for the cell bodies of the surrounding neurons. (F) In contrast, naïve mice showed no obvious staining of axons. Scale bars: 50 μm in (A) and (D); 5 μm in (B)–(C) and (E)–(F).
Injured mice also showed axonal blebs in the hippocampus. Unlike naive controls (Figure 7A), axonal blebs could be seen in supra‐ and infrapyramidal blades of DG granule cells and also at the vertex where the blades meet (Figure 7B, arrows). In CA3, blebs were distributed predominantly in the distal portion, that is, CA3c. Under high magnification, blebs were confined to the subgranular zone of DG (Figure 7C) and infrapyramidal zone of CA3 (Figure 7D). Axonal blebs could be also seen in nucleus caudatus‐putamen (CPu; Figure 7E, F). Although these blebs followed the same morphological change over time as seen in the cortex, we could not trace the remaining axonal segments back to their parent cell bodies for most of the dentate and striatal blebs (Figure 7F), perhaps due to their angle of passage. When sliced perpendicular to the pathway, a fiber bundle will be truncated and the axons cannot be tracked back to their cell bodies [45].
FIGURE 7.

Pathological staining with Y188 in injured and sham mice 10 h after impact. (A) Naïve mice exhibited basal staining. (B)–(F) axonal blebs identified in ventral hippocampus and nucleus caudatus‐putamen after lFPI with an impact of 2.6 atm. (B) At low magnification, axonal blebs (arrows) aggregated in the subgranular zone of DG (C) and infrapyramidal zone of the distal pole of CA3c (D), far more heavily stained than the basal stained neurons nearby. (C), (D) Groups of axonal blebs in cone shape at higher magnification from areas in (B) indicated with (C) and (D), respectively. (E): Axonal blebs in nucleus caudatus‐putamen, highlighted at higher magnification in (F). Axonal blebs in the cortex (G) and dentate gyrus (H), as well as puncta in ec (H) after lFPI with 1.8 atm. (I) Axonal blebs (arrowheads) and perivascular staining (arrow) identified in the cortex of sham mice. Scale bars: 50 μm in (A) and (B); 20 μm in (E); 5 μm in (C), (D), and (F); 10 μm in (G)–(I).
In addition to axonal blebs, punctate staining could also be found in gray matter areas such as the cortex, but sporadically distributed and with much lower density than that in WM. Occasionally, we might see weakly stained presynaptic terminals that would be localized predominantly at center of the injury and measured around 0.5–1 μm, much smaller than most of stained puncta in WM bundles. We collectively refer to these intensely stained structures in gray and WM as “pathological staining” (after lFPI), in comparison to “basal staining” demonstrated in naïve controls. Axonal blebs were distributed exclusively on the side ipsilateral to lFPI, except for a few blebs at the vertex of granule cell layers in dorsal hippocampus on the contralateral side where FJC‐stained neurons were found. Pathological staining would dramatically decrease in density 7 d after lFPI and would rarely be found at 2 weeks.
3.6. Pathological staining in lFPI 1.8‐atm mice and in sham‐injured mice
To determine if pathological staining was also observed after a less severe injury, we added a cohort of lFPI 1.8 atm animals and checked for Y188 staining. After injury, axonal blebs could be observed in the cortex (Figure 7G), CPu, and hippocampus. We also found intensely stained puncta, spheres, cones and perivascular structures in WM (Figure 7H). At this lower impact strength, Y188‐stained pathologies seemed to be variable in density case by case, compared to those seen in lFPI 2.6‐atm mice described above.
We used naïve mice as controls because we never observed pathological staining in naïve controls (as described above). In all sham mice, by contrast, axonal terminals could be seen in layers I‐II of cortex at the site of craniectomy, together with axonal blebs (Figure 7I, arrowhead) occasionally encountered in layer III. In some sham cases, we also found intensely stained aggregates of perivascular structures around blood vessels (Figure 7I, arrow). However, these aggregates were distributed almost exclusively within gray matter of the cortex, showing an obvious regional difference from the more widespread staining found in injured mice. In addition, a very limited number of axonal blebs might occasionally be found in the deeper layers of sham mice. No axonal blebs were found in the hippocampus or nucleus caudate‐putamen and no clusters of puncta in WM in sham group. Subtle pathological, behavioral, and neurochemical alterations from the craniectomy alone have been previously investigated [46, 47], and are a potential confound in any study using an open skull injury model. Even though the staining here in sham mice was considerably less than the staining in injured mice, and limited to gray matter of the cortex, we nonetheless use naïve mice as a more stringent non‐injured, negative control for injured tissue, and as a better correlate to the control tissue in human immunocytochemical studies.
3.7. Y188 versus 22C11 in detecting neuropathology after lFPI
To better compare Y188 and 22C11 labeling we performed double immunofluorescent staining in slices prepared from both naïve and injured mice. In slices from naïve animals, the only obvious co‐staining we observed was on the cell bodies of a group of cortical pyramidal neurons as shown in (Figure 4B). Considering that TBI might produce dramatic changes in antibody staining, we then performed the same double staining on slices from injured mice (Figure 8A–F). Y188‐positive axonal blebs (Figure 8A) among cortical neurons were negative with 22C11 (Figure 8B), although the parent cell bodies were costained (Figure 8C). Similarly, Y188‐stained puncta and spheres or cones in WM bundles such as ec (Figure 8D) were also negative with 22C11 (Figure 8E), demonstrating no co‐staining between Y188 and 22C11 in WM (Figure 8F). To explore the possibility that the sensitivity and specificity of Y188 were due to it being a C‐terminal antibody as compared to the N‐terminal antibody 22C11, we tested another C‐terminal antibody, CT‐20, for its ability to detect pathology after lFPI (Figure 8G–I). Similar to Y188, CT‐20 was proved specific to APP after double staining with 22C11 in APP knockout mice. CT‐20‐stained puncta and spherical or conical structures in WM (Figure 8G) could not be co‐stained by 22C11 (Figure 8H, I). As expected, CT‐20‐stained axonal blebs in the gray matter were also negative to 22C11 (Figure 8I, inset).
FIGURE 8.

Y188‐positive neuropathology could not be costained with 22C11. (A): Conical structures intensely stained by Y188 (green) 10 h after lFPI, still connecting to their basally stained parent cell bodies of cortical pyramidal neurons. (B): Most cell bodies could be stained with 22C11 (red), but not the axonal blebs, leaving cell bodies as orange to yellow and axonal blebs as pure green (C). (D)–(F): Discrete staining by Y188 of puncta and conical structures in ec from 22C11 staining in ependymal cells and astrocytes (arrows), without obvious co‐staining could be confirmed (F). (G)–(I): Positive staining of puncta and cones by CT‐20 (green), without co‐staining by 22C11 (red). Similarly, 22C11 (red) could not costain CT‐20‐stained axonal blebs (green) in the cortex (inset). Scale bars: 10 μm in all panels.
3.8. Immunoperoxidase‐ABC staining with 22C11 or Y188 after lFPI
Since immunofluorescent staining with 22C11 did not label pathological structures after lFPI, and to better mimic previous studies on human TBI (see “Introduction”), we then performed immunoperoxidase‐ABC staining with this antibody in tissue from naïve and injured mice. In naïve controls (Figure 9A–C), cell bodies and apical dendrites of cortical neurons were stained (Figure 9B, inset). A small number of astrocytes would also be stained in WM bundles (Figure 9C, inset, double arrow), together with weak staining of oligodendrocytes occasionally (Figure 9C, triangles). In lFPI mice (Figure 9D–F), no obvious change in the staining of neurons was seen in gray matter areas (Figure 9D, E, inset), compared to naïve controls. In WM, however, a large increase was found in the number of stained astrocytes of fibrous appearance (Figure 9F, inset, double arrows) and oligodendrocytes arranged in rows (Figure 9F, triangles). Whereas 22C11 showed blurred staining of neuronal somata, Y188 sharply labeled cortical neurons in naïve mice (Figure 9G, H, inset), with some oligodendrocytes in WM (Figure 9I, inset, triangles) giving the appearance of varicosities as shown previously [7]. In lFPI mice stained with Y188 (Figure 9J–L), intensely labeled axonal blebs were seen in the cortex (Figure 9J, K, inset, arrows), CPu, and hippocampus. lFPI also resulted in heterogeneous puncta in WM bundles (Figure 9J, L, inset), with a dramatic increase in density and intensity (Figure 9L, inset) compared to naïve controls. Another obvious change was the appearance of heavily stained spheres and cones with or without a long tail among those puncta in WM (Figure 9L, inset, arrows). Unlike the immunofluorescent protocol, immunoperoxidase‐ABC staining for 22C11 showed oligodendrocytes in naïve and injured mice, suggesting that the latter protocol itself introduced a new staining pattern. By contrast, the Y188 immunoperoxidase‐ABC protocol demonstrated a similar staining pattern as the immunofluorescent protocol, likely due to the specific staining of this antibody dominating in both protocols.
FIGURE 9.

Immunoperoxidase (ABC) staining with 22C11 or Y188 10 hr after lFPI. (A)–(C) In naïve controls, 22C11 showed positive staining in the cortex and ec. (B) At higher magnification, some of cortical pyramidal neuron staining could be traced to the apical dendrites (inset, arrow). Some astrocytes also got stained (C, inset), with a few punctate staining arranged in rows (triangles). (D)–(F) 10 h after lFPI, 22C11 showed a similar staining pattern in the cortex (E, inset, arrow) and a largely increased number of astrocytes (double arrows) in ec (F, inset). Meanwhile, some varicosity‐like rows got clearly stained in ec (F, inset, triangles). Note that ependymal cells (ep) were intensely stained in both naïve (A) and (C) and injured mice (D) and (F). (G)–(I) In Naïve mice, Y188 clearly showed sharp staining of cortical neurons (H, inset) and rows of oligodendrocytes in ec (I, inset, triangles). (J)–(L) lFPI resulted in a high density of intensely stained puncta in ec and axonal blebs in cortex (arrows). At higher magnification, these conical axonal blebs possessed a swollen base (K, arrows), with the apex pointing to basally stained cell bodies of cortical pyramidal neurons (arrows, inset). (L) In ec, a couple of conical structures equipped with a long tail (arrows) were evident among a large number of heavily stained puncta (inset, arrow). Likely due to the extremely high density in ec, it became difficult to differentiate rows of varicosity‐like staining after lFPI. Scale bars: 50 μm in (A), (D), (G), and (J); 20 μm in other panels; 10 μm in insets.
3.9. Staining for endogenous biotin with avidin‐HRP after lFPI
The ABC kit is designed to visualize biotin conjugated to a secondary antibody, where the secondary in turn has recognized the primary antibody, such as 22C11 or Y188, during immunoperoxidase staining (see “Materials and Methods”). The ABC kit can also react to endogenous biotin in the samples (if any), which may result in a false positive interpretation of the staining pattern [48]. To check for this possibility, we stained for endogenous biotin in brain slices from naïve and lFPI mice by incubating brain slices with avidin‐HRP when no primary or secondary antibodies were present. In naïve controls (Figure 10A–C), positive staining could be clearly seen in some WM bundles including the corpus callosum (Figure 10A), fornix, fimbria, and alveus (Figure 10B). Weak staining could be seen in other WM bundles such as EC (Figure 10B). Sporadic staining might be found in the cortex (Figure 10B). The most obvious staining in naïve tissue was usually seen in the hippocampus (Figure 10C) and cerebellum. Staining dramatically increased after lFPI (Figure 10D–I). Oligodendrocytes were intensely stained with a characteristic appearance like varicosities (arrowheads) in WM bundles such as corpus callosum (Figure 10D, G) and ec (Figure 10E, H). Among rows of oligodendrocytes, stained single astrocytes with larger cell bodies could also be spotted. In the hippocampus (Figure 10F, I), the strongest staining was found in the subgranular zone of DG. At higher magnification, intense staining was seen from astrocytes and possibly interneurons (Figure 10I, double arrows). lFPI also increased punctate staining in the cortex (Figure 10E) and stratum lacunosum moleculare (sl‐m) of area CA1 (Figure 10F), along with strong background staining, suggesting an upregulation of biotin production and/or biotinylation after injury. Perivascular staining could be seen in both naïve and lFPI mice (Figure 10C, F, arrows). In summary, many of the features reported for 22C11 immunoperoxidase‐ABC staining are present when staining with avidin‐HRP alone, suggesting that interference from endogenous biotin cannot be excluded in previous TBI studies using human samples.
FIGURE 10.

Staining with avidin‐HRP 10 h after lFPI. Compared to weak staining in naïve mice (A)–(C), lFPI induced tremendously increased staining in the corpus callosum and dorsal fornix (D), external capsule, alveus, cortex (E), and dentate gyrus and stratum lacunosum‐moleculare (F). Varicosity‐like staining patterns (arrowheads) could be confirmed in WM bundles at higher magnification (G) and (H). In dentate gyrus (lower row), positive staining was predominantly confined to subgranular zone and hilus (I). Perivascular staining ( arrows ) could be seen in both naïve (C) and lFPI (H) mice, especially along hippocampal fissures. cc, corpus callosum; df, dorsal fornix; dhc, dorsal hippocampal commissure. Scale bars: 50 μm in (A)–(F); 10 μm in (G)–(I).
3.10. Pathologies in transgenic mice after lFPI
To determine whether the Y188‐stained axonal blebs in the gray matter originated from excitatory or inhibitory neurons, we performed immunofluorescent staining with Y188 in two colonies of transgenic mice: YFP mice in which the excitatory neuron membrane protein Thy1 is YFP‐tagged, and PV‐Tomato mice in which parvalbumin inhibitory neurons express the fluorophore tdTomato in the cytosol. In the cortex of YFP mice 10 h after lFPI (Figure 11A, C), a few YFP‐labeled axonal blebs could be seen connecting to their parent cell bodies of YFP‐expressing pyramidal neurons (Figures 11A, C, green). In the same slices, Y188 staining revealed axonal blebs (red), similar to injured wild‐type mice. With scanning confocal microscopy, we demonstrated that all YFP‐labeled axonal blebs were Y188‐positive (arrows), but most of the Y188‐stained axonal blebs were devoid of this excitatory neuron fluorescent tag (double arrows). In other words, excitatory YFP‐labeled axons were only a small subset of all APP‐positive axons, which may be due to incomplete expression of the randomly inserted Thy‐1 YFP transgene [27, 28].
FIGURE 11.

Y188‐stained axonal blebs were derived from excitatory or inhibitory cortical neurons. Confirmation in transgenic mice 10 hr after lFPI. (A)–(C): An axonal bleb connecting its parent cell body of a YFP‐labeled pyramidal neuron (green). The axonal bleb was intensively stained with Y188 (red), showing a perfect colocalization (arrows ) of both fluorophores (orange to yellow; arrows). (D)–(F) A tdTomato‐labeled PV interneuron (red) was shown to be the parent cell body of a Y188‐stained axonal bleb (green). Although tdTomato could not perfectly label the axonal bleb, colocalization was confirmed in the parent cell body (arrows). Note the running direction of this inhibitory axon towards the pial surface of the brain, opposite to that from pyramidal neurons. Y188‐stained axonal blebs negative to the transgenic fluorescent proteins were also prominent (double arrows). Scale bars: 20 μm in (A)–(F).
In PV‐Tomato mice (Figure 11D–F), we rarely found Tomato‐labeled axonal blebs among PV interneurons (red). Again, Y188 staining showed a group of axonal blebs connecting to their parent cell bodies (green). Single confocal images showed that virtually all of the Tomato positive cell bodies were also Y188‐positive, and a small portion of the Y188‐positive (and axonal bleb‐carrying) parent cell bodies were also tdTomato positive (arrows), but most of the parent cell bodies carrying Y188‐stained axonal blebs were devoid of this red fluorescent tag (double arrows). In other words, PV inhibitory neurons constituted only a small subset of the APP‐positive cells, the remainder of which may have been excitatory neurons or non‐PV inhibitory neurons. In the DG where only a few PV‐Tomato interneurons could be found, we did not verify the axonal identity of Y188‐stained blebs since granule cells, the origin of most parent cell bodies do not express YFP (Thy‐1). As a result, we could not conclusively establish whether there was any co‐localization between Y188 and either PV‐Tomato or YFP. In nucleus caudatus‐putamen, we encountered some Y188‐stained axonal blebs co‐labeled with tdTomato.
We also checked the identity of Y188‐stained puncta and spherical or conical structures in WM bundles using YFP and PV‐Tomato mice. In naïve YFP mice, YFP‐labeled axons were smooth in appearance. They were seen entering cc, ec, and internal capsule (ic) from the cortex to form homogeneous fiber bundles, running parallel to the long axis of these WM bundles at rostral (Figure 12A, B) and caudal levels of the hippocampus (Figure 12C, D). Among these bright YFP‐labeled cortical axons (green), basal staining of oligodendrocytes and occasionally neuronal cell bodies could be identified with Y188 staining (red). 10 h after lFPI (Figure 12E–H), some YFP‐labeled excitatory axons became enormously enlarged among normal‐sized fluorescent axons or even became beaded to form varicosities (arrows) running along the WM bundle axis, as shown elsewhere [49]. In addition, numerous Y188‐stained puncta and a few cones could be found in ec, mingling with deformed YFP axons. YFP axons were further enlarged 7 d after lFPI (Figure 12I–L), together with Wallerian degeneration visible as bright homogenously beaded lines (Figure 12J, L, arrowheads). Y188‐stained puncta and spherical or conical structures were dramatically decreased in density at this later time point. Since normal and deformed YFP axons were negative to Y188, we could not find any overlap between the Y188 staining and YFP in WM, suggesting that Y188‐stained puncta and spherical or conical structures might not originate from excitatory axons.
FIGURE 12.

Y188 staining in WM bundles was not directly related to deformed excitatory axons in YFP mice after lFPI. Each panel represents a stack of confocal photomicrographs in a range of 10–12 μm thickness. (A)–(D) In naïve mice, homogeneous YFP‐labeled axons (green) exhibited negative staining with Y188 (red). (E)–(H) Deformed YFP axons shown as beaded swellings (or varicosities, arrows), mingled with Y188‐stained puncta and conical structures (red) 10 h after lFPI. The staining of deformed YFP axons (green) and Y188 stained puncta and conical structures (red) was mutually exclusivse. (I)–(L) YFP‐labeled swelling (green) became more larger and was seen alongside Wallerian degeneration of YFP axons ( arrowheads ) at 7 d after lFPI, at which time Y188 staining decreased dramatically. Each row consists of two pairs of images (low power and higher magnification) at rostral (columns 1 and 2) and caudal levels (columns 3 and 4) across the hippocampus. Scale bars: 20 μm in columns 1 and 3; 5 μm in columns 2 and 4.
In naïve PV‐Tomato mice, red fluorescent fibers were seen running into WM bundles including the cc, ec, and ic (Figure 13A–D), although these red inhibitory PV‐Tomato axons were lower in density than the excitatory YFP axons described above. Enlargement of PV‐Tomato axons was pronounced at 10 h after lFPI (Figure 13E–H). Unlike deformed YFP axons that obviously formed varicosities, most of deformed Tomato axons were in the shape of spheres or cones bearing a long tail and running along the WM bundle axis (Figure 13F, H). Although patches of intensely stained Y188 puncta and conical structures could be easily identified in ec, the majority of them did not overlap with deformed tdTomato inhibitory axons (red) (Figure 13E, G), similar to the results above for excitatory neurons. That having been said, there was nonetheless a small number of Tomato‐labeled axonal deformation costained by Y188 in the transition border between the cortex and ec (Figure 13G, asterisk, inset). It is likely that these Y188 and tdTomato double‐labeled spheres and cones are axonal blebs originating from parvalbumin interneurons in nearby layer V of the cortex as identified previously [50] since TBI‐induced axonal blebs are present in close proximity to the parent cell bodies ([51]; present study). Wallerian degeneration occurred in tdTomato axons 7 d after lFPI (Figure 13I–L), showing a beaded appearance with wider space between the beads than Wallerian‐degenerated YFP axons. At this time point, co‐staining by Y188 and tdTomato could not be found (Figure 13J, L). In addition, no perivascular staining exhibited either tdTomato or YFP fluorescence. Taken together, the majority of the Y188 staining in WM did not originate from neurons, except for a few spheres or cones adjacent to deep layers of the cortex, which may have been derived from inhibitory axons.
FIGURE 13.

Direct relation was found between deformed inhibitory axons and Y188‐stained conical structures in WM bundles, but not puncta in PV‐tomato mice after lFPI. Each panel represents a stack of confocal photomicrographs in a range of 10–12‐μm thickness. (A)–(D) In naïve mice, homogeneous tdTomato‐labeled axons (red) were interspersed among basal staining for Y188 (green). (E)–(H) Deformed tdTomato axons (red) shown as varicosities (arrows) or cones with a long tail in ec, largely separated from patches of Y188‐stained puncta and conical structures (green) 10 h after lFPI. Nevertheless, colocalization could be found between a small number of deformed tdTomato axons and Y188‐stained conical structures in the transition border between the cortex and ec (G, asterisk, inset). (I)–(L) Dotted appearance of Wallerian degeneration from tdTomato axons (arrowheads) was prominent 7 d after lFPI when pathological Y188 staining decreased dramatically. Each row consists of two pairs of images (low power and higher magnification) at rostral (columns 1 and 2) to caudal levels (columns 3 and 4) level across the hippocampus. Scale bars: 20 μm in columns 1 and 3; 5 μm in columns 2 and 4 and inset.
3.11. Neuropathologies detected with NeuroSilver staining kit
To further explore supporting evidence for the neuropathological staining revealed by Y188, we performed parallel staining on adjacent brain slices with a NeuroSilver kit, which has been widely used to detect neurodegeneration after TBI [36]. We focused on the cortex, ec, and hippocampus, where Y188‐labeled pathologies were most prominent (as described above). Naïve control mice showed only background staining (Figure 14A, C, insets). Injured mice, by contrast, showed silver‐stained axonal blebs in the cortex and hippocampus as early as 30 min after lFPI. At 3 h after injury, axonal blebs in the cortex had the appearance of isolated, compact dark bodies (Figure 14B, E, inset), unlike the Y188‐stained axonal blebs noted above which had a proximal segment of axon connecting the bleb to the parent cell body (Figure 6B, C). 10 h after lFPI, the silver‐stained cortical blebs became elongated and irregular, and the staining expanded to include a long tail as a dotted line (arrows) connecting the bleb to the parent cell bodies (Figure 14F). 7 d after lFPI (Figure 14G), numerous silver‐stained fine axons were observed as dotted lines of uniform diameter, with a few axonal bulbs (not axonal blebs; double arrows). In WM (Figure 14H–J), NeuroSilver kit did not show obvious staining of pathological structures at 3 h after lFPI (Figure 14H), the time point when APP‐staining was prominent. 10 h after lFPI (Figure 14I), some intact axons were weakly stained (arrows). At 7 d after lFPI (Figure 14J), NeuroSilver staining showed dense Wallerian degeneration as dotted lines of uniform thickness arranged in parallel (inset), which could not be shown by Y188. Silver‐stained Wallerian degeneration and axonal bulbs remained detectable up to several weeks, unlike Y188 staining which rarely showed pathologies (puncta and spheroids) 2 weeks after lFPI. In the hippocampus from injured mice (Figure 14D, K, M, inset), NeuroSilver staining was also characteristic of injured tissue. From 1 h after lFPI, a larger number of isolated axonal blebs were stained as spheres in DG (Figure 14D, K, insets) and area CA3. At 10 h after lFPI (Figure 14L, inset), silver‐stained hippocampal blebs remained isolated and were irregular in shape, with some debris identifiable around them. 7 days after lFPI (Figure 14M), densely stained axons formed dotted lines of uniform thickness running along the inner portion of molecular layer or descending into the hilus, which might represent Wallerian degeneration of axons from mossy cells or granule cells, respectively. Wallerian degenerated axons was also seen in area CA3, with fewer in area CA1. In summary, NeuroSilver staining can be used to confirm axonal blebs in gray matter that are positive to Y188. However, the Y188‐stained puncta in WM cannot be verified as axonal, based on the discrete pattern and time window of NeuroSilver staining.
FIGURE 14.

Neuropathology detected with NeuroSilver staining after lFPI. Unlike naïve controls (A), lFPI mice (B) showed axonal blebs as black dense cores (inset) in the gray matter of the cortex 3 h after injury. Background staining of neuronal cell bodies was brown in both naïve and injured mice (A and B, insets), with or without isolated small black particles enveloped by the cell bodies (arrowheads). Axonal blebs were much smaller than surrounding cell bodies at higher magnification (B, inset ). Note that white matter bundles (external capsule and alveus here, marked as ec/alv) might be stained dark in either naïve (A) or injured mice (B). (C) and (D) Axonal blebs were also seen in the dentate gyrus and area CA3 of the hippocampus from lFPI mice (D, inset) but not naïve controls (C, inset). (E) Magnification from (B): numerous isolated axonal blebs among yellowish‐brown cell bodies in the cortex, 3 h after lFPI. (F) Some blebs were elongated and became irregular at 10 h after lFPI, connecting to parent cell bodies via the remaining axonal segments which had a dotted appearance at the proximal end (arrows). (G) 7 d later, numerous fine cortical axons were stained as beaded lines, with a few axonal bulbs (not blebs) intensely stained (double arrowhead). (H) No axons were stained in ec/alv 3 h after lFPI, although some oligodendrocytes were arranged in rows within these dark regions. (I) At 10 h after lFPI, some intact axons (arrows) could be weakly stained. (J) Large number of axons were intensely stained 7 d after lFPI, exhibiting characteristic Wallerian degeneration as homogeneous beads along the long axis of the axon bundles (inset, arrowheads). (K) Spheroidal axonal blebs were predominantly seen in the subgranular zone 3 h after lFPI, highlighted in inset. (L) Axonal blebs became less regular and the contour of some blebs lost sharpness at 10 h after lFPI, compared to 3 h (K). Debris was also visible around these irregular blebs (inset in L). (M) 7 d after lFPI, densely stained axons formed homogeneous beaded lines (arrowheads) along the inner portion of molecular layer or running into the hilus, which might represent Wallerian degeneration of axons from the entorhinal cortex, or hilar mossy cells, respectively. Scale bars: 50 μm in (A), (B), (K), and (L); 200 μm in (C) and (D); 10 μm in (E)–(J) and (M); 5 μm in (insets in A–D, K, and L), 2 μm in (inset in M).
4. DISCUSSION
For nearly 30 years the APP antibody 22C11 has been routinely used as a biomarker to detect axonal pathology in WM of human brains after TBI. Here we re‐evaluated this antibody in our mouse model of TBI and found that 22C11 was not specific for APP, which greatly confounds its usefulness to assess neurodegeneration. We then tested another APP antibody, Y188, and verified that this antibody was indeed APP‐specific and revealed different forms of pathologies caused by TBI: axonal blebs in gray matter, and puncta and perivascular structures in WM. Y188‐detected axonal blebs were verified in transgenic mice expressing fluorescent tags, or with a NeuroSilver kit. NeuroSilver staining. In WM, however, the Y188‐positive puncta were not neuronal in origin but arose instead from oligodendrocytes (see also below). Our results do not refute the presence of damaged axons in WM, a finding which has been confirmed with a variety of methods including electron microscopy [52, 53], tractography [54, 55], silver staining ([36]; present study) and transgenic labeling ([49]; present study). Our results do, nonetheless, highlight the occurrence of a parallel pathology in WM—damage to oligodendrocytes. Furthermore, we demonstrated basal staining with Y188 in naïve controls that represent true APP immunoreactivity. In contrast, the baseline immunoreactivity of APP has never been revealed by 22C11 staining previously (see “Introduction”).
4.1. Y188 is specific for APP but 22C11 is not
Clone 22C11 (MAB 348, Millipore‐Sigma) is a mouse monoclonal antibody that was produced by immunizing mice with amino acids 66–81 of human APP at the N‐terminus (homologous with mouse N‐terminal peptide). This antibody can recognize all three isoforms of APP (APP695, APP751, and APP770) including the secreted forms (APPsα and/or APPsβ), as well as the homologous APP‐like protein APLP2 [56], a modulator of glucose and insulin homeostasis [57]. In the present study, we showed various staining patterns with 22C11, implying a diversity of its targets. On the other hand, clone Y188 (ab32136, Abcam) is a rabbit monoclonal produced by immunization with a synthetic peptide equivalent to the amino acid sequence 750–770 of human APP at its C‐terminus. Here, we demonstrated clear membrane staining in both excitatory and inhibitory neurons in all areas of the brain, corroborating previous reports that Y188 is specific for APP, while 22C11 [21, 22], as well as seven other nominal APP antibodies, are not specific for APP [22]. We also validated the specificity of Y188 using APP knockout mice, confirming the results shown in a previous study [22], and adding evidence to demonstrate that Y188 is an excellent antibody for APP [21]. As we showed here, 22C11 staining was similar in wild‐type and APP gene knockout mice (also see [22]), further suggesting that 22C11 is not a good marker for APP. CT‐20, another C‐terminal antibody also showed membrane staining of principal cells and interneurons. Most importantly, we successfully identified axonal blebs in GM and puncta in WM after lFPI with both Y188 and CT‐20, but never with 22C11. Consistent with previous studies [51, 58, 59], we strongly believe that C‐terminal antibodies (Y188, CT‐20 and CT 695), but not the N‐terminal antibody (22C11), are specific for detecting TBI‐induced pathologies. Therefore, it may be necessary to revisit previous APP staining data in TBI patients using 22C11 (see “Introduction”). Since the Y188 immunogen (near the C‐terminal of APP) is homologous between the mouse and human, we expect that Y188 can also be used to detect neuropathology in TBI patients.
4.2. Y188‐detected puncta in WM—non‐axonal in origin, perhaps from oligodendrocytes
Y188 intensely stained numerous puncta in WM bundles, sporadically distributed or in large patches. Some of them were arrayed in rows, resembling the morphology of varicosities seen with 22C11 staining (ABC technique) in previous studies on TBI patient samples [7, 12]. Since the term “varicosities” is typically used to refer to beaded axons [60], we have avoided using this terminology here unless verification had been conducted using axonal markers. Initially, we hypothesized that these Y188‐stained puncta were damaged axons due to the interruption of anterograde axonal transport of APP, as previously suggested [7]. However, in transgenic mice expressing YFP in excitatory neurons and tdTomato in PV‐inhibitory neurons, these patches of Y188 stained puncta were discrete from the groups of transgenic fluorescence‐labeled axons, suggesting that the puncta are unlikely to be axonal in origin. Considering that Y188 stained oligodendrocytes in naïve mice, these glial cells would seem like prime candidates for the origin of Y188‐stained puncta in WM after lFPI. It has been demonstrated that APP expression can be upregulated after TBI (see [61] for a review), and at early time points in particular, an upregulation of APP in oligodendrocytes, rather than neurons, may explain our results. The pattern of our WM staining also indicates oligodendrocytes. We knew that Y188 did not stain the whole cell body of an oligodendrocyte evenly. Instead, we demonstrated here an obvious polarity in its cytosolic staining, which were in the form of particles (or puncta, as we have referred to them) much smaller in diameter than the 6–8 μm size of an oligodendrocyte cell body [62]. This could also explain why the size of Y188‐stained axonal blebs or perivascular structures would surpass that of most nearby puncta. Under low magnification, these non‐bleb puncta would show a varicosity‐like (or beaded) appearance in WM, like most oligodendrocytes that are arrayed in parallel rows in WM.
In the present study, we demonstrated Y188 immunoreactivity in oligodendrocytes, contrary to previous data suggesting that Y188 is highly neuron‐specific [22]. We note that Guo et al. [22] used a rat monoclonal antibody against myelin basic protein (MBP) to verify oligodendrocytes. However, while MBP is a good marker for myelin, it is insufficient to stain the nucleus or cell body of an oligodendrocyte. By co‐staining with Y188 and antibodies against the oligodendrocyte transcription factor Olig2, we demonstrated Y188‐stained cell bodies encircling Olig2‐stained nuclei of oligodendrocytes. In addition, we found no staining for either Y188 or Olig2 in the fiber bundle of the dorsal hippocampal commissure, providing indirect support for our immunostaining of APP and oligodendrocytes, since intra‐ and inter‐hippocampal projection fibers are usually unmyelinated [43] and therefore the dorsal hippocampal commissure should be void of oligodendrocytes. Of note here, in situ, hybridization with different RNA probes and immunocytochemistry with several antisera have shown APP expression in cultured oligodendrocytes [63]. Using C‐terminal antibodies CT‐20 or CT695 (but not 22C11), APP immunoreactivity has been clearly demonstrated in neurons and oligodendrocytes from normal or axotomized mice [64], or cultured cortical oligodendrocytes dissociated from rat pups [65]. There is also strong reason to believe that biotin would be up‐regulated after injury, as we discuss below. All these observations are consistent with the presence of APP in oligodendrocytes, such as we demonstrated here. Since Olig2 is a marker for several oligodendrocyte lineage cells, including early oligodendrocyte progenitors [66], the involvement of oligogenesis after TBI [67] should also be taken into account.
4.3. Up‐regulated endogenous biotin confounds immunoperoxidase‐ABC staining
Previous clinical studies performed immunoperoxidase‐ABC staining with 22C11 and revealed intensely stained varicosities or spheroids in WM pathways from paraffin‐embedded patient brains after TBI, with no baseline staining in healthy controls [7]. Using the ABC technique, we here showed varicosity‐like staining of 22C11 in naïve mice and found a dramatic increase in 22C11 staining after lFPI. At the same time, we also found a clear increase in endogenous biotin after injury. For better contrast in the samples, and as an additional check on the 22C11 immunoperoxidase‐ABC staining, we performed immunofluorescent staining with 22C11, using fluorescent dye‐conjugated secondary antibodies to visualize this primary antibody (22C11). Surprisingly, we did not detect any varicosities or spheroids with the fluorescent protocol. The discrepancy between our immunofluorescent findings on mouse brains and previous studies on patient samples may be due to the nature of the respective techniques. Previous studies used 22C11 immunoperoxidase (ABC) staining, leaving open the possibility that changes in staining observed with the ABC protocol may be due to endogenous biotin (if any in the samples). The possibility of interference by endogenous biotin has been an overlooked pitfall in the practice of this technique, even though it was first demonstrated more than two decades ago [48, 68].
There are many reasons to suspect that biotin might be upregulated after TBI. Biotin is a B vitamin, an essential nutrient, and present in all cells, although found at highest concentrations in lipogenic and metabolically active tissue such as liver, kidney, and brain [24, 69]. Of particular relevance to the present and previous studies, major WM pathways are both packed with oligodendrocytes and rich in endogenous biotin [23, 70]. This small molecule is a cofactor for 5 carboxylases [71, 72], four of which are essential for the metabolism of alternative (non‐glucose) energy sources, and one of which (acetyl‐CoA carboxylase) is a key regulatory enzyme in the synthesis of lipids and myelin. Regarding the latter, myelin synthesis increases sharply after injury [52] and it seems likely that the amount of biotinylated acetyl‐CoA carboxylase in oligodendrocytes would also increase after injury. An upregulation of biotin‐dependent alternative energy pathways would also be expected after TBI. Metabolic perturbations are one of the most consistent findings following TBI [73], including a decrease in the metabolism of glucose, and an increase in the metabolism of non‐glucose energy sources such as amino acids, ketone bodies, and fatty acids.
Biotin is ubiquitous but normally present at low levels, and the low baseline levels of biotin may have been missed in earlier studies, even as higher post‐injury levels of biotin were reported. Detection of endogenous biotin by the ABC technique can be affected by several factors. Over fixation and the paraffin embedding process might decrease sensitivity in visualizing endogenous biotin by the ABC method [23]. This may be a particular problem in clinical studies for which postmortem fixation times of up to 3 weeks are not uncommon [8, 9, 10, 11, 14, 15, 16]. Dehydration with ethanol and wax‐melting temperature would also diminish biotin in the tissue [23]. Another factor affecting detection of endogenous biotin may be post‐mortem time (PMT, the duration from patient death to sample fixation) since complicated biological and/or morphological alterations might occur during PMT [74, 75]. Keeping an identical PMT among human cases is impractical. In some cases, the whole process might just take a few hours. In other cases, however, it might be extended to days [67, 76, 77, 78]. During the first hours after death, the gross morphological integrity of neurons and glial cells might not be significantly altered. At this same time, however, dramatic changes can occur at the neurohistochemical level for a wide variety of neuronal and glial markers [74, 75], and potentially change immunohistochemical staining results. All these factors might contribute to the uneven staining among human cases: low levels of endogenous biotin in healthy brain tissue might become undetectable due to such signal‐dampening effects, while higher levels might remain detectable in patients suffering TBI or other neuropathological diseases. In these patients, elevated endogenous biotin after TBI might be anticipated, given the results of the present study. Considering all of the factors which can affect the detection of endogenous biotin, a careful reappraisal of the existing TBI and neurodegeneration literature may be necessary, in order to correctly interpret previous reports relying on immunoperoxidase‐ABC staining.
4.4. A new hypothesis for post‐injury neurodegeneration
Using immunoperoxidase‐ABC staining with 22C11 previous researchers showed varicosities and spheroids in WM bundles in patient brains after TBI (reviewed in [7]). Although these WM structures had not been conclusively identified as axonal by using axon‐specific markers, they were interpreted as axonal swellings due to the disruption of axonal transport in injured axons, resulting in APP accumulation in axon segments. Such speculation is not unreasonable, as axonal swelling can indeed indicate DAI, which eventually leads to neural dysfunction (Figure 15, left panel). In the present study, however, while we occasionally found varicosity‐like deformation of fluorescent axons in transgenic mice after lFPI (Figures 12, 13), these deformed axons were never positive to Y188. We did, however, demonstrate varicosity‐like WM structures that were positive for Y188 and the oligodendrocyte marker Olig2. We also found axonal truncation in gray and WM, and oligodendrocyte damage in WM using immunofluorescent staining with Y188, but never with 22C11 immunofluorescent staining. As an alternative to the traditional hypothesis that axon damage leads to axonal transport disruption, swelling, and then secondary disconnection and Wallerian degeneration, we propose that there may be two avenues to neuron death and loss: (1) traumatic axonal truncation leading to neuron death and loss, and (2) oligodendrocyte damage followed by demyelination and/or Wallerian degeneration in WM bundles. To track the timeline from oligodendrocyte damage to axonal injury in WM bundles, transgenic mice expressing eGFP in oligodendrocytes [79, 80] may be helpful. Neuron loss and axon damage‐induced denervation would result in neural dysfunction (Figure 15, right panel), as shown in electrophysiological recordings from the cortex and hippocampus [5, 6]. Induced death of the parent neurons by axonal truncation remains speculative as it has not been confirmed with cell death markers [51], possibly due to the delay between the emergence of axonal blebs and the condensation of parent cell bodies as shown in our staining with Y188 (Figure 6D, E). In vivo, two‐photon microscopy would be an ideal tool for tracking an injured YFP neuron from the appearance of a labeled axonal bleb immediately after lFPI, to the disappearance of the parent cell body about 1 week later.
FIGURE 15.

Summary diagram comparing two hypotheses on TBI consequences, suggested in different studies. (Left panel) By interpreting 22C11‐stained varicosities and spheroids persistent in WM as APP‐positive axonal swelling, previous studies on patient TBI have hypothesized that TBI‐induced disruption of axonal transport results in APP accumulation in axons, leading to axonal swelling (or damage) and neural dysfunction. (Right panel) Our data suggest an alternative hypothesis. Based on the observation of axonal blebs in gray matter and clusters of puncta in WM immediately after TBI, and condensed neuronal cell bodies and Wallerian degeneration at later stages, the present study suggests that TBI‐induced axonal truncation may initiate neuronal loss, and oligodendrocyte damage can cause demyelination and Wallerian degeneration of axons. Therefore, post‐TBI neural dysfunction may be a combined consequence of traumatic axonal truncation and oligodendrocyte damage. Stained pathologies in parentheses are interpreted as damaged structures in each hypothesis. Time window of observation, and staining method(s) for each pathology are also listed.
Although proof for the axonal transport disruption hypothesis (Figure 15, left panel) is missing key supporting evidence that these structures described are actually axons, the varicosities and/or spheroids stained in WM by 22C11 immunoperoxidase‐ABC protocol might nonetheless partially overlap with the Y188‐stained pathologies we demonstrated here (Figure 15, right panel). It is not clear what 22C11 actually does bind, but our results indicate that it is neither APP nor any antigen present in excitatory axons or PV inhibitory axons. As such, 22C11‐stained varicosities and/or spheroids seem especially unlikely to represent injured and swollen axons filled with APP that was specifically recognized by the primary antibody 22C11, as claimed previously (See “Introduction”). Instead, the structures stained when 22C11 was visualized with the ABC protocol are likely to be damaged oligodendrocytes with an upregulated level of endogenous biotin that was coincidently stained by the ABC protocol. As to the axon‐like or fiber‐like appearance among 22C11‐stained varicosities in WM bundles from patient brains, branches of astrocytes should have been excluded, since these fibrous glial cells can also be stained by 22C11 ([81, 82, 83]; present study).
5. CONCLUSION
Interpreting prior reports of 22C11 plus ABC protocol staining as indicating APP in neurons likely obscures the injury mechanism following TBI. Our findings presented here are more than just a cautionary tale for investigators using antibody 22C11 to target APP, or using an ABC kit to visualize secondary antibodies after injury. Our results point toward a novel and unexpected explanation for the axonal pathology consistently observed after TBI and suggest a promising new direction for the development of effective TBI treatments.
AUTHOR CONTRIBUTIONS
Guoxiang Xiong (designed the study; performed experiments; collected, analyzed and interpreted data; edited the manuscript). Hannah Metheny (performed experiments; collected data and revised manuscript). Kaitlin Hood (performed experiments; collected data and revised manuscript). Ian Jean (performed experiments; collected data and revised manuscript). Brian N. Johnson (interpreted data; edited manuscript). Tummala Shanti (performed experiments; collected data and revised manuscript). Noam A. Cohen (interpreted data; revised manuscript). Akiva S. Cohen (designed the study; revised the manuscript).
FUNDING INFORMATION
National Institute of Health funding (R37HD059288 to ASC).
CONFLICT OF INTEREST STATEMENT
No conflict of interest will be claimed.
ACKNOWLEDGMENTS
The authors sincerely thank Dr. Matsuo Matsushita (Professor Emeritus, University of Tsukuba, Ibaraki, Japan) for his invaluable help on defining anatomical and histological structures of the brain. We are grateful to Dr. David F. Meaney (School of Engineering and Applied Sciences, University of Pennsylvania) for his generous gift of CCI mice we used for detecting neurodegeneration in preliminary tests.
Xiong G, Metheny H, Hood K, Jean I, Farrugia AM, Johnson BN, et al. Detection and verification of neurodegeneration after traumatic brain injury in the mouse: Immunohistochemical staining for amyloid precursor protein. Brain Pathology. 2023;33(6):e13163. 10.1111/bpa.13163
DATA AVAILABILITY STATEMENT
Data will be available for sharing upon request.
REFERENCES
- 1. Coronado VG, Xu L, Basavaraju SV, McGuire LC, Wald MM, Faul MD, et al. Surveillance for traumatic brain injury‐related deaths—United States, 1997–2007. MMWR Surveill Summ. 2011;60:1–32. [PubMed] [Google Scholar]
- 2. Adams JH, Doyle D, Ford I, Gennarelli TA, Graham DI, McLellan DR. Diffuse axonal injury in head injury: definition, diagnosis and grading. Histopathology. 1989;15:49–59. [DOI] [PubMed] [Google Scholar]
- 3. Adams JH, Graham DI, Murray LS, Scott G. Diffuse axonal injury due to nonmissile head injury in humans: an analysis of 45 cases. Ann Neurol. 1982;12:557–63. [DOI] [PubMed] [Google Scholar]
- 4. Povlishock JT. Traumatically induced axonal injury: pathogenesis and pathobiological implications. Brain Pathol. 1992;2:1–12. [PubMed] [Google Scholar]
- 5. Smith CJ, Xiong G, Elkind JA, Putnam B, Cohen AS. Brain injury impairs working memory and prefrontal circuit function. Front Neurol 2015 Nov 13. 2015;6:240. 10.3389/fneur.2015.00240 [DOI] [PMC free article] [PubMed] [Google Scholar]
- 6. Witgen BM, Lifshitz J, Smith ML, Schwarzbach E, Liang S‐L, Grady MS, et al. Regional hippocampal alteration associated with cognitive deficit following experimental brain injury: a systems, network and cellular evaluation. Neuroscience. 2005;133:1–15. 10.1016/j.neuroscience.2005.01.052 [DOI] [PubMed] [Google Scholar]
- 7. Johnson VE, Stewart W, Smith DH. Axonal pathology in traumatic brain injury. Exp Neurol. 2013;246:35–43. [DOI] [PMC free article] [PubMed] [Google Scholar]
- 8. Gentleman SM, Nash MJ, Sweeting CJ, Graham DI, Roberts GW. Beta‐amyloid precursor protein (beta APP) as a marker for axonal injury after head injury. Neurosci Lett. 1993;160:139–44. [DOI] [PubMed] [Google Scholar]
- 9. Gentleman SM, Roberts GW, Gennarelli TA, Maxwell WL, Adams JH, Kerr S, et al. Axonal injury: a universal consequence of fatal closed head injury? Acta Neuropathol. 1995;89:537–43. [DOI] [PubMed] [Google Scholar]
- 10. Graham DI, Smith C, Reichard R, Leclercq PD, Gentleman SM. Trials and tribulations of using beta‐amyloid precursor protein immunohistochemistry to evaluate traumatic brain injury in adults. Forensic Sci Int. 2004;146:89–96. [DOI] [PubMed] [Google Scholar]
- 11. Hortobágyi T, Wise S, Hunt N, Cary N, Djurovic V, Fegan‐Earl A, et al. Traumatic axonal damage in the brain can be detected using beta‐APP immunohistochemistry within 35 min after head injury to human adults. Neuropathol Appl Neurobiol. 2007;33:226–37. 10.1111/j.1365-2990.2006.00794.x [DOI] [PubMed] [Google Scholar]
- 12. Johnson VE, Stewart W, Weber MT, Cullen DK, Siman R, Smith DH. SNTF immunostaining reveals previously undetected axonal pathology in traumatic brain injury. Acta Neuropathol. 2016;131:115–35. [DOI] [PMC free article] [PubMed] [Google Scholar]
- 13. Koch PF, Cottone C, Adam CD, Ulyanova AV, Russo RJ, Weber MT, et al. Traumatic brain injury preserves firing rates but disrupts laminar oscillatory coupling and neuronal entrainment in hippocampal CA1. eNeuro 2020 Sep 2. 2020;7(5):eNeuro.0495‐19.2020. 10.1523/ENEURO.0495-19.2020 [DOI] [PMC free article] [PubMed] [Google Scholar]
- 14. Reichard RR, Smith C, Graham DI. The significance of beta‐APP immunoreactivity in forensic practice. Neuropathol Appl Neurobiol. 2005;31:304–13. [DOI] [PubMed] [Google Scholar]
- 15. Sherriff FE, Bridges LR, Gentleman SM, Sivaloganathan S, Wilson S. Markers of axonal injury in post mortem human brain. Acta Neuropathol. 1994a;88:433–9. [DOI] [PubMed] [Google Scholar]
- 16. Sherriff FE, Bridges LR, Sivaloganathan S. Early detection of axonal injury after human head trauma using immunocytochemistry for beta‐amyloid precursor protein. Acta Neuropathol. 1994b;87:55–62. [DOI] [PubMed] [Google Scholar]
- 17. Ryu J, Horkayne‐Szakaly I, Xu L, Pletnikova O, Leri F, Eberhart C, et al. The problem of axonal injury in the brains of veterans with histories of blast exposure. Acta Neuropathol Commun. 2014;25(2):153. 10.1186/s40478-014-0153-3 [DOI] [PMC free article] [PubMed] [Google Scholar]
- 18. Johnson NB, Palmer CP, Bourgeois EB, Elkind JA, Putnam BJ, Cohen AS. Augmented inhibition from cannabinoid‐sensitive interneurons diminishes CA1 output after traumatic brain injury. Front Cell Neurosci 2014 Dec 19. 2014;8:435. 10.3389/fncel.2014.00435 [DOI] [PMC free article] [PubMed] [Google Scholar]
- 19. Schwarzbach E, Bonislawski DP, Xiong G, Cohen AS. Mechanisms underlying the inability to induce area CA1 LTP in the mouse after traumatic brain injury. Hippocampus. 2006;16:541–50. [DOI] [PMC free article] [PubMed] [Google Scholar]
- 20. Xiong G, Elkind JA, Kundu S, Smith CJ, Antunes MB, Tamashiro E, et al. Traumatic brain injury‐induced ependymal ciliary loss decreases cerebral spinal fluid flow. J Neurotrauma. 2014;31:1396–404. 10.1089/neu.2013.3110 [DOI] [PMC free article] [PubMed] [Google Scholar]
- 21. Del Turco D, Paul MH, Schlaudraff J, Hick M, Endres K, Müller UC, et al. Region‐specific differences in amyloid precursor protein expression in the mouse hippocampus. Front Mol Neurosci 2016 Nov 29. 2016;9:134. [DOI] [PMC free article] [PubMed] [Google Scholar]
- 22. Guo Q, Li H, Gaddam SS, Justice NJ, Robertson CS, Zheng H. Amyloid precursor protein revisited: neuron‐specific expression and highly stable nature of soluble derivatives. J Biol Chem. 2012;287:2437–45. 10.1074/jbc.M111.315051 [DOI] [PMC free article] [PubMed] [Google Scholar]
- 23. McKay BE, Molineux ML, Turner RW. Biotin is endogenously expressed in select regions of the rat central nervous system. J Comp Neurol. 2004;473:86–96. 10.1002/cne.20109 [DOI] [PubMed] [Google Scholar]
- 24. Wang H, Pevsner J. Detection of endogenous biotin in various tissues: novel functions in the hippocampus and implications for its use in avidin‐biotin technology. Cell Tissue Res. 1999;296:511–6. 10.1007/s004410051311 [DOI] [PubMed] [Google Scholar]
- 25. National Research Council . National Science Education Standards. Washington, DC: The National Academies Press; 1996. [Google Scholar]
- 26. Vascak M, Sun J, Baer M, Jacobs KM, Povlishock JT. Mild traumatic brain injury evokes pyramidal neuron axon initial segment plasticity and diffuse presynaptic inhibitory terminal loss. Front Cell Neurosci 2017 Jun 6. 2017;11:157. 10.3389/fncel.2017.00157 [DOI] [PMC free article] [PubMed] [Google Scholar]
- 27. Porrero C, Rubio‐Garrido P, Avendaño C, Clascá F. Mapping of fluorescent protein‐expressing neurons and axon pathways in adult and developing Thy1‐eYFP‐H transgenic mice. Brain Res. 2010;1345:59–72. 10.1016/j.brainres.2010.05.061 [DOI] [PubMed] [Google Scholar]
- 28. Feng G, Mellor RH, Bernstein M, Keller‐Peck C, Nguyen QT, Wallace M, et al. Imaging neuronal subsets in transgenic mice expressing multiple spectral variants of GFP. Neuron. 2000;28:41–51. [DOI] [PubMed] [Google Scholar]
- 29. Mao S, Xiong G, Zhang L, Dong H, Liu B, Cohen NA, et al. Verification of the cross immunoreactivity of A60, a mouse monoclonal antibody against neuronal nuclear protein. Front Neuroanat 2016 May 13. 2016;10:54. 10.3389/fnana.2016.00054 [DOI] [PMC free article] [PubMed] [Google Scholar]
- 30. Xiong G, Zhang L, Mojsilovic‐Petrovic J, Arroyo E, Elkind J, Kundu S, et al. GABA and glutamate are not colocalized in mossy fiber terminals of developing rodent hippocampus. Brain Res. 2012;1474:40–9. [DOI] [PMC free article] [PubMed] [Google Scholar]
- 31. Schmued LC, Stowers CC, Scallet AC, Xu L. Fluoro‐jade C results in ultrahigh resolution and contrast labeling of degenerating neurons. Brain Res. 2005;1035:24–31. [DOI] [PubMed] [Google Scholar]
- 32. Erickson PA, Lewis GP, Fisher SK. Postembedding immunocytochemical techniques for light and electron microscopy. Methods Cell Bio. 1993;37:283–310. [DOI] [PubMed] [Google Scholar]
- 33. Mao S, Xiong G, Johnson NB, Cohen NA, Cohen AS. Blocking cross immunoreactivity when performing indirect double staining with mouse and rat primary antibodies in mouse brain slices. Front Neurosci 2021 May 25. 2021;15:579859. 10.3389/fnins.2021.579859 [DOI] [PMC free article] [PubMed] [Google Scholar]
- 34. Golding EM, Robertson CS, Bryan RM Jr. The consequences of traumatic brain injury on cerebral blood flow and autoregulation: a review. Clin Exp Hypertens. 1999;21:299–332. 10.3109/10641969909068668 [DOI] [PubMed] [Google Scholar]
- 35. Xiong G, Matsushita M. Connections of Purkinje cell axons of lobule X with vestibulospinal neurons projecting to the cervical cord in the rat. Exp Brain Res 2000 Apr. 2000;131(4):491–9. 10.1007/s002219900306 [DOI] [PubMed] [Google Scholar]
- 36. Koliatsos VE, Cernak I, Xu L, Song Y, Savonenko A, Crain BJ, et al. A mouse model of blast injury to brain: initial pathological, neuropathological, and behavioral characterization. J Neuropathol Exp Neurol. 2011;70:399–416. 10.1097/NEN.0b013e3182189f06 [DOI] [PubMed] [Google Scholar]
- 37. Du F, Eid T, Schwarcz R. Neuronal damage after the injection of aminooxyacetic acid into the rat entorhinal cortex: a silver impregnation study. Neuroscience. 1998;82:1165–78. [DOI] [PubMed] [Google Scholar]
- 38. Gallyas F, Wolff JR, Böttcher H, Záborszky L. A reliable method for demonstrating axonal degeneration shortly after axotomy. Stain Technol. 1980;55:291–7. 10.3109/10520298009067257 [DOI] [PubMed] [Google Scholar]
- 39. Yang L‐Y, Chu Y‐H, Tweedie D, Yu Q‐S, Pick CG, Hoffer BJ, et al. Post‐trauma administration of the pifithrin‐α oxygen analog improves histological and functional outcomes after experimental traumatic brain injury. Exp Neurol. 2015;269:56–66. 10.1016/j.expneurol.2015.03.015 [DOI] [PMC free article] [PubMed] [Google Scholar]
- 40. Yang LY, Greig NH, Tweedie D, Jung YJ, Chiang YH, Hoffer BJ, et al. The p53 inactivators pifithrin‐μ and pifithrin‐α mitigate TBI‐induced neuronal damage through regulation of oxidative stress, neuroinflammation, autophagy and mitophagy. Exp Neurol 2020 Feb. 2020;324:113135. 10.1016/j.expneurol.2019.113135 [DOI] [PMC free article] [PubMed] [Google Scholar]
- 41. Hick M, Herrmann U, Weyer SW, Mallm JP, Tschäpe JA, Borgers M, et al. Acute function of secreted amyloid precursor protein fragment APPsα in synaptic plasticity. Acta Neuropathol. 2015;129:21–37. [DOI] [PubMed] [Google Scholar]
- 42. Müller UC, Deller T, Korte M. Not just amyloid: physiological functions of the amyloid precursor protein family. Nat Rev Neurosci. 2017;18:281–98. 10.1038/nrn.2017.29 [DOI] [PubMed] [Google Scholar]
- 43. Debanne D, Campanac E, Bialowas A, Carlier EW, JLGless A. Axon physiology. Physiol Rev. 2011;91:555–602. [DOI] [PubMed] [Google Scholar]
- 44. Hu W, Shu Y. Axonal bleb recording. Neurosci Bull. 2012;28:342–50. 10.1007/s12264-012-1247-1 [DOI] [PMC free article] [PubMed] [Google Scholar]
- 45. Xiong G, Metheny H, Johnson BN, Cohen AS. A comparison of different slicing planes in preservation of major hippocampal pathway fibers in the mouse. Front Neuroanat. 2017;11:107. 10.3389/fnana.2017.00107 [DOI] [PMC free article] [PubMed] [Google Scholar]
- 46. Cole JT, Mitala CM, Kundu S, Verma A, Elkind JA, Nissim I, et al. Dietary branched chain amino acids ameliorate injury‐induced cognitive impairment. PNAS. 2010;107:366–71. [DOI] [PMC free article] [PubMed] [Google Scholar]
- 47. Wu JC‐C, Chen K‐Y, Yo Y‐W, Huang S‐W, Shih H‐M, Chiu W‐T, et al. Different sham procedures for rats in traumatic brain injury experiments induce corresponding increases in levels of trauma markers. J Surg Res. 2013;179:138–44. [DOI] [PubMed] [Google Scholar]
- 48. Bhattacharjee J, Cardozo BN, Kamphuis W, Kamermans M, Vrensen GF. Pseudo‐immunolabelling with the avidin‐biotin‐peroxidase complex (ABC) due to the presence of endogenous biotin in retinal Müller cells of goldfish and salamander. J Neurosci Methods. 1997;77:75–82. 10.1016/s0165-0270(97)00114-3 [DOI] [PubMed] [Google Scholar]
- 49. Hånell A, Greer JE, McGinn MJ, Povlishock JT. Traumatic brain injury‐induced axonal phenotypes react differently to treatment. Acta Neuropathol. 2015;129:317–32. [DOI] [PubMed] [Google Scholar]
- 50. Zurita H, Feyen PLC, Apicella AJ. Layer 5 callosal parvalbumin‐expressing neurons: a distinct functional group of GABAergic neurons. Front Cell Neurosci. 2018;12:53. 10.3389/fncel.2018.00053 [DOI] [PMC free article] [PubMed] [Google Scholar]
- 51. Singleton RH, Zhu J, Stone JR, Povlishock JT. Traumatically induced axotomy adjacent to the soma does not result in acute neuronal death. JNS. 2002;22:791–802. [DOI] [PMC free article] [PubMed] [Google Scholar]
- 52. Mierzwa AJ, Marion CM, Sullivan GM, McDaniel DP, Armstrong RC. Components of myelin damage and repair in the progression of white matter pathology after mild traumatic brain injury. J Neuropathol Exp Neurol. 2015;74:218–32. [DOI] [PMC free article] [PubMed] [Google Scholar]
- 53. Ziogas NK, Koliatsos VE. Primary traumatic axonopathy in mice subjected to impact acceleration: a reappraisal of pathology and mechanisms with high‐resolution anatomical methods. JNS. 2018;38:4031–47. [DOI] [PMC free article] [PubMed] [Google Scholar]
- 54. Hayes JP, Bigler ED, Verfaellie M. Traumatic brain injury as a disorder of brain connectivity. J Int Neuropsychol Soc. 2016;22:120–13. [DOI] [PMC free article] [PubMed] [Google Scholar]
- 55. Nolan AL, Petersen C, Iacono D, Mac Donald CL, Mukherjee P, van der Kouwe A, et al. Tractography‐pathology correlations in traumatic brain injury: a TRACK‐TBI study. J Neurotrauma. 2021;38:1620–31. [DOI] [PMC free article] [PubMed] [Google Scholar]
- 56. Slunt HH, Thinakaran G, Von Koch C, Lo AC, Tanzi RE, Sisodia SS. Expression of a ubiquitous, cross‐reactive homologue of the mouse beta‐amyloid precursor protein (APP). J Biol Chem. 1994;269:2637–244. [PubMed] [Google Scholar]
- 57. Needham BE, Wlodek ME, Ciccotosto GD, Fam BC, Masters CL, Proietto J, et al. Identification of the Alzheimer's disease amyloid precursor protein (APP) and its homologue APLP2 as essential modulators of glucose and insulin homeostasis and growth. J Pathol. 2008;215:155–263. 10.1002/path.2343 [DOI] [PubMed] [Google Scholar]
- 58. Stone JR, Singleton RH, Povlishock JT. Antibodies to the C‐terminus of the b‐amyloid precursor protein (APP): a site specific marker for the detection of traumatic axonal injury. Brain Res. 2000;871:288–302. [DOI] [PubMed] [Google Scholar]
- 59. Wang J, Hamm RJ, Povlishock JT. Traumatic axonal injury in the optic nerve: evidence for axonal swelling, disconnection, dieback, and reorganization. J Neurotrauma. 2011;28:1185–98. [DOI] [PMC free article] [PubMed] [Google Scholar]
- 60. Mamounas LA, Mullen CA, O'hearn E, Molliver ME. Dual serotoninergic projections to forebrain in the rat: morphologically distinct 5‐HT axon terminals exhibit differential vulnerability to neurotoxic amphetamine derivatives. J Comp Neurol. 1991;314:558–86. [DOI] [PubMed] [Google Scholar]
- 61. Plummer S, Van den Heuvel C, Thornton E, Corrigan F, Roberto Cappai R. The neuroprotective properties of the amyloid precursor protein following traumatic brain injury. Aging Dis. 2016;7:163–79. 10.14336/AD.2015.0907 [DOI] [PMC free article] [PubMed] [Google Scholar]
- 62. Karasek M, Swiltosławski J, Zielińiska A. Ultrastructure of the central nervous system: the basics. Folia Neuropathol. 2004;42 Suppl B:1–9. [PubMed] [Google Scholar]
- 63. Garcia‐Ladona FJ, Huss Y, Frey P, Ghandour MS. Oligodendrocytes express different isoforms of beta‐amyloid precursor protein in chemically defined cell culture conditions: in situ hybridization and immunocytochemical detection. J Neurosci Res. 1997;50:50–61. [DOI] [PubMed] [Google Scholar]
- 64. Palacios G, Palacios JM, Mengod G, Frey P. Beta‐amyloid precursor protein localization in the Golgi apparatus in neurons and oligodendrocytes. An immunocytochemical structural and ultrastructural study in normal and axotomized neurons. Brain Res Mol Brain Res. 1992;15:195–206. 10.1016/0169-328x(92)90109-o [DOI] [PubMed] [Google Scholar]
- 65. Skaper SD, Evans NA, Soden PE, Rosin C, Facci L, Richardson JC. Oligodendrocytes are a novel source of amyloid peptide generation. Neurochem Res. 2009;34:2243–50. 10.1007/s11064-009-0022-9 [DOI] [PubMed] [Google Scholar]
- 66. Delgado AC, Maldonado‐Soto AR, Silva‐Vargas V, Dogukan M, von Kanel T, Tan KR, et al. Release of stem cells from quiescence reveals gliogenic domains in the adult mouse brain. Science. 2021;372:1205–9. [DOI] [PubMed] [Google Scholar]
- 67. Flygt J, Gumucio A, Ingelsson M, Skoglund K, Holm J, Alafuzoff I, et al. Human traumatic brain injury results in oligodendrocyte death and increases the number of oligodendrocyte progenitor cells. J Neuropathol Exp Neurol. 2016;75:503–15. 10.1093/jnen/nlw025 [DOI] [PubMed] [Google Scholar]
- 68. McKay BE, Molineux ML, Turner RW. Endogenous biotin in rat brain: implications for false‐positive results with avidin‐biotin and streptavidin‐biotin techniques. Methods Mol Biol. 2008;418:111–28. 10.1385/1-59745-579-2:111 [DOI] [PubMed] [Google Scholar]
- 69. Wood GS, Warnke R. Suppression of endogenous avidin‐binding activity in tissues and its relevance to biotin‐avidin detection systems. J Histochem Cytochem. 1981;29:1196–204. [DOI] [PubMed] [Google Scholar]
- 70. LeVine SM, Macklin MB. Biotin enrichment in oligodendrocytes in the rat brain. Brain Res. 1988;444:199–203. [DOI] [PubMed] [Google Scholar]
- 71. Dakshinamurti K, Chauhan J. Biotin. Vitam Horm. 1989;45:337–84. 10.1016/s0083-6729(08)60398-2 [DOI] [PubMed] [Google Scholar]
- 72. Zempleni J, Wijeratne SSK, Hassan YI. Biotin. Biofactors. 2009;35:36–46. [DOI] [PMC free article] [PubMed] [Google Scholar]
- 73. DeVience SJ, Lu X, Proctor J, Rangghran P, Melhem ER, Gullapalli R, et al. Metabolic imaging of energy metabolism in traumatic brain injury using hyperpolarized [1‐ 13 C]pyruvate. Sci Rep. 2017;7:1907. 10.1038/s41598-017-01736-x [DOI] [PMC free article] [PubMed] [Google Scholar]
- 74. Dachet F, Brown JB, Valyi‐Nagy T, Narayan KD, Serafini A, Boley N, et al. Selective time‐dependent changes in activity and cell‐specific gene expression in human postmortem brain. Sci Rep. 2021;11:85801–6. 10.1038/s41598-021-85801-6 [DOI] [PMC free article] [PubMed] [Google Scholar]
- 75. Gonzalez‐Riano C, Tapia‐González S, García A, Muñoz A, DeFelipe J, Barbas C. Metabolomics and neuroanatomical evaluation of post‐mortem changes in the hippocampus. Brain Struct Funct. 2017;222:2831–53. [DOI] [PMC free article] [PubMed] [Google Scholar]
- 76. Chen X‐H, Johnson VE, Uryu H, Trojanowski JQ, Smith DH. A lack of amyloid beta plaques despite persistent accumulation of amyloid beta in axons of long‐term survivors of traumatic brain injury. Brain Pathol. 2009;19:214–23. 10.1111/j.1750-3639.2008.00176.x [DOI] [PMC free article] [PubMed] [Google Scholar]
- 77. Christman CW, Grady MS, Walker SA, Holloway KL, Povlishock JT. Ultrastructural studies of diffuse axonal injury in humans. J Neurotrauma. 1994;11:173–86. [DOI] [PubMed] [Google Scholar]
- 78. Grady MS, McLaughlin MR, Christman CW, Valadka AB, Fligner CL, Povlishock JT. The use of antibodies targeted against the neurofilament subunits for the detection of diffuse axonal injury in humans. J Neuropathol Exp Neurol. 1993;52:143–52. [DOI] [PubMed] [Google Scholar]
- 79. Hughes EG, Orthmann‐Murphy JL, Langseth AJ, Bergles DE. Myelin remodeling through experience‐dependent oligodendrogenesis in the adult somatosensory cortex. Nat Neurosci. 2018;21:696–706. 10.1038/s41593-018-0121-5 [DOI] [PMC free article] [PubMed] [Google Scholar]
- 80. Orthmann‐Murphy J, Call CL, Molina‐Castro GC, Hsieh YC, Rasband MN, Calabresi PA, et al. Remyelination alters the pattern of myelin in the cerebral cortex. eLife 2020 May 27. 2020;9:e56621. 10.7554/eLife.56621 [DOI] [PMC free article] [PubMed] [Google Scholar]
- 81. Chauvet N, Apert C, Dumoulin A, Epelbaum J, Alonso G. Mab22C11 antibody to amyloid precursor protein recognizes a protein associated with specific astroglial cells of the rat central nervous system characterized by their capacity to support axonal outgrowth. J Comp Neurol. 1997;377:550–64. [PubMed] [Google Scholar]
- 82. Yasuoka K, Hirata K, Kuraoka A, He J, Kawabuchi M. Expression of amyloid precursor protein‐like molecule in astroglial cells of the subventricular zone and rostral migratory stream of the adult rat forebrain. J Anat. 2004;205:135–46. [DOI] [PMC free article] [PubMed] [Google Scholar]
- 83. Young MJ, Lee RK, Jhaveri S, Wurtman RJ. Intracellular and cell surface distribution of amyloid precursor protein in cortical astrocytes. Brain Res Bull. 1999;50:27–32. [DOI] [PubMed] [Google Scholar]
Associated Data
This section collects any data citations, data availability statements, or supplementary materials included in this article.
Data Availability Statement
Data will be available for sharing upon request.