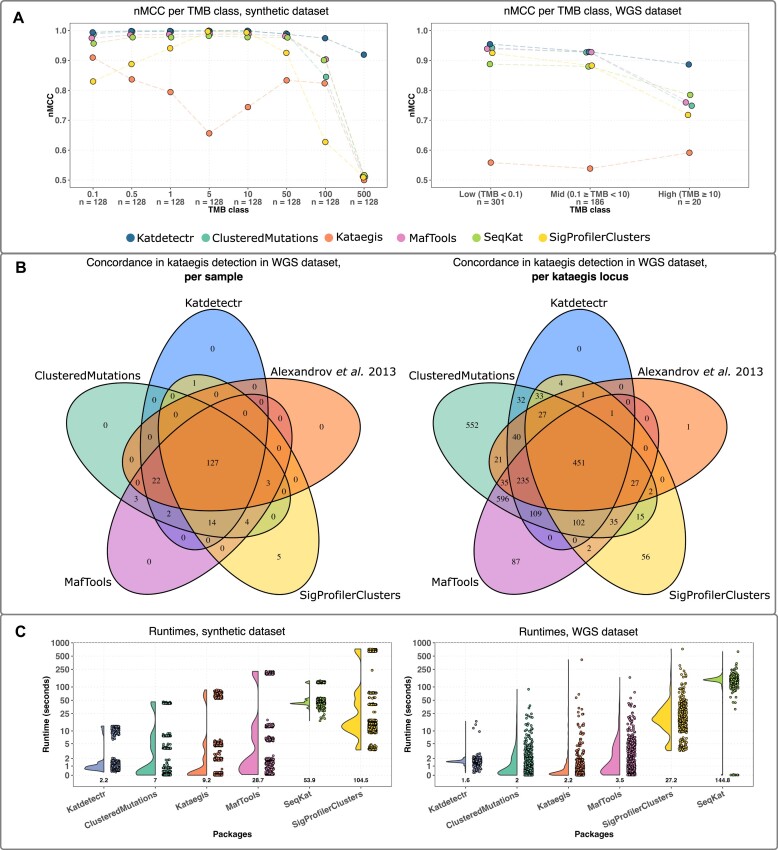
Figure 2:
Performance evaluation of kataegis detection tools. (A) The normalized Matthews correlation coefficient (nMCC) per package and tumor mutational burden (TMB) class are depicted by individual data points connected with a dashed line (colored per package). (B) Venn diagrams showing the concordance between Katdetectr, SigProfilerClusters, MafTools, ClusteredMutations, and Alexandrov et al. regarding kataegis classification per sample (i.e., does a sample contain 1 or more kataegis loci) and per kataegis loci (i.e., does a detected kataegis locus overlap with a kataegis locus detected by another package). (C) Boxplots with individual data points represent the per sample runtimes of kataegis detection packages on the synthetic and whole-genome sequence datasets. Boxplots were sorted in ascending order based on mean runtime (depicted in the text below the boxplot). Y-axis is log10-scaled. Boxplots depict the interquartile range, with the median as a black horizontal line.

