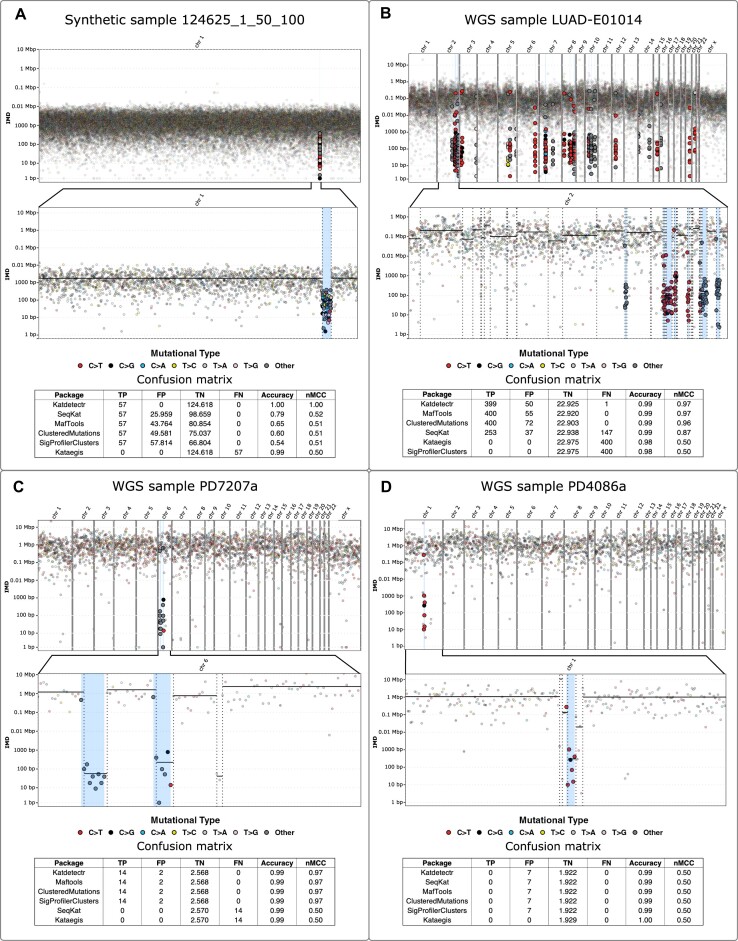
Figure 3:
Rainfall plots constructed by Katdetectr and confusion matrices, accuracy, and nMCC for 4 samples. (A) Synthetic sample 124625_1_50_100 with tumor mutational burden (TMB): 500. (B) Lung adenocarcinoma whole-genome sequenced (WGS) sample LUAD-E01014 with TMB: 7.6. (C) Breast cancer WGS sample PD7207a with TMB: 2.5. (D) Breast cancer WGS sample PD4086a with TMB: 0.62. The WGS samples were collected and labeled for kataegis by Alexandrov et al. [2]; their results were used as ground truth to construct the confusion matrices and performance metrics. Rainfall plot: y-axis: IMD, x-axis: variant ID ordered on genomic location, light blue rectangles: kataegis loci with genomic variants within kataegis loci shown in bold. The color depicts the mutational type. The vertical lines represent detected changepoints, while black horizontal solid lines show the mean IMD of each segment. Confusion matrix: true positive (TP), false positive (FP), true negative (TN), false negative (FN), accuracy, and normalized Matthews correlation coefficient (nMCC).

