Abstract
Background
The regimen of nivolumab plus ipilimumab (NI) has been recommended by the National Comprehensive Cancer Network Clinical Practice Guidelines in Oncology-Malignant Pleural Mesothelioma (Version 1.2022) and Chinese Guidelines for the Clinical Diagnosis and Treatment of Malignant Pleural Mesothelioma (2021 edition) as the first-line treatment for Malignant Pleural Mesothelioma (MPM). But whether immunotherapy has a financial advantage over conventional chemotherapy (pemetrexed plus cisplatin/carboplatin, C) is uncertain.
Methods
Based on survival and safety data from the CheckMate 743 clinical trial (NCT02899299), a partitioned survival model was constructed using TreeAge Pro2022 software. The model cycle was set to 1 month and the study period was 10 years. The output indicators included total cost, quality-adjusted life year (QALY) and incremental cost-effectiveness ratio (ICER). One-way and probabilistic sensitivity analyses were used to assess the robustness of the results, considering only direct medical costs.
Results and discussion
The ICER for group NI versus Group C was $375,656/QALY in all randomized patients, $327,943/QALY in patients with epithelioid histology, and $115,495/QALY in patients with non-epithelioid histology. The ICERs of all three different populations all exceeded the willingness-to-pay threshold (three times the per capita gross domestic product of China in 2021). The results of univariate sensitivity analysis showed that the price of pemetrexed and nivolumab had great influence on the analysis results. The results of the probabilistic sensitivity analysis show that the probability of the NI scheme being more economical in all three different populations was 0.
What is new and conclusion
From the perspective of the Chinese healthcare system, in patients with unresectable MPM, NI has no economic advantage over C.
Keyword: Cost-effectiveness, Malignant pleural mesothelioma, Nivolumab, Ipilimumab, First-line treatment
Background
Mesothelioma is a rare tumor that arises from mesothelial cells in the pleura or elsewhere, of which approximately 81% originate from the pleura [1]. Malignant pleural mesothelioma (MPM) is a rare and fatal cancer with high invasiveness and a 5-year survival rate of only about 10% [2]. From 2004 to October 2020, platinum plus folic acid antimetabolizers (e.g., pemetrexed) were the only approved first-line treatment for MPM [3, 4]. However, the long-term survival outcome of chemotherapy remains poor [5–8]. In recent years, bevacizumab has been used to treat MPM, but its use varies by region [9]. A randomized, double-blind phase III trial (CheckMate 743) compared the safety and efficacy of first-line treatment for unresectable MPM with nivolumab plus ipilimumab (NI) or pemetrexed plus cisplatin/carboplatin (C). The results showed that NI significantly prolonged the median overall survival (OS) compared with C (14.1 months, 95% CI 12.4–16.3 months versus 18.1 months, 95% CI 16.8–21.0 months; Hazard ratio [HR] = 0.73, 95% CI 0.61–0.87), and 3-year OS rates (95% CI) were 15.4% (11.5–19.9) and 23.2% (18.4–28.2), respectively [10, 11]. The NI protocol has been recommended by the National Comprehensive Cancer Network Clinical Practice Guidelines in Oncology (NCCN Guidelines) for malignant pleural mesothelioma (version 1.2022) as the first-line treatment for MPM [12].
Although NI scheme has shown good safety and effectiveness, it is expensive. In particular, the price of ipilimumab in China is $77.96/mg [13]. The cost of the entire course of treatment (take the medicine every 6 weeks for about 6 months) is about $22,804, which is out of reach for many patients' families. According to the Guidelines for the Clinical Diagnosis and Treatment of Malignant Pleural Mesothelioma in China (2021 edition), nivolumab combined with ipilimumab is used for the first-line treatment of patients with unresectable MPM, amd no studies have evaluated the economics of this therapy. Our study aimed to evaluate the economics of NI versus C in the first-line treatment of unresectable MPM from the perspective of the Chinese healthcare system using pharmacoeconomic approaches.
Methods
Target population and procedures
The population included in this study is the same as that included in the clinical trial of CheckMate 743, that is, those who are 18 years old or older, who are histologically confirmed as unresectable MPM, who can't receive surgical treatment (with or without chemotherapy), and whose Eastern Cooperative Oncology Group (ECOG) performance status of 0 or 1 [10]. According to the CheckMate 743 clinical trial, nivolumab (3 mg/kg) was injected intravenously every 2 weeks and ipilimumab (1 mg/kg) was injected intravenously every 6 weeks in the NI group until the disease progressed, intolerant toxicity occurred or for up to 2 years. Patients in group C received intravenous injection of cisplatin (75 mg/m2) or carboplatin (area under concentration time curve: 5 mg/mL per min) combined with pemetrexed (500 mg/m2) every 3 weeks, with a maximum of 6 cycles [10].
Model structure
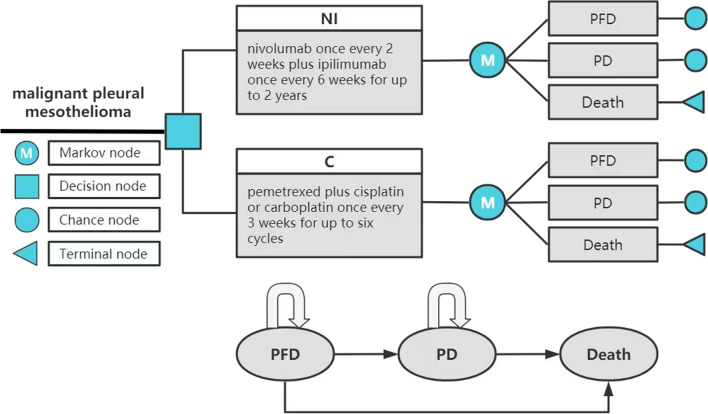
The model was built by TreeAge Pro2022 software and analyzed statistically. The model includes three mutually exclusive health states: progression-free disease (PFD), progressive disease (PD) and death. It is assumed that all patients enter the model in PFD state and can maintain their designated health state or develop into another health state in each cycle (Fig. 1). And we assumed that the probability of PFD turning to death was equal to the natural mortality. According to related research, the 5-year survival rate of MPM patients was about 10%, so we set the running time of the model to 10 years. In order to facilitate the model operation and parameter calculation, we set the model period to 1 month. The main output results of the model include total cost, quality-adjusted life-years (QALY), and incremental cost-effectiveness ratio (ICER). And the cost and utility were discounted at a discount rate of 5%. Three times the per capita gross domestic product (GDP) of China in 2021 was used as the threshold of willingness to pay (WTP) [14]. In the original study, the author drew the Kaplan–Meier survival curve for the overall survival of all random population, epithelioid histology population and non-epithelioid histology population, so this study also constructed different Markov models for these three populations.
Fig. 1.
Partitioned survival model simulating outcomes for the CheckMate 743 trial. NI Nivolumab plus ipilimumab, C Pemetrexed plus cisplatin/carboplatin, PFD Progression-free disease, PD Progressed disease
Clinical data
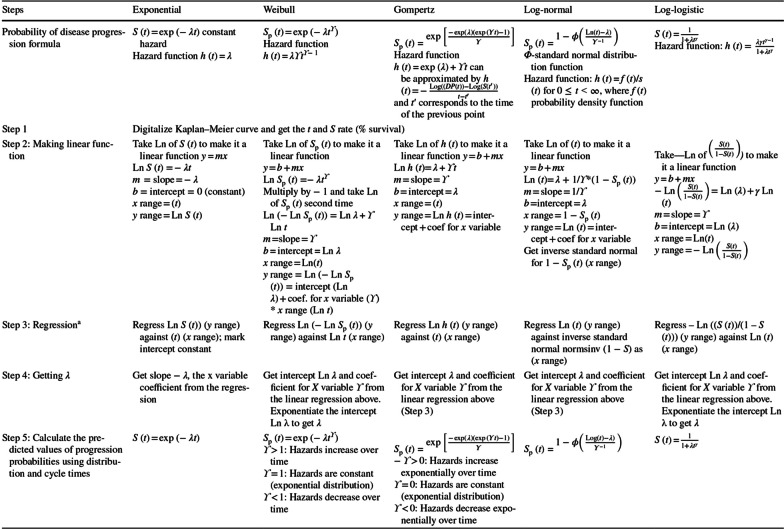
Survival data for this study were obtained from the CheckMate 743 trial. In this study, GetData Graph Digitizer software was used to extract PFS and OS curve data from the CheckMate 743 study. Then, according to the method of Guyot et al. [15], R software was used to reconstruct the Kaplan–Meier survival curve and extrapolated to obtain a new survival curve. Fitted distribution functions include Weibull, log-logistic, log-normal, Gompertz, exponential, and gamma distribution functions. The detailed function formula of each distribution is shown in “Appendix 2 Fig. 11”. According to Akaike Information Criterion (AIC), Bayesian Information Criterion (BIC) and visual direct comparison of fitting curve and K-M curve to test the goodness of fit, the distribution function with lower AIC and BIC values and better visual simulation effect was selected as the fitting curve to obtain long-term clinical survival results. The AIC and BIC values of the fitting results of each function were shown in “Appendix 1 Table 3”.
Fig. 11.
Key steps to fit commonly used parametric survival distributions to the non-parametric Kaplan–Meier curve
Table 3.
Comparison of survival models
| AIC | BIC | |||
|---|---|---|---|---|
| Nivolumab plus ipilimumab | Pemetrexed plus platinum | Nivolumab plus ipilimumab | Pemetrexed plus platinum | |
| OS-A | ||||
| WeibullPH | 1985.716 | 1968.351 | 1993.143 | 1975.772 |
| Log-logistic | 1986.896 | 1954.552 | 1994.323 | 1961.972 |
| Log-normal | 1996.288 | 1958.015 | 2003.715 | 1965.436 |
| Gompertz | 1989.239 | 1980.054 | 1996.666 | 1987.474 |
| Exponential | 1988.198 | 1980.072 | 1991.912 | 1983.782 |
| Gamma | 1984.816 | 1963.240 | 1992.244 | 1970.661 |
| OS-E | ||||
| WeibullPH | 1477.448 | 1473.175 | 1484.315 | 1480.016 |
| Log-logistic | 1474.177 | 1470.475 | 1481.044 | 1477.316 |
| Log-normal | 1478.411 | 1486.525 | 1485.278 | 1493.366 |
| Gompertz | 1480.764 | 1480.351 | 1487.631 | 1487.192 |
| Exponential | 1479.087 | 1481.437 | 1482.520 | 1484.858 |
| Gamma | 1476.274 | 1471.601 | 1483.141 | 1478.442 |
| OS-N | ||||
| WeibullPH | 496.9260 | 475.9146 | 501.5341 | 480.5761 |
| Log-logistic | 499.4671 | 468.2698 | 504.0752 | 472.9313 |
| Log-normal | 502.2192 | 468.3080 | 506.8273 | 472.9695 |
| Gompertz | 497.4668 | 482.3946 | 502.0749 | 487.0561 |
| Exponential | 496.1016 | 481.7369 | 498.4057 | 484.0676 |
| Gamma | 496.8764 | 472.4620 | 501.4845 | 477.1235 |
| PFS-A | ||||
| WeibullPH | 1583.631 | 1448.885 | 1591.059 | 1456.306 |
| Log-logistic | 1536.415 | 1419.132 | 1543.842 | 1426.553 |
| Log-normal | 1529.415 | 1429.720 | 1536.842 | 1437.141 |
| Gompertz | 1549.582 | 1479.176 | 1557.010 | 1486.597 |
| Exponential | 1590.696 | 1488.348 | 1594.409 | 1492.058 |
| Gamma | 1590.134 | 1435.329 | 1597.561 | 1442.750 |
Bold standed for minimum value for each parameter (selected value)
AIC Akaike information criterion, BIC Bayesian Information Criterion, OS Overall survival, PFS Progression-free survival, A Randomized patients, E Patients with epithelioid histology, N Patients with non-epithelioid histology
In the CheckMate 743 study, the authors performed K–M curve analyses of progression-free survival (PFS) only for all randomized populations followed for at least 3 years (NI vs. C = 303 vs. 302). OS curves were plotted for all randomized population (NI vs. C = 303 vs. 302), epithelioid histological population (NI vs. C = 229 vs. 226), and non-epithelioid histological population (NI vs. C = 74 vs. 76). In this study, log-normal distribution and log-logistic distribution functions were used to fit the PFS curves of group NI and group C, and Weibull distribution, log-logistic distribution and exponential distribution functions were used to fit and extrapolate the OS curves of different populations in group NI. The OS curves of three different populations in group C were extrapolated by log-logistic distribution function. We performed internal model validation [16]. Which showed that the fitted PFS and OS curves closely matched those presented in clinical trials (“Appendix 2 Figs. 12, 13, 14, 15, 16, 17, 18, 19”). The model parameters and their value ranges were shown in Table 1.
Fig. 12.
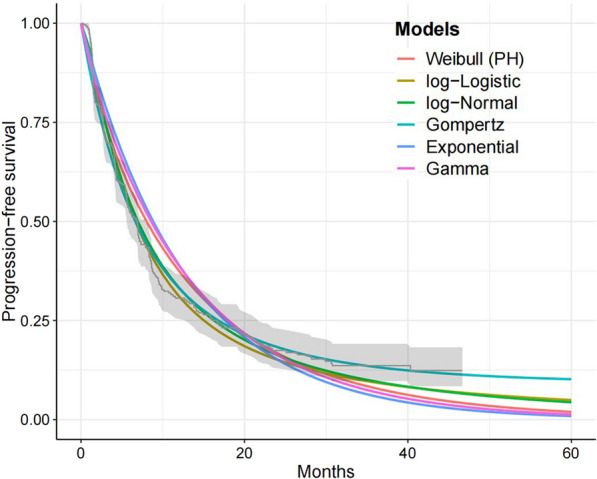
PFS(NI) derived from the model simulation
Fig. 13.
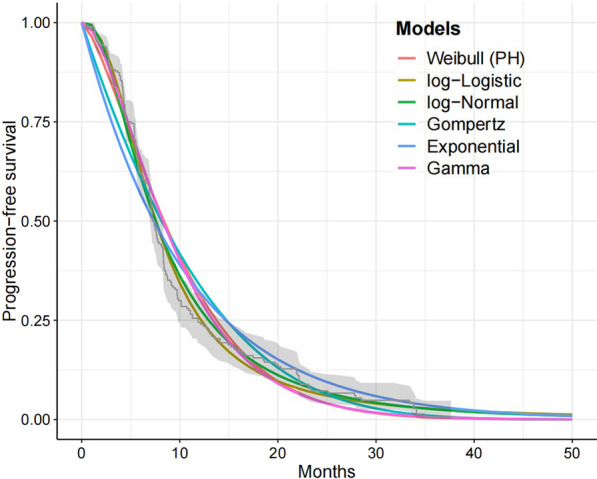
PFS(C) derived from the model simulation
Fig. 14.
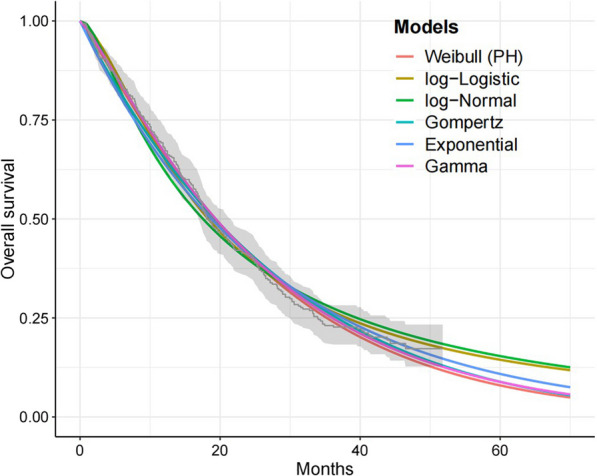
OS(NI-A) derived from the model simulation
Fig. 15.
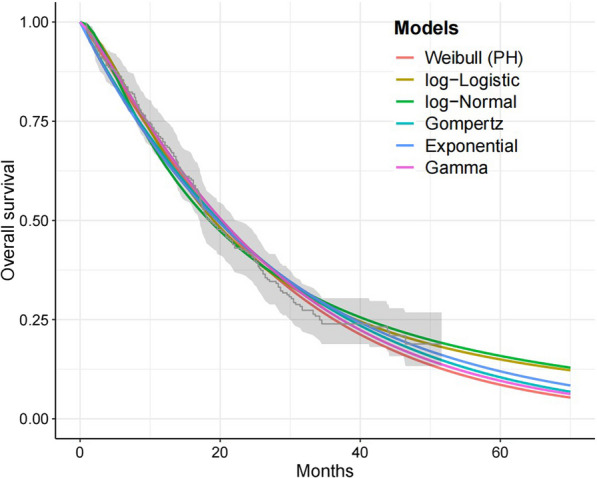
OS(NI-E) derived from the model simulation
Fig. 16.
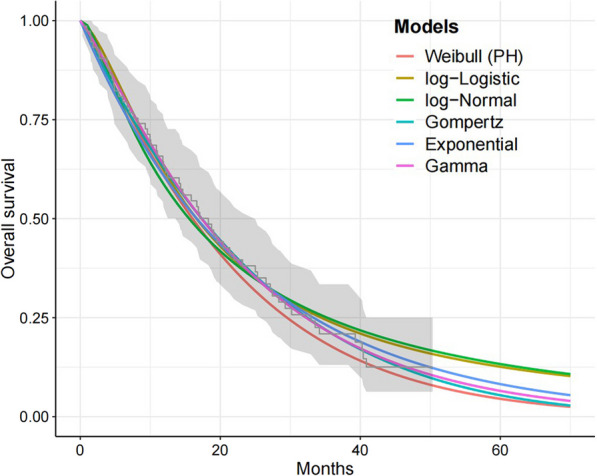
OS(NI-N) derived from the model simulation
Fig. 17.
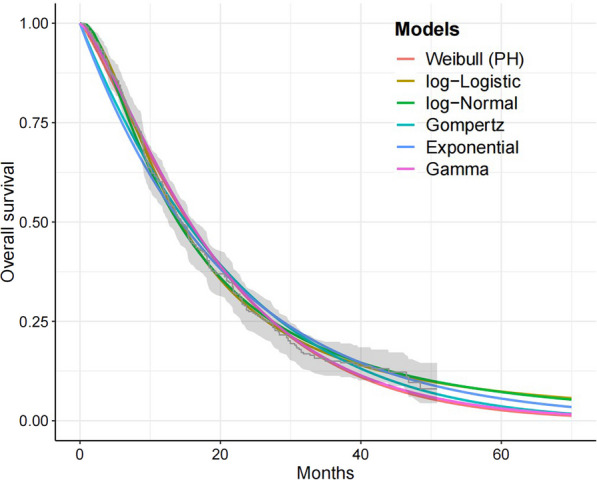
OS(C-A) derived from the model simulation
Fig. 18.
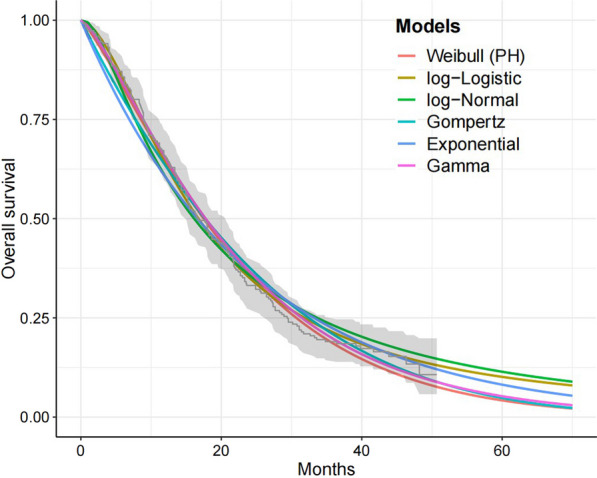
OS(C-E) derived from the model simulation
Fig. 19.
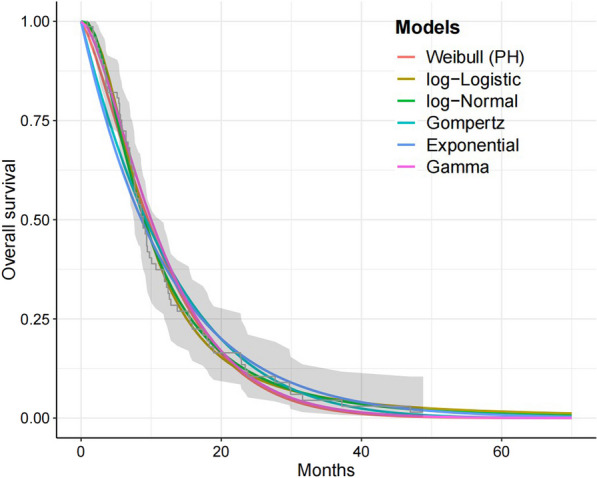
OS(C-N) derived from the model simulation
Table 1.
Model parameters
| Variable | Baseline value | Range | References | |
|---|---|---|---|---|
| Minimum | Maximum | |||
| NI: Log-normal PFS survival mode | λ = 1.93843, γ = 1.26135 | – | – | [10] |
| C: Log-logistic PFS survival mode | λ = 7.53780, γ = 2.29427 | – | – | [10] |
| NI: OS survival mode | ||||
| NI-A: WeibullPH OS survival mode | λ = 0.0241553, γ = 1.1284343 | – | – | [10] |
| NI-E: Log-logistic OS survival mode | λ = 19.01452, γ = 1.51241 | – | – | [10] |
| NI-N: Exponential OS survival mode | λ = 0.0412831 | – | – | [10] |
| C: OS survival mode | ||||
| C-A: Log-logistic OS survival mode | λ = 14.25065, γ = 1.76236 | – | – | [10] |
| C-E: Log-logistic OS survival mode | λ = 16.70245, γ = 1.70694 | – | – | [10] |
| C-N: Log-logistic OS survival mode | λ = 9.03382, γ = 2.1$77.96 1 | – | – | [10] |
| NI: Incidence of AEs, % | ||||
| Asthenia | 0 | – | – | [10] |
| Anemia | 0.33 | 0.27 | 0.40 | [10] |
| Neutropenia | 0.67 | 0.53 | 0.80 | [10] |
| C: Incidence of AEs, % | ||||
| Asthenia | 4.20 | 3.36 | 5.04 | [10] |
| Anemia | 11.27 | 9.02 | 13.52 | [10] |
| Neutropenia | 15.14 | 12.11 | 18.17 | [10] |
| Utility | ||||
| PFS | 0.706 | 0.565 | 0.847 | [19] |
| PD | 0.565 | 0.452 | 0.678 | [19] |
| Death | 0 | – | – | [19] |
| Asthenia | − 0.07 | − 0.04 | − 0.11 | [20] |
| Anemia | − 0.073 | − 0.037 | − 0.110 | [21] |
| Neutropenia | − 0.20 | − 0.15 | − 0.25 | [21] |
| Drug cost per mg, USD | ||||
| Nivolumab | 15.96 | 6.44 | 19.16 | [13] |
| Ipilimumab | 77.96 | 38.98 | 93.55 | [13] |
| Pemetrexed | 0.88 | 0.05 | 6.40 | [13] |
| Cisplatin | 0.12 | 0.01 | 0.83 | [13] |
| Carboplatin | 0.09 | 0.02 | 0.33 | [13] |
| Vinorelbine | 1.52 | 0.06 | 5.61 | [13] |
| Gemcitabine | 0.07 | < 0.01 | 0.36 | [13] |
| Administration IV, first hour, USD | 7.83 | 6.27 | 9.40 | [22] |
| Outpatient follow-up visit, per cycle, USD | 69.13 | 51.85 | 86.29 | [23] |
| AEs cost per 1-month cycle, first cycle only, USD | ||||
| Asthenia | 96.05 | 67.24 | 124.87 | [24] |
| Anemia | 500.78 | 445.76 | 545.54 | [21] |
| Neutropenia | 434.57 | 0.00 | 1,290.65 | [21] |
| Body area surface/m2 | 1.72 | 1.50 | 1.90 | [18] |
| Weight/kg | 65.00 | 48.75 | 81.25 | [18] |
| Creatinine clearance/mL min−1 | 60 | – | – | [18] |
| Discount rate | 0.05 | 0 | 0.08 | [25] |
NI Nivolumab plus ipilimumab, PFS Progression-free survival, C Pemetrexed plus cisplatin/carboplatin, OS Overall survival, A All randomized patients, E Patients with epithelioid histology, N Patients with non-epithelioid histology, AEs Adverse events, USD United States Dollar, PD Progressed disease, IV Intravenous injection
Cost and utility
Based on the perspective of the Chinese healthcare system, this study only considered direct medical costs, including drug costs, follow-up costs, drug injection costs, adverse event (AEs) treatment costs, and second-line treatment costs after progression. By comparing AEs in the NI and C groups, we included only three AEs with significant differences in incidence (asthenia [0% vs. 4.2%], anemia [0.3% vs. 11.3%], and neutropenia [0.7% vs. 15.1%]). According to the CheckMate 743 clinical trial, in which patients received first-line treatment with NI or C until disease progression, intolerable toxicity, or the maximum prescribed duration, the duration of first-line treatment in the NI group was considered to be 6 months (median = 5.6 months, IQR 2.0–11.4 months), and the duration of first-line treatment in group C was 4 months (median = 3.5 months, IQR 2.7–3.7 months). Furthermore, we assumed a probability of 0 to 1 for the use of cisplatin or carboplatin in group C. According to the NCCN Guidelines for MPM (version 1.2022) [12], pemetrexed (500 mg/m2) combined with cisplatin (75 mg/m2) or carboplatin (area under the concentration time curve of 5 mg/mL per min) was used as second-line therapy in the NI group, and all three drugs were given intravenously every 3 weeks and assumed the same probability range (0–1) for cisplatin and carboplatin. Group C received second-line nivolumab (3 mg/kg intravenously once every 2 weeks) with or without ipilimumab (1 mg/kg intravenously once every 6 weeks), vinorelbine (25 mg/m2 intravenously on days 1 and 8 every 3 weeks) or gemcitabine (1000 mg/m2 intravenously on days 1 and 8 every 3 weeks) [17]. The probability ranges for immunotherapy and chemotherapy were assumed to be equal, that is, the probability of using nivolumab alone plus the probability of using nivolumab plus ipilimumab was 0.5, and the probability of using vinorelbine plus the probability of using gemcitabine was 0.5, and the parameter P was set in the model as the probability of using immunotherapy in the second-line treatment of group C, and the probability range was set from 0 to 1. And at the same time, it was also assumed that nivolumab alone and nivolumab plus ipilimumab had the same probability range (0–1) for second-line immunotherapy in arm C, and the same probability range for vinorelbine and gemcitabine during chemotherapy (0–1). According to the NCCN guidelines and related references, it was assumed that the second-line platinum-based conventional chemotherapy in group NI would last up to 5 months, and the second-line immunotherapy in group C would last up to 3 months, and the mono-chemotherapy would last up to 16 months. The model assumed that all patients received second-line therapy after the initial progression of disease, and only drug costs and follow-up costs for second-line therapy were considered. Drug costs were derived from the median bid price of each province/municipality on Yaozh.com from 2017 to 2021 [13], and follow-up costs were obtained from published literature. In reference to the median age in the CheckMate 743 trial, the initial model patients had the following characteristics: age of 69 years, mean body weight of 65 kg, surface area of 1.72 m2, and creatinine clearance of 60 mL/min [18]. Other costs are shown in Table 1, and all costs are converted to US dollars at the exchange rate as of November 5, 2022 (RMB:USD = 7.1831:1).
The utility value represents the health-related quality of life for each health state. We assumed that AEs only happened in the first period. No outcome measures of health utility were addressed in the CheckMate 743 study, therefore, utility values and treatment costs for AEs in this study model were derived from other published literature. Since there was no accurate utility values of PFS and PD statuses in MPM patients before this, the utility values of PFS and PD statuses of patients in this study referred to the published utility values of non-small cell lung cancer, and we assumed that the utility value for the same health status were the same in both groups. The utility values for PFS status, PD status, and death status were 0.706, 0.565, and 0, respectively [19]. All utility values are shown in Table 1.
Sensitivity analysis
A single factor sensitivity analysis was performed on the main parameters such as cost, utility and probability, and the results were presented in the form of a tornado plot. The basic value of drug prices adopts the median value of the winning bid prices of all provinces/municipalities in Yaozh.com from 2017 to 2021. The floating range was 50% downward and 20% upward from the basic value. The range of values for other parameters was determined based on the 95% confidence interval in the referenced literature or 20% above or below the base value, and the range of the discount rate was 0–8%. Probabilistic sensitivity analyses were performed by second-order Monte Carlo simulations to assess the overall robustness of the findings. A total of 1000 iterations were performed to calculate ICER values for each sampling of different treatment regimens, and the results were presented in the form of cost-effectiveness acceptability curves curves and scatter plots.
Results
Basic case analysis
The results of model operation showed that most patients died within 10 years, and the models of this study basically simulated the lifetime outcomes of MPM patients (the study period was 10 years). The basic analysis results were shown in Table 2. Among all random patients, compared with group C, the NI group could bring higher survival benefit (ΔQALY = 0.10), but also higher total cost (Δcost = $38,023). The ICER value was $375,656/QALY, which far exceeded the preset WTP threshold. In the population with epithelial histology, the NI regimen also had better survival benefit (ΔQALY = 0.12) and higher total cost (Δcost = $38,002) than the C regimen. The ICER value of the NI group compared with the C group was $327,943/QALY, which also exceeded the preset WTP threshold. In the non-epithelioid histological population, patients in the NI group had 0.33 QALYs more than those in the C group, with an incremental cost of $38,543 and an ICER value of $115,495/QALY, which was also much larger than the preset WTP threshold. It can be seen that in the three populations, although regimen NI can bring more survival benefits to patients compared with regimen C, the total cost also increases, and the ICER values are higher than 3 times of China's per capita GDP in 2021.
Table 2.
Cost-effectiveness analysis
| Strategies | Life years | Total costs ($) | QALYs | ICER, $/QALY |
|---|---|---|---|---|
| A | ||||
| NI | 2.01 | 46,362 | 1.30 | 375,656 |
| C | 1.89 | 8339 | 1.20 | |
| Incremental (NI vs. C) | 0.12 | 38,023 | 0.10 | |
| E | ||||
| NI | 2.01 | 46,598 | 1.44 | 327,943 |
| C | 1.89 | 8596 | 1.33 | |
| Incremental (NI vs. C) | 0.12 | 38,002 | 0.12 | |
| N | ||||
| NI | 2.01 | 46,232 | 1.24 | 115,495 |
| C | 1.89 | 7689 | 0.90 | |
| Incremental (NI vs. C) | 0.12 | 38,543 | 0.33 | |
QALY Quality-adjusted life year, ICER Incremental cost-effectiveness ratio, A All randomized patients, E Patients with epithelioid histology, N Patients with non-epithelioid histology, NI Nivolumab plus ipilimumab, C Pemetrexed plus cisplatin/carboplatin
Sensitivity analysis
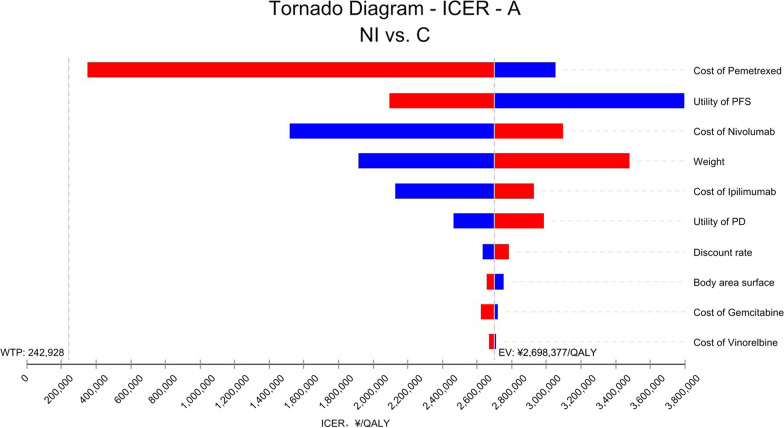
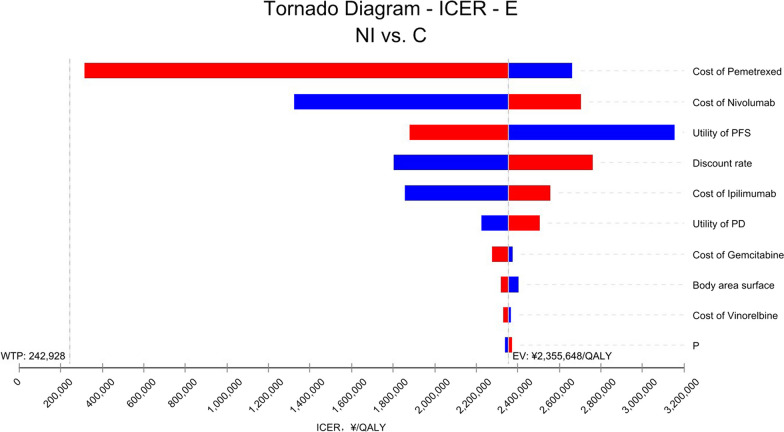
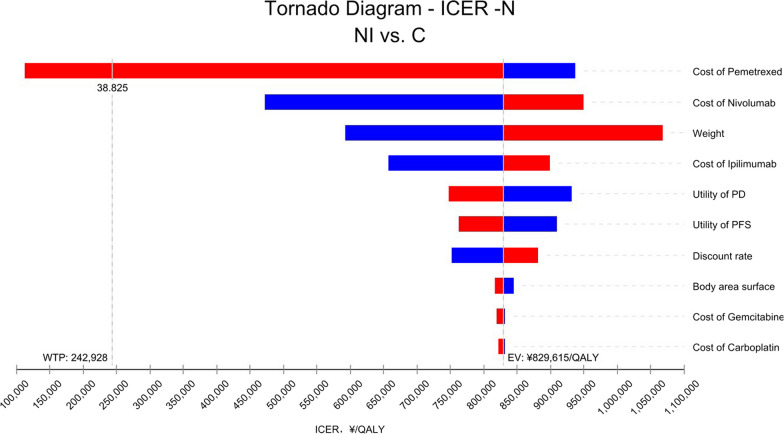
In all randomized and epithelioid histological populations, the price of pemetrexed, the price of nivolumab, and the utility value of PFS had a significant impact on the results. However, regardless of how these parameters were individually varied, the ICER value of the NI group compared with the C group was higher than the preset WTP threshold. The tornado diagram of one-way sensitivity analysis are shown in Figs. 2 and 3. In the non-epithelioid histological population, the price of pemetrexed, the price of nivolumab, and the weight of the patient had a significant impact on the results (Fig. 4). When the price of pemetrexed rose to $5.41/mg, the ICER value of group NI compared with group C was equal to 3 times GDP per capita, that is, when the price of pemetrexed was greater than $5.41, the ICER value of group NI compared with group C was less than 3 times GDP per capita, which was lower than the preset WTP threshold, which had cost-effectiveness advantages. However, no matter how other parameters were individually changed within the prescribed range, the ICER value of group NI compared with group C was higher than the preset WTP threshold, which did not have the cost-effectiveness advantage.
Fig. 2.
One-way sensitivity analysis in all randomized patients. A All randomized patients, NI Nivolumab plus ipilimumab, C Pemetrexed plus cisplatin/carboplatin, PFS Progression-free survival, PD Progressive disease, WTP Willingness to pay, EV Average value, QALY Quality-adjusted life year
Fig. 3.
One-way sensitivity analysis in patients with epithelioid histology. E Patients with epithelioid histology, NI Nivolumab plus ipilimumab, C Pemetrexed plus cisplatin/carboplatin, PFS Progression-free survival, PD Progressive disease, P Probability of second-line immunotherapy in chemotherapy group, WTP Willingness to pay, EV Average value, QALY Quality-adjusted life year
Fig. 4.
One-way sensitivity analysis in patients with non-epithelioid histology. N Patients with non-epithelioid histology, NI Nivolumab plus ipilimumab, C Pemetrexed plus cisplatin/carboplatin, PD Progressive disease, PFS Progression-free survival, WTP Willingness to pay, EV Average value, QALY Quality-adjusted life year
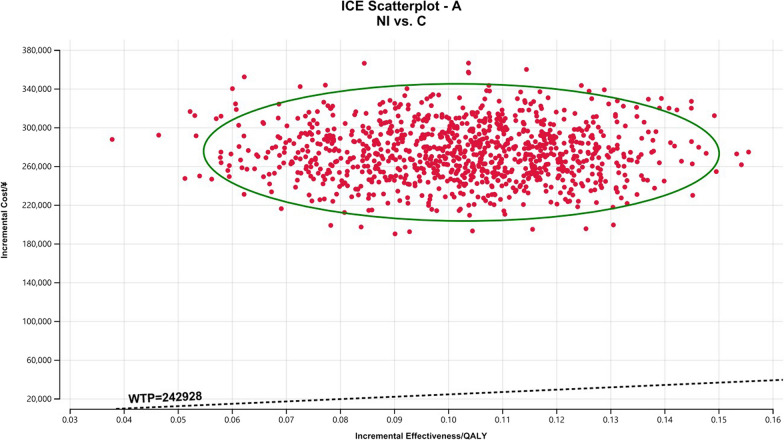
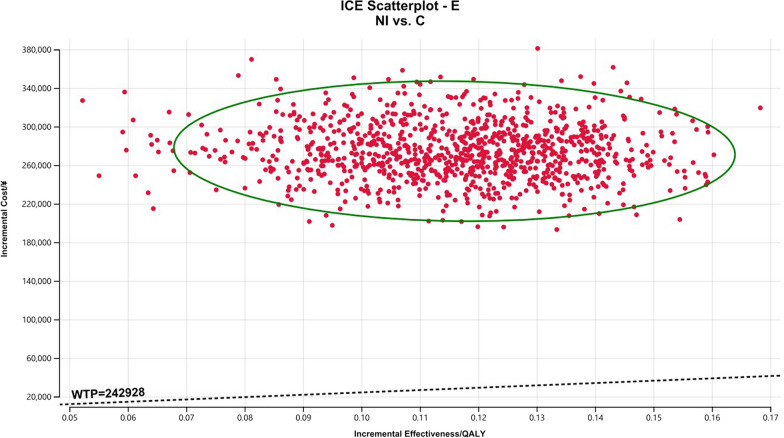
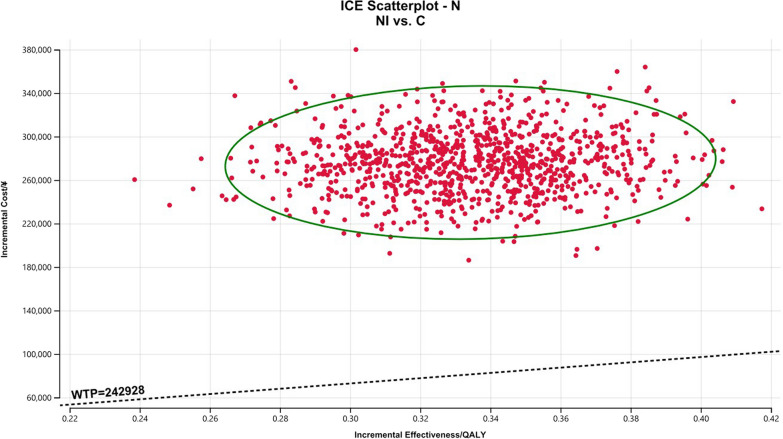
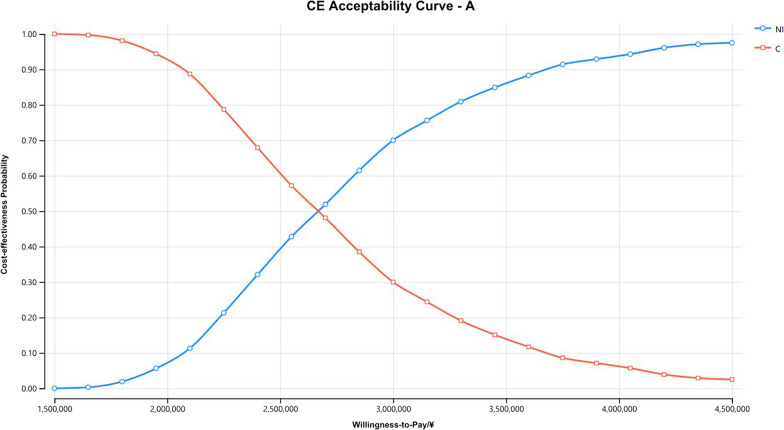
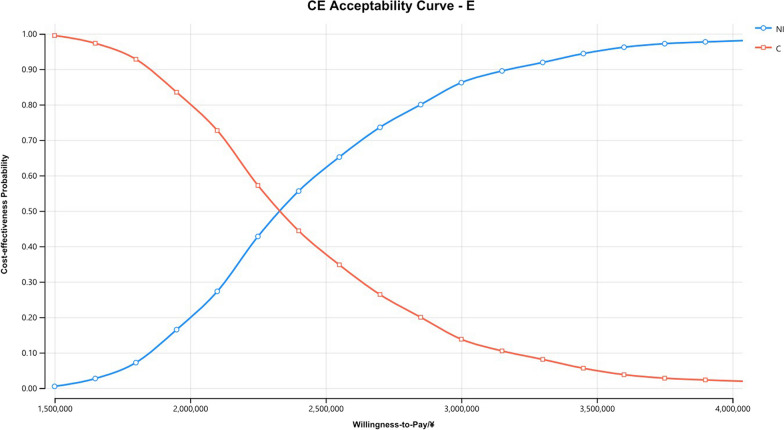
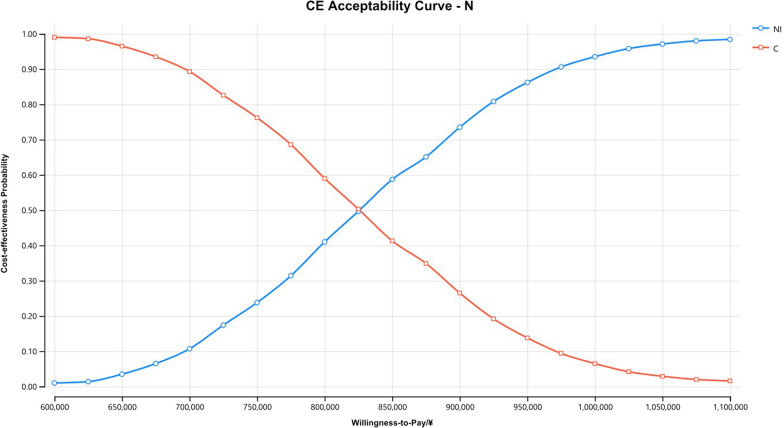
The Monte Carlo scatter plots of the probabilistic sensitivity analysis were shown in Figs. 5, 6 and 7. All the scatter points of the three populations were above the WTP threshold ($33,819), indicating that when the WTP is equal to 3 times the GDP per capita in China, the possibility of the NI scheme being more economical is 0. The cost-effectiveness acceptability curves for three different populations (Figs. 8, 9, 10) showed that as the WTP threshold increased, the probability that the NI option was more economical increased. However, when the WTP threshold was $33,819, the probability that NI was more economical than C was 0.
Fig. 5.
Scatterplot of probabilistic sensitivity analysis for all randomized patients. A All randomized patients, NI Nivolumab plus ipilimumab, C Pemetrexed plus cisplatin/carboplatin, WTP Willingness to pay, QALY Quality-adjusted life year
Fig. 6.
Scatterplot of probabilistic sensitivity analysis for all randomized patients. E Patients with epithelioid histology, NI Nivolumab plus ipilimumab, C Pemetrexed plus cisplatin/carboplatin, WTP Willingness to pay, QALY Quality-adjusted life year
Fig. 7.
Scatterplot of probabilistic sensitivity analysis for all randomized patients. N Patients with non-epithelioid histology, NI Nivolumab plus ipilimumab, C Pemetrexed plus cisplatin/carboplatin, WTP Willingness to pay, QALY Quality-adjusted life year
Fig. 8.
The cost-effectiveness acceptability curves of all randomized patients. CE Cost-effectiveness, A All randomized patients, NI Nivolumab plus ipilimumab, C Pemetrexed plus cisplatin/carboplatin
Fig. 9.
The cost-effectiveness acceptability curves of patients with epithelioid histology. CE Cost-effectiveness, E Patients with epithelioid histology, NI Nivolumab plus ipilimumab, C Pemetrexed plus cisplatin/carboplatin
Fig. 10.
The cost-effectiveness acceptability curves of patients with non-epithelioid histology. CE Cost-effectiveness, N Patients with non-epithelioid histology, NI Nivolumab plus ipilimumab, C Pemetrexed plus cisplatin/carboplatin
Discussion
Compared with traditional chemotherapy, immunotherapy can bring more survival benefits to MPM patients, and the adverse events are also within an acceptable range. However, due to the high price of biologics, it is necessary to further evaluate the cost-effectiveness of the two regimens to judge whether NI regimen has economic advantages [10]. This study is the first to analyze the cost-effectiveness of the NI regimen in the treatment of MPM by constructing a Markov partition survival model. Although the CheckMate 743 trial showed a better survival benefit in the NI group, the results of this analysis show that NI is not an economically advantageous alternative to regimen C in the first-line treatment of patients with unresectable MPM from the perspective of the Chinese healthcare system. Among all randomized patients, the NI group had 0.10 QALYs more than the C group, with an incremental cost of $38,023 and an ICER of $375,656. In the epithelioid histological population, the NI group had 0.12 QALYs more than the C group, with an incremental cost of $38,002 and an ICER of $327,943. Among patients with non-epithelioid histology, the NI group had 0.33 QALYs more than the C group, with an incremental cost of $38,543 and an ICER of $115,495/QALY. In the three populations, the ICER values of the NI group were higher than the WTP threshold, that is, the NI scheme had no cost-effectiveness advantage. However, it is worth noting that the ICER of non-epithelioid histology population is about 1/3 of that of the epithelioid histology population. This may indicate that the NI regimen is more appropriate for the patients with non-epithelioid histology. When the WTP is about $115,000, the probability that the non-epithelioid histology population can afford it is 50%, while when the WTP is about $136,000, the probability increases to 90%.
The models constructed in this study all considered the influence of different second-line drugs on the analysis results. According to the MPM guidelines published by the NCCN [12], we assumed that patients in the NI group received pemetrexed plus cisplatin or carboplatin after the first progression, where the probability range of cisplatin and carboplatin was equal (baseline value = 0.5, range = 0–1). Group C received either immunotherapy or chemotherapy after the first progression, also assuming an equal range of probability (baseline value = 0.5, range = 0–1). Nivolumab monotherapy or combined ipilimumab was used for immunotherapy, and the range of probability of monotherapy or combination therapy was equal (baseline value = 0.5, range = 0–1). Chemotherapy was performed with vinorelbine or gemcitabine monotherapy, again assuming the same probability range for both (baseline value = 0.5, range = 0–1). We assumed that the first-line treatment time in both groups was equal to the median medication time in the CheckMate 743 study. However, NCCN guidelines [12], Chinese Guidelines for the Clinical Diagnosis and Treatment of Malignant Pleural Mesothelioma (2021 edition) [26] and related drug instructions do not clearly indicate the use cycle of nivolumab combined with or without ipilimumab, vinorelbine and gemcitabine in second-line treatment of unresectable MPM patients. Therefore, the duration of second-line treatment was determined according to the relevant references in the NCCN guidelines. Through one way sensitivity analysis, it was found that the price of pemetrexed had the greatest effect on the results in the three populations. And found that when the price of pemetrexed increased, the ICER value of the NI group compared with the C group gradually decreased. In the non-epithelioid histological population, the NI regimen had a cost-effectiveness advantage when the price of pemetrexed was greater than $5.41/mg. This paper considers that this may be related to the higher probability of first-line use of pemetrexed in group C than that of second-line use of pemetrexed in group NI. It is worth noting that the floating range of drug price was determined according to the bidding price in the past 5 years, and pemetrexed has been centrally purchased in many provinces in recent years, which has led to a significant drop in its price. Therefore, this study believes that it is difficult to see a situation where the price of pemetrexed is higher than $5.41/mg again. That is to say, this study believes that the NI group no longer has the conditions for cost-effective advantages due to the reform of the drug procurement policy.
This study still has some limitations. First, although the CheckMate743 trial provided OS curves for three different populations, it did not provide PFS curves for different populations. Therefore, for three different populations (all randomized patients, patients with epithelioid histology, and patients with non-epithelioid histology), their respective OS curves were used in this study. However, PFS curve of all randomized population was used to fit all survival partition models. Secondly, in order to simplify the model, this study only included adverse drug events with a large difference in incidence, and did not consider all adverse events and the utility value and treatment cost of AEs were obtained from published literature rather than real world data, which may lead to some bias. However, the results of univariate sensitivity analysis showed that these parameters had little impact on the results. Third, utility value is a key parameter for pharmacoeconomic evaluation, but since there was no accurate utility score in the published MPM-related literature, the utility parameters in this study referred to the published utility parameters of non-small cell lung cancer [27]. Although the one-way sensitivity analysis showed that the utility values of PFS and PD statuses played a certain role in the outcome analysis, it was also found that the ICER value was always higher than the WTP threshold no matter how the utility values of PFS status or PD status changed within the preset range. Finally, because the incidence of adverse events and corresponding treatment costs were lower in both groups, these costs were not discounted and were calculated using the 2020 cost data.
What is new and conclusion
In 2017, Zhan et al. [27] compared the economics of bevacizumab combined with pemetrexed and cisplatin versus pemetrexed plus cisplatin in the treatment of patients with unresectable MPM naive to chemotherapy from the perspective of Chinese payers. Studies have confirmed that bevacizumab combined with pemetrexed and cisplatin is not a cost-effective treatment option for MPM in China. The pharmacoeconomic evaluation of MPM is very lacking, and these studies have the problems of low quality and long past. This is the first study on the economic evaluation of the first-line treatment of unresectable MPM with nivolumab combined with ipilimumab from the perspective of the Chinese healthcare system, which has a reference role in future clinical medication guidance and drug policy formulation. However, there are certain limitations, such as the failure to fully assess the factors affecting the health-related quality of life of patients.
The pharmacoeconomic evaluation conducted in this study conforms to standard methodological procedures [28]. Despite some limitations, the obtained results have high reliability. In other words, immunotherapy had no economic advantage over conventional chemotherapy as first-line treatment for patients with unresectable MPM when $33,819 was used as the WTP threshold. Given its positive clinical value and extremely low incidence of MPM, an appropriate price discount, assistance programs and medical insurance should be considered to make nivolumab plus ipilimumab more affordable for this rare patient population.
Acknowledgements
We thank all of the people who have contributed to this paper.
Appendix 1
See Table 3.
Appendix 2
Author contributions
LY collected the data for this study and wrote the first draft of the manuscript. LY and XS build the model and wrote the first draft of the manuscript. WZ checked the data and revised the first draft. ZZ conducted data curation and investigation. WL conducted supervision and visualization.
Funding
None.
Availability of data and materials
All datasets for this study are included in the article as well as in the supplementary material.
Declarations
Ethics approval and consent to participate
Not applicable.
Consent for publication
Not applicable.
Competing interests
The authors declare that they have no competing interests.
Footnotes
Publisher's Note
Springer Nature remains neutral with regard to jurisdictional claims in published maps and institutional affiliations.
Liu Yang and Xiaobing Song contributed equally to this work.
References
- 1.Van Schil P, Van Meerbeeck J. Malignant pleural and peritoneal mesothelioma: clinical update 2018. Transl Lung Cancer Res. 2018;7(5):505–506. doi: 10.21037/tlcr.2018.08.19. [DOI] [PMC free article] [PubMed] [Google Scholar]
- 2.Mutti L, Peikert T, Robinson BWS, Scherpereel A, Tsao AS, de Perrot M, et al. Scientific advances and new frontiers in mesothelioma therapeutics. J Thorac Oncol. 2018;13(9):1269–1283. doi: 10.1016/j.jtho.2018.06.011. [DOI] [PMC free article] [PubMed] [Google Scholar]
- 3.Popat S, Baas P, Faivre-Finn C, Girard N, Nicholson AG, Nowak AK, et al. Malignant pleural mesothelioma: ESMO Clinical Practice Guidelines for diagnosis, treatment and follow-up() Ann Oncol. 2022;33(2):129–142. doi: 10.1016/j.annonc.2021.11.005. [DOI] [PubMed] [Google Scholar]
- 4.Scherpereel A, Opitz I, Berghmans T, Psallidas I, Glatzer M, Rigau D, et al. ERS/ESTS/EACTS/ESTRO guidelines for the management of malignant pleural mesothelioma. Eur Respir J. 2020;55(6):1–24. doi: 10.1183/13993003.00953-2019. [DOI] [PubMed] [Google Scholar]
- 5.Santoro A, O'Brien ME, Stahel RA, Nackaerts K, Baas P, Karthaus M, et al. Pemetrexed plus cisplatin or pemetrexed plus carboplatin for chemonaive patients with malignant pleural mesothelioma: results of the International Expanded Access Program. J Thorac Oncol. 2008;3(7):756–763. doi: 10.1097/JTO.0b013e31817c73d6. [DOI] [PubMed] [Google Scholar]
- 6.Taylor P, Castagneto B, Dark G, Marangolo M, Scagliotti GV, van Klaveren RJ, et al. Single-agent pemetrexed for chemonaive and pretreated patients with malignant pleural mesothelioma: results of an International Expanded Access Program. J Thorac Oncol. 2008;3(7):764–771. doi: 10.1097/JTO.0b013e31817c73ec. [DOI] [PubMed] [Google Scholar]
- 7.Vogelzang NJ, Rusthoven JJ, Symanowski J, Denham C, Kaukel E, Ruffie P, et al. Phase III study of pemetrexed in combination with cisplatin versus cisplatin alone in patients with malignant pleural mesothelioma. J Clin Oncol. 2003;21(14):2636–2644. doi: 10.1200/JCO.2003.11.136. [DOI] [PubMed] [Google Scholar]
- 8.van Meerbeeck JP, Gaafar R, Manegold C, Van Klaveren RJ, Van Marck EA, Vincent M, et al. Randomized phase III study of cisplatin with or without raltitrexed in patients with malignant pleural mesothelioma: an intergroup study of the European Organisation for Research and Treatment of Cancer Lung Cancer Group and the National Cancer Institute of Canada. J Clin Oncol. 2005;23(28):6881–6889. doi: 10.1200/JCO.20005.14.589. [DOI] [PubMed] [Google Scholar]
- 9.Zalcman G, Mazieres J, Margery J, Greillier L, Audigier-Valette C, Moro-Sibilot D, et al. Bevacizumab for newly diagnosed pleural mesothelioma in the Mesothelioma Avastin Cisplatin Pemetrexed Study (MAPS): a randomised, controlled, open-label, phase 3 trial. Lancet. 2016;387(10026):1405–1414. doi: 10.1016/S0140-6736(15)01238-6. [DOI] [PubMed] [Google Scholar]
- 10.Peters S, Scherpereel A, Cornelissen R, Oulkhouir Y, Greillier L, Kaplan MA, et al. First-line nivolumab plus ipilimumab versus chemotherapy in patients with unresectable malignant pleural mesothelioma: 3-year outcomes from CheckMate 743. Ann Oncol. 2022;33(5):488–499. doi: 10.1016/j.annonc.2022.01.074. [DOI] [PubMed] [Google Scholar]
- 11.Baas P, Scherpereel A, Nowak AK, Fujimoto N, Peters S, Tsao AS, et al. First-line nivolumab plus ipilimumab in unresectable malignant pleural mesothelioma (CheckMate 743): a multicentre, randomised, open-label, phase 3 trial. Lancet. 2021;397(10272):375–386. doi: 10.1016/S0140-6736(20)32714-8. [DOI] [PubMed] [Google Scholar]
- 12.NCCN Clinical Practice Guidelines in malignant pleural mesothelioma (2022 Version I). Available online: https://www.nccn.org/guidelines/guidelines-detail?category=1&id=1442. Accessed 27 May 2022.
- 13.Yaozh. Bidding information of drugs. Available online: https://db.yaozh.com/yaopinzhongbiao. Accessed 27 May 2022.
- 14.Statistical Communiqué of the People’s Republic of China on National Economic and Social Development in 2021~([1]) %J People’s Daily. 2022-03-01.
- 15.Guyot P, Ades AE, Ouwens MJ, Welton NJ. Enhanced secondary analysis of survival data: reconstructing the data from published Kaplan-Meier survival curves. BMC Med Res Methodol. 2012;12:9. doi: 10.1186/1471-2288-12-9. [DOI] [PMC free article] [PubMed] [Google Scholar]
- 16.Goldstein DA, Chen Q, Ayer T, Howard DH, Lipscomb J, El-Rayes BF, et al. First- and second-line bevacizumab in addition to chemotherapy for metastatic colorectal cancer: a United States-based cost-effectiveness analysis. J Clin Oncol. 2015;33(10):1112–1118. doi: 10.1200/JCO.2014.58.4904. [DOI] [PMC free article] [PubMed] [Google Scholar]
- 17.Zauderer MG, Kass SL, Woo K, Sima CS, Ginsberg MS, Krug LM. Vinorelbine and gemcitabine as second- or third-line therapy for malignant pleural mesothelioma. Lung Cancer (Amsterdam, Netherlands) 2014;84(3):271–274. doi: 10.1016/j.lungcan.2014.03.006. [DOI] [PMC free article] [PubMed] [Google Scholar]
- 18.Chen X, Hong Y, Zheng P, You X, Feng J, Huang Z, et al. The economic research of arsenic trioxide for the treatment of newly diagnosed acute promyelocytic leukemia in China. Cancer. 2020;126(2):311–321. doi: 10.1002/cncr.32519. [DOI] [PubMed] [Google Scholar]
- 19.Dansk V, Large S, Bertranou E, Bodnar C, Dyer M, Ryan J. A review of health state utility values used in UK nice appraisals in advanced NSCLC. Value Health. 2020;19(7):A745. doi: 10.1016/j.jval.2016.09.2278. [DOI] [Google Scholar]
- 20.Zhu J, He W, Ye M, Fu J, Chu YB, Zhao YY, et al. Cost-effectiveness of afatinib and erlotinib as second-line treatments for advanced squamous cell carcinoma of the lung. Future Oncol (London, England) 2018;14(27):2833–2840. doi: 10.2217/fon-2018-0321. [DOI] [PubMed] [Google Scholar]
- 21.Kang S, Wang X, Zhang Y, Zhang B, Shang F, Guo W. First-line treatments for extensive-stage small-cell lung cancer with immune checkpoint inhibitors plus chemotherapy: a network meta-analysis and cost-effectiveness analysis. Front Oncol. 2021;11:740091. doi: 10.3389/fonc.2021.740091. [DOI] [PMC free article] [PubMed] [Google Scholar]
- 22.Jiang Y, Li Y, Wang LXW. Cost-effectiveness analysis of nivolumab plus standard chemotherapy versus chemotherapy alone for the first-line treatment of unresectable advanced or metastatic gastric cancer, gastroesophageal junction cancer, and esophageal adenocarcinoma. Int J Clin Pharm. 2022;44(2):499–506. doi: 10.1007/s11096-021-01372-6. [DOI] [PubMed] [Google Scholar]
- 23.Zhang Q, Wu P, He X, Ding Y, Shu Y. Cost-effectiveness analysis of camrelizumab vs. placebo added to chemotherapy as first-line therapy for advanced or metastatic esophageal squamous cell carcinoma in China. Front Oncol. 2021;11:790373. doi: 10.3389/fonc.2021.790373. [DOI] [PMC free article] [PubMed] [Google Scholar]
- 24.Dong L, Lin S, Zhong L, Nian D, Li Y, Wang R, et al. Evaluation of tucatinib in HER2-positive breast cancer patients with brain metastases: a United States-based cost-effectiveness analysis. Clin Breast Cancer. 2022;22(1):e21–e29. doi: 10.1016/j.clbc.2021.06.001. [DOI] [PubMed] [Google Scholar]
- 25.Bousmah MA, Nishimwe ML, Tovar-Sanchez T, Lantche Wandji M, Mpoudi-Etame M, Maradan G, et al. Cost-utility analysis of a dolutegravir-based versus low-dose efavirenz-based regimen for the initial treatment of HIV-infected patients in Cameroon (NAMSAL ANRS 12313 Trial) Pharmacoeconomics. 2021;39(3):331–343. doi: 10.1007/s40273-020-00987-3. [DOI] [PMC free article] [PubMed] [Google Scholar]
- 26.Professional Committee of Multidisciplinary Oncology Diagnosis and Treatment of Chinese Medical Doctor Association Guidelines for clinical diagnosis and treatment of malignant pleural mesothelioma in China (2021 edition) Chin J Oncol. 2021;43(04):383–394. [Google Scholar]
- 27.Zhan M, Zheng H, Xu T, Yang Y, Li Q. Cost-effectiveness analysis of additional bevacizumab to pemetrexed plus cisplatin for malignant pleural mesothelioma based on the MAPS trial. Lung Cancer (Amsterdam, Netherlands) 2017;110:1–6. doi: 10.1016/j.lungcan.2017.05.012. [DOI] [PubMed] [Google Scholar]
- 28.Latimer NR. Survival analysis for economic evaluations alongside clinical trials—extrapolation with patient-level data: inconsistencies, limitations, and a practical guide. Med Decis Mak. 2013;33(6):743–754. doi: 10.1177/0272989X12472398. [DOI] [PubMed] [Google Scholar]
Associated Data
This section collects any data citations, data availability statements, or supplementary materials included in this article.
Data Availability Statement
All datasets for this study are included in the article as well as in the supplementary material.


