

Abstract
Background:
Early diagnosis and treatment of patients with multiple sclerosis (MS) are associated with better outcomes; however, diagnostic delays remain a major problem.
Objective:
Describe the prevalence, determinants and consequences of delayed diagnoses.
Methods:
This single-centre ambispective study analysed 146 adult relapsing-remitting MS patients (2016–2021) for frequency and determinants of diagnostic delays and their associations with clinical, cognitive, imaging and biochemical measures.
Results:
Diagnostic delays were identified in 77 patients (52.7%), including 42 (28.7%) physician-dependent cases and 35 (24.0%) patient-dependent cases. Diagnosis was delayed in 22 (15.1%) patients because of misdiagnosis by a neurologist. A longer diagnostic delay was associated with trends towards greater Expanded Disability Status Scale (EDSS) scores (B = 0.03; p = 0.034) and greater z-score of the blood neurofilament light chain (B = 0.35; p = 0.031) at the time of diagnosis. Compared with patients diagnosed at their first clinical relapse, patients with a history of >1 relapse at diagnosis (n = 63; 43.2%) had a trend towards greater EDSS scores (B = 0.06; p = 0.006) and number of total (B = 0.13; p = 0.040) and periventricular (B = 0.06; p = 0.039) brain lesions.
Conclusion:
Diagnostic delays in MS are common, often determined by early misdiagnosis and associated with greater disease burden.
Keywords: Delayed diagnosis, misdiagnosis, brain lesion, magnetic resonance imaging, neurofilament, cerebrospinal fluid, disability, multiple sclerosis
Introduction
Early treatment initiation in patients with multiple sclerosis (MS) is associated with better disease outcomes, including lower relapsing activity, disability, lesion-burden accumulation and rate of brain atrophy.1,2 The National Institute for Health and Clinical Excellence guidelines recommend a timeline of no more than 12 weeks between referral and completion of diagnostic investigations for MS. 3 In comparison, a recent multinational consensus advocated for allowing only 7 weeks between the onset of clinical symptoms and diagnosis of MS. 4 Since early diagnosis is a key prerequisite for prompt initiation of disease-modifying treatment (DMT), substantial efforts have focused on facilitating early diagnosis of MS.2,4,5 Revised MS diagnostic criteria has reduced the time between disease onset and MS diagnosis. 6 However, diagnostic delay (DD) remains a major issue.
The prevalence of DD remains high but has improved6–15 (Table 1). Predisposing factors include healthcare system barriers,5,15 comorbidities,16,17 primary progressive MS,7,9,11,12,18,19 and lower education,7,19 but the exact determinants in individual patients are often unclear. Furthermore, the relationship between diagnostic and DMT delays, and disease activity is not well described. Understanding the specific determinants of DDs would help accelerate the diagnostic process.
Table 1.
Summary of previous studies investigating duration, prevalence and predictors of diagnostic delay in patients with multiple sclerosis.
| Study | Country (year) |
Sample | Diagnostic delay | |
|---|---|---|---|---|
| Duration/prevalence | Predictors at disease onset | |||
| Marrie et al. 10 | The United States (1980–2004) |
5548 | – | Earlier year of diagnosis |
| Marrie et al. 16 | The United States (2006) |
8983 | 7.0 years (mean) | Younger age Female gender Comorbidity |
| Fernandez et al. 20 | Spain (2005) |
147 | 24.9 months (median) | – |
| Gout et al., 2010 | France (not reported) |
178 | 46 months (mean time between clinical onset and neurological referral) 33% of patients consulting for a first demyelinating event had prior symptoms suggestive of MS |
– |
| Kingwell et al. 9 | Canada (1980–2004) |
5705 plus 1489 | 29% of patients were examined <12 months from clinical onset 40% of patients were diagnosed <12 months from clinical onset |
Younger age PPMS Earlier year of diagnosis Presence of optic/motor/or cerebellar symptoms |
| Kelly et al. 21 | Ireland (2007–2010) |
119 | 48% had time between clinical onset and diagnosis >3 months | – |
| Adamec et al. 22 | Croatia (2011) |
39 | 38.5% had time between clinical onset and diagnosis >3 months | – |
| Thormann et al. 17 | Denmark (1980–2005) |
8947 | 3.96 (mean time between clinical onset and diagnosis) | Comorbidity |
| Kaufmann et al. 11 | Switzerland (1996–2017) |
996 | 40% had time between clinical onset and diagnosis >2 years 23% had time between diagnosis and initiation of DMT >1 year |
Younger age PPMS Earlier year of diagnosis Diagnosis setting outside of hospital Uncommon first clinical symptoms Presence of gait problems and paresthesia were associated with conversely shorter diagnostic delay |
| Aires et al. 18 | Portugal (2010–2015) |
285 | 9 months (median time between clinical onset and diagnosis) | Older age PPMS Presence of motor symptoms Higher number of relapses before diagnosis Presence of prior alternative diagnosis |
| Cárdenas-Robledo et al. 8 | Colombia (2016–2019) |
525 | 3.07 years (mean time between clinical onset and diagnosis of MS) 45.7% patients had time between clinical onset and diagnosis >12 months |
Earlier year of diagnosis (e.g. using older diagnostic criteria for MS such as Schumacher and Poser diagnostic criteria for MS) |
| Willumsen et al. 12 | Norway (1950–2018) |
1184 | 2.5–9.5 years (median time between clinical onset and diagnosis in 1950–1994) 1.5 years (median time between clinical onset and diagnosis in 1995–2017) |
Earlier year of diagnosis PPMS |
| Gasperi et al. 23 | Germany (2010–2017) |
10,262 | High number of patients were not diagnosed at clinical disease onset but several years later | Disease activity was not attributed to MS |
| Ghiasian et al. 7 | Iran (1990–2016) |
351 | 18.01 months (mean time between clinical onset and diagnosis) 44.2% patients had time between clinical onset and diagnosis >3 months |
Male gender Lower education Earlier year of diagnosis PPMS Living in rural areas Presence of optic neuritis at clinical onset was associated with conversely shorter diagnostic delay |
| Tintore et al. 6 | Spain (1994–2020) |
1174 | – | Earlier year of diagnosis (e.g. using older diagnostic criteria for MS) |
| Blaschke et al. 13 | Germany | 9836 | Adults with RRMS and age <40 years: 1.9 years in 2010 and 0.9 years in 2020 Adults with RRMS and age 40–50 years: 1.4 years in 2010 and 1.3 years in 2020 |
Older age Earlier year of diagnosis Paediatric MS |
| Jakimovski et al. 14 | The United States | 9378 | 4.2 years (mean) in 1982–2001 1.1 years (mean) after 2017 |
Earlier year of diagnosis |
| Patti et al. 19 | Italy (1992–2018) |
70 | 33.8 months (mean) and 19.5 months (median) time between clinical onset and diagnosis | Older age Male gender Lower education PPMS Presence of motor symptoms at clinical onset was associated with higher diagnostic delay compared with presence of optic neuritis |
| Khedr et al. 15 | Egypt (2021–2022) |
142 | 18.63 months (mean) 3 months (median) |
Younger age Earlier year of diagnosis Non-motor clinical presentation Initial non-neurological consultation Prior misdiagnosis Presence of healthcare system barriers |
| Solomon et al. 5 | International, 107 countries (2019–2020) |
– | – | Presence of healthcare system barriers to MS diagnosis such as lack of healthcare providers, lack of awareness or training, low health professional availability, lack of specialist equipment availability, high healthcare costs, low MRI availability or lack of patient awareness |
MS: multiple sclerosis; PPMS: primary progressive multiple sclerosis; DMT: disease-modifying treatment; RRMS: relapsing-remitting multiple sclerosis.
This study aimed to describe the prevalence, determinants and consequences of DD of relapsing-remitting multiple sclerosis (RRMS) in a large MS centre.
Materials and methods
Study population
This ambispective, single-centre, observational study, included 146 patients diagnosed with de novo RRMS between November 2016 and February 2021 at the referral MS Centre of the General University Hospital in Prague. The study included patients >18 years old, who received a cerebrospinal fluid (CSF) examination to exclude alternative diagnoses, were diagnosed in the Czech Republic to avoid different healthcare systems and language barriers and had a diagnosis of RRMS, 24 to accurately determine the time of clinical disease onset. We excluded patients for whom the relative precise time of clinical disease onset could not determine, including those with primary progressive MS, in whom diagnostic criteria also require ⩾1 year of progressive symptoms. 24 A few patients underwent diagnostic workup before February 2018 and they received a diagnosis of clinically isolated syndrome (CIS). After the introduction of the new McDonald 2017 criteria, 24 these patients were reclassified as having the RRMS.
In the Czech Republic, it is a standard practice to begin DMT within 4 weeks of diagnosing MS. As a result, we treated the diagnosis of MS and the commencement of DMT as simultaneous events.
All patients underwent either regular clinical visits with Expanded Disability Status Scale (EDSS) evaluations or acute visits in cases of relapsing activity. Most patients underwent a single cognitive examination using Czech validated versions 25 of the Paced Auditory Serial Addition Test-3 (PASAT-3) and Brief International Cognitive Assessment for Multiple Sclerosis (BICAMS) 26 (Supplementary Appendix 1).
The Medical Ethics Committee of General University Hospital in Prague approved the study protocol (ID1018/17, 52/17). The study was performed in accordance with the Declaration of Helsinki. All patients provided written informed consent.
Magnetic resonance imaging acquisition and analysis
Brain magnetic resonance imaging (MRI) exams were performed annually using a standardized protocol on a 3-Tesla scanner. Diagnostic MRI scans were performed before lumbar puncture, before or >30 days after high-dose corticosteroid administration and before DMT initiation. Lesions were segmented using the LeMan PV research application. 27 Brain volumes were estimated from magnetization prepared rapid acquisition gradient echo sequence (MPRAGE) using the MorphoBox research application. 28 The spinal cord volume was quantified by measuring the mean cross-sectional area of the upper cervical cord (MUCCA) using ScanView 29 (Supplementary Appendix 1).
Neurofilament light chain (NfL) measurements
CSF and serum samples were collected and stored using standard sampling procedures. CSF-neurofilament light chain (NfL) levels were measured using a neurofilament (NF)-light enzyme–linked immunosorbent assay kit (Uman Diagnostics AB, Umea, Sweden). Serum neurofilament light chain (sNfL) levels were measured using a single-molecule array (Simoa) assay30,31 (Supplementary Appendix 1).
Definition for DD of MS
During the initial visit to an MS centre, patient’s neurological medical history was reviewed by a neurologist. The patients were asked about their history of central nervous system (CNS) symptoms that fulfilling the criteria for an MS relapse, which suggest previous demyelinating events indicative of MS.
For patients with suspected DD (based on information from the initial visit), we reviewed hospital medical records and conducted semi-structured phone interviews (Supplementary Appendix 2) to confirm whether a DD occurred and obtain further details of the initial clinical presentations and DD determinants. A DD was defined as >3 months elapsing between the first symptom onset and MS diagnosis.3,7,22,21
Statistical analysis
Analyses were performed using R (http://www.R-project.org) and SPSS 22.0 (IBM) software.
Spearman’s correlation test and adjusted linear regression were used to analyse the relationships between the DD length (independent variable) and demographic, clinical, biochemical and MRI measures. The Mann–Whitney U-test (MW) and adjusted linear regression were used to compare differences between patients with and without DD and between patients with and without history of >1 demyelinating event suggestive of MS at the time of diagnosis. The associations between DD or previous relapsing activity and time to new relapsing activity or EDSS worsening were analysed using adjusted Cox proportional hazard models. The models were adjusted for age, sex, EDSS, and, in the case of Cox proportional hazard models, also for treatment status, the number of oligoclonal bands and the number and volume T2 lesions. The Benjamini–Hochberg (BH) procedure (p < 0.05) was used to measure the false discovery rate. The bracketed number following the adjusted p-values refers to the number of comparisons. Associations losing significance after BH analysis are described as ‘trends’ (Supplementary Appendix 3).
Results
Study sample
Initially, 239 consecutive patients referred to the MS centre with a suspected diagnosis of MS were examined; 156 met the McDonald 2017 criteria for MS. 24 Patients were excluded for primary progressive MS (n = 5), uncertainties regarding initial symptoms (n = 3), an initial diagnosis of radiologically isolated syndrome (n = 1) and an initial diagnostic workup abroad (n = 1). Ultimately, the study included 146 patients (Figure 1).
Figure 1.

Study design.
Basic patient characteristics
A DD was observed for 52.7% (77/146) of the patients. Using a DD threshold of 6, 9, 12 or 24 months lowered the proportion to 45.9%, 40.4%, 32.9% and 21.2%, respectively. At diagnosis, 43.2% (63/146) of patients had a second or later clinical relapse. For the entire group, the median time between the first reported clinical symptoms suggestive of MS (e.g. probable clinical disease onset) and the diagnosis was 4.4 months (interquartile range (IQR) = 1.0–18.3 months). No patients reported isolated cognitive dysfunction as the initial MS presentation, but 35.3% (41/116) of patients had cognitive dysfunction at the time of diagnosis. Table 2 and Figure 1 provide detailed descriptions of the patient cohort.
Table 2.
Characteristics of patients with multiple sclerosis (MS) stratified based on time between disease onset and MS diagnosis.
| Variable | All | Not delayed | Delayed |
|---|---|---|---|
| Number of patients | 146 | 69 | 77 |
| Follow-up duration (months) | 31.3 (22.0; 41.8) | 30.9 (21.6; 40.6) | 31.9 (22.2; 42.0) |
| Demographics | |||
| Females (n; %) | 109 (74.7%) | 50 (72.5%) | 59 (76.6%) |
| Age at diagnosis (years) | 31.5 (27.5; 39.9) | 30.6 (26.6; 37.6) | 31.8 (28.8; 40.4) |
| Disease duration at diagnosis (months) | 4.4 (1.0; 18.3) | 1.0 (0.3; 1.9) | 18.0 (8.8; 44.3) a |
| McDonald 2017 criteria at baseline (n; %) | 100% | 100% | 100% |
| Years of education of patients | 16 (13; 18) | 16 (13; 18) | 16 (13; 19) |
| Symptoms at disease onset | |||
| Sensory (n; %) b | 93 (63.7%) | 44 (63.8%) | 49 (63.6%) |
| Motor (n; %) b | 52 (35.6%) | 23 (33.3%) | 29 (37.7%) |
| Brainstem/cerebellar (n; %) b | 50 (34.2%) | 27 (39.1%) | 23 (29.9%) |
| Optic (n; %) b | 47 (32.2%) | 19 (27.5%) | 28 (36.4%) |
| Sphincter (n; %) b | 17 (11.6%) | 6 (8.7%) | 11 (14.3%) |
| Spinal cord (n; %) b | 65 (44.5%) | 31 (44.9%) | 34 (44.2%) |
| Polysymptomatic (n; %) b | 85 (58.2%) | 38 (55.1%) | 47 (61.0%) |
| Symptoms at diagnosis of MS | |||
| EDSS b | 2 (1.5; 2.5) | 2 (1.5; 2.0) | 2 (1.5; 2.5) |
| BDI-II c | 7 (3, 13) | 7 (3, 11) | 6 (2, 14) |
| PASAT-3 c | 50 (41–53) | 50 (42, 53) | 49 (40, 54) |
| BICAMS c | 35.3% (41/116) g | 37.9% (22/58) g | 32.8% (19/58) g |
| SDMT c | 59 (52, 66) 16.2% (19/117) g |
60 (52, 67) 17.2% (10/58) g |
58 (53, 66) 15.3% (9/59) g |
| CVLT2 c | 54 (47, 62) 22.8% (26/114) g |
55 (49, 64) 28.1% (16/57) g |
53 (47, 60) 17.5% (10/57) g |
| BVMT-R c | 29 (26, 33) 11.2% (13/116) g |
29 (26, 33) 10.3% (6/58) g |
29 (26, 33) 12.1% (7/58) g |
| Neurofilament light chain level | |||
| NfL CSF at screening (pg/mL; n = 76) | 806 (402, 1398) | 572 (325, 1083) | 914 (448, 1587) |
| NfL z-score at screening (n = 98) | 1.46 (0.46, 2.58) | 1.39 (0.20, 2.50) | 1.58 (0.67, 2.65) |
| Treatment | |||
| Interferons (n; %) | 98 (67.1%) | 49 (71.0%) | 49 (63.6%) |
| Glatiramer acetate (n; %) | 19 (13.0%) | 8 (11.6%) | 11 (14.3%) |
| Teriflunomide (n; %) | 17 (11.6%) | 6 (8.7%) | 11 (14.3%) |
| Anti-CD20 (n; %) | 1 (0.7%) | 1 (1.4%) | 0 (0.0 %) |
| Natalizumab (n; %) | 2 (1.4%) | 0 (0.0%) | 2 (2.6%) |
| Fingolimod (n; %) | 4 (2.7%) | 2 (2.9%) | 2 (2.6%) |
| No disease-modifying treatment (n; %) | 5 (3.4%) | 3 (4.3%) | 2 (2.6%) |
| MRI at screening | |||
| Brain lesion contrast enhancement (n = 133; %) d | 29 (21.8%) | 14 (20.3%) | 15 (19.5%) |
| Total brain lesion number | 14.0 (9, 30) | 13 (9, 24) | 16.0 (9, 35) |
| Periventricular lesion number | 7 (5, 8) | 6 (5, 8) | 7 (5, 9) |
| Juxtacortical lesion number | 2 (1, 5) | 2 (1, 4) | 2 (1, 7) |
| Total brain lesion volume | 3.1 (1.8, 6.3) | 2.9 (1.9, 6.2) | 3.2 (1.8, 7.4) |
| Periventricular lesion volume (mL) | 2.9 (1.5, 5.5) | 2.7 (1.6, 5.0) | 3.0 (1.5, 6.5) |
| Juxtacortical lesion volume (mL) | 0.1 (0.0, 0.4) | 0.1 (0.0, 0.4) | 0.1 (0.0, 0.5) |
| Infratentorial lesion volume (mL) | 0.0 (0.0, 0.1) | 0.0 (0.0, 0.0) | 0.0 (0.0, 0.1) |
| Brain parenchymal fraction (MPRAGE) | 79.5 (77.7, 81.2) | 80.0 (77.8, 81.2) | 79.4 (77.1, 81.3) |
| MUCCA (cm2) (by ScanView; n = 141) e | 0.88 (0.82, 0.94) | 0.89 (0.83, 0.95) | 0.87 (0.82, 0.94) |
| Presence of spinal cord lesions (C1–Th4) (n; %) | 88 (60.3%) | 38 (55.1%) | 50 (64.9%) |
| Presence of spinal cord (C1–Th4) or brain infratentorial lesions (n; %) | 117 (80.1%) | 56 (81.2%) | 61 (79.2%) |
| CSF (n = 97) f | |||
| Leukocytes (in mm3) | 4.3 (2.0, 8.2) | 4.7 (2.0, 8.3) | 4.2 (2.0, 7.0) |
| Protein (g/L) | 0.3 (0.2, 0.4) | 0.3 (0.2, 0.4) | 0.3 (0.3, 0.4) |
| Albumin quotient | 4.5 (3.3, 5.9) | 4.5 (3.3, 5.9) | 4.4 (3.3, 6.0) |
| IgG index | 0.8 (0.6, 1.4) | 0.6 (0.6, 1.2) | 0.8 (0.6, 1.5) |
| Total number or OCB | 13.5 (8.0, 21.0) | 13.0 (8.0, 23.0) | 14.0 (8.0, 21.0) |
MS: multiple sclerosis; EDSS: Expanded Disability Status Scale; BDI-II: Beck Depression Inventory-II; PASAT-3: Paced Auditory Serial Addition Test; BICAMS: Brief International Cognitive Assessment for Multiple Sclerosis; SDMT: Symbol Digit Modalities Test; CVLT2: Categorical Verbal Learning Test–Second Edition; BVMT-R: Brief Visuospatial Memory Test–Revised; NfL: neurofilament light chain; CSF: cerebrospinal fluid; MRI: magnetic resonance imaging; MPRAGE: magnetization prepared rapid acquisition gradient echo sequence; MUCCA: mean upper cervical cord area; IgG: immunoglobulin G; OCB: oligoclonal band.
Unless otherwise indicated, numbers are reported as median and interquartile ranges.
Except of disease duration (Mann–Whitney U-test; p < 0.0001; adjusted p[5] < 0.0001), we did not find any other difference between delayed and not delayed group.
Examined by neurologist (in some patients with delayed diagnosis were symptom at clinical disease onset based on medical reports or patient recollection).
Examined by neuropsychologist in 117 patients (time between cognitive test and diagnosis of MS was less than 4 months).
Thirteen patients did not have post-contrast MRI scans.
Five patients did not have evaluation of MUCCA due to imaging artefacts or the absence of spinal cord imaging.
Biochemical data from single laboratory.
Number and proportion of patients with abnormal (under −1.5 SD) cognitive performance.
Reasons for DD
DD were determined by healthcare providers (i.e. physician-dependent) in 28.7% of patients (n = 42), mostly (n = 22) because of a neurologist’s initial misdiagnosis (Table 3). Misdiagnoses were determined by incorrect classifications of symptoms, failures to conduct a complete diagnostic workup and/or incorrect interpretations of findings. The most frequent misdiagnosis by a neurologist was peripheral neurological syndrome in MS patients with CNS symptoms (n = 8); 7 cases (4.7%) had DD determined by slow diagnostic workups attributed to late paraclinical testing or late referral to an MS centre (Table 3). DDs were patient-dependent in 35 patients (24.0%), mostly due to medical consultation being delayed because the symptoms were mild (n = 19), attributed to psychological stress (n = 7) or had spontaneous remission (n = 6) (Tables 3 and 4 and Figure 1).
Table 3.
Determinants of diagnosis delay.
| Determinants of diagnostic delay | Number (%)
a
n = 77 |
|---|---|
| Patient | 35 (45.5%) |
| Mild symptoms | 19 (24.7%) |
| Related to psychological stress | 7 (9.1%) |
| Full remission of symptoms | 6 (7.8%) |
| Related to pregnancy | 1 (1.3%) |
| Related to migraine symptoms | 1 (1.3%) |
| Did not find time to visit physician | 1 (1.3%) |
| Medical doctor (or other healthcare provider) | 42 (54.5%) |
| Neurologist misdiagnosis | 22 (28.6%) |
| Slow diagnostic process by neurologist (MRI scan > 2 months; referring to MS centre > 2 months) | 7 (9.1%) |
| Ophthalmologist misdiagnosis | 6 (7.8%) |
| Neurologist waited for MRI activity to confirm diagnosis | 2 (2.6%) |
| Otorhinolaryngologist misdiagnosis | 2 (2.6%) |
| General practitioner misdiagnosis | 1 (1.3%) |
| Orthopaedist misdiagnosis | 1 (1.3%) |
| Physiotherapist misdiagnosis | 1 (1.3%) |
MRI: magnetic resonance imaging; MS: multiple sclerosis.
Calculated as the proportion from the group of 77 patients with diagnostic delay.
Table 4.
Determinants of multiple sclerosis misdiagnosis by neurologists.
| Determinants of misdiagnosis | n = 22 (15.1%) a |
|---|---|
| False positive diagnosis of peripheral neurological syndrome (radicular/pseudo-radicular syndrome or peripheral neuropathy) | 8 (36.4%) |
| Incorrectly excluded diagnosis of CIS based on normal brain MRI without indication of clinical and imaging follow-up. | 5 (18.2%) |
| Incorrectly excluded diagnosis of CIS or MS based on normal brain CT without indication of MR imaging and clinical and imaging follow-up | 1 (4.5%) |
| Incorrectly excluded diagnosis of CIS or MS based on normal CSF examination | 1 (4.5%) |
| Symptoms attributed to comorbid Leber hereditary optic neuropathy | 1 (4.5%) |
| Symptoms attributed to comorbid myasthenia gravis | 1 (4.5%) |
| False positive diagnosis of unspecific ophthalmological symptom other than RBN | 1 (4.5%) |
| False positive diagnosis of migraine with aura | 1 (4.5%) |
| False positive diagnosis of infectious encephalomyelitis | 1 (4.5%) |
| False positive diagnosis of peripheral vestibular syndrome | 1 (4.5%) |
| False positive diagnosis of neuroborreliosis | 1 (4.5%) |
CIS: clinically isolated syndrome; MRI: magnetic resonance imaging; MS: multiple sclerosis; CT: computed tomography; CSF: cerebrospinal fluid; RBN: retrobulbar neuritis.
Calculated as the proportion of patients from the entire group of 146 patients with or without diagnostic delay.
Association between DD and disease outcomes
We found correlation trends between longer DD and greater EDSS (Spearman’s rho = 0.17; p = 0.046), greater total lesion number (rho = 0.19; p = 0.025), greater infratentorial lesion volume (rho = 0.18; p = 0.034) and greater CSF-NfL levels (rho = 0.23; p = 0.046; n = 76) at the time of diagnosis.
Adjusted linear regression confirmed these trends for EDSS (beta (B) = 0.03; p = 0.034; adjusted p[8] = 0.27) but not for CSF-NfL (B = 0.09; p = 0.098), total lesion number (B = 0.06; p = 0.091) or infratentorial lesion volume (B = 0.02; p = 0.70). Adjusted linear regression showed a trend for an association between longer DD and a greater sNfL z-score (B = 0.35; p = 0.031; adjusted p[5] = 0.16); however, Spearman’s correlation was not significant (rho = 0.18; p = 0.078; n = 98) (Figures 2–4).
Figure 2.
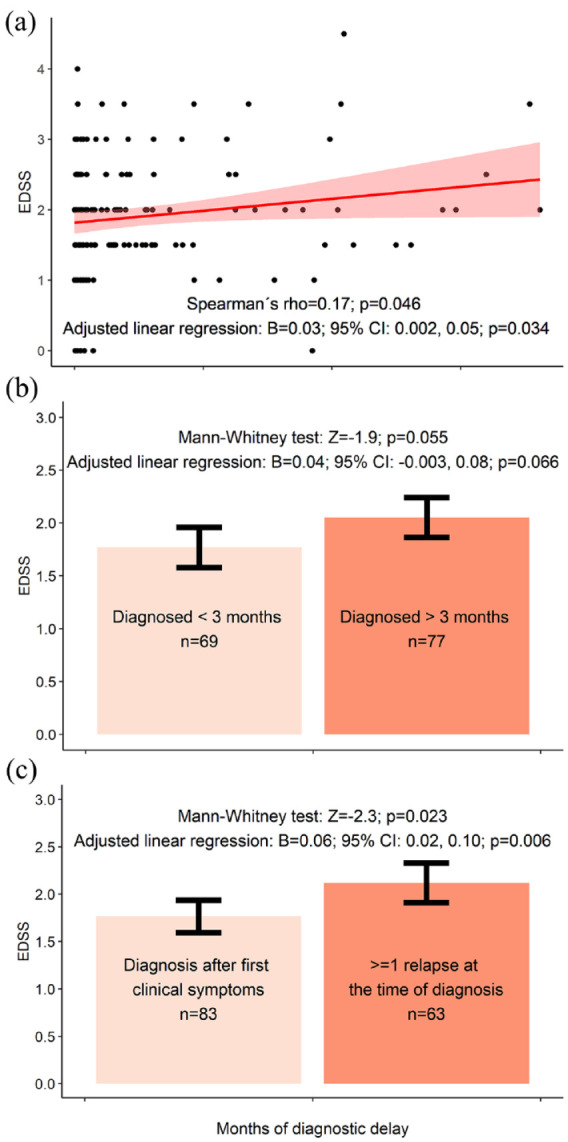
(a) Correlation between disability status and diagnostic delay. (b) Comparison of disability status in patients with and without diagnostic delay. (c) Comparison of disability status in patients with and without previous relapse at the time of multiple sclerosis diagnosis. The results are presented as mean values with corresponding 95% confidence intervals. One outlier with diagnostic delay of 256 months is not depicted in the figure but has been included in the statistical analysis.
Figure 3.
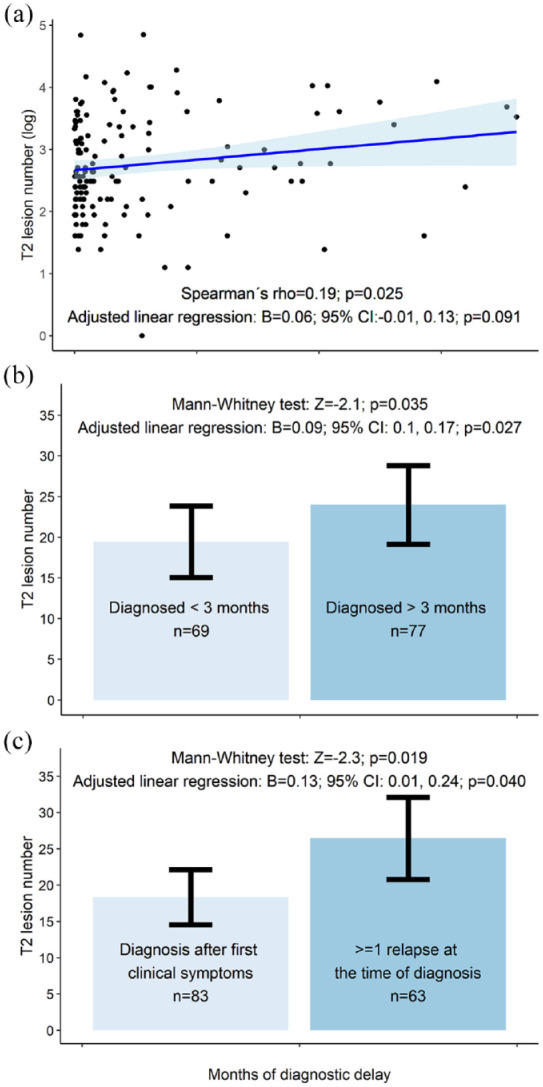
(a) Correlation between lesion burden and diagnostic delay. (b) Comparison of lesion burden in patients with and without diagnostic delay. (c) Comparison of lesion burden in patients with and without previous relapse at the time of multiple sclerosis diagnosis. The results are presented as mean values with corresponding 95% confidence intervals. One outlier with diagnostic delay of 256 months is not depicted in the figure but has been included in the statistical analysis.
Figure 4.

(a) Correlation between neurofilament levels and diagnostic delay. (b) Comparison of neurofilament levels in patients with and without diagnostic delay. (c) Comparison of neurofilament levels in patients with and without previous relapse at the time of multiple sclerosis diagnosis. The results are presented as mean values with corresponding 95% confidence intervals. One outlier with diagnostic delay of 256 months is not depicted in the figure but has been included in the statistical analysis.
For EDSS functional scores, the strongest association was between DD and pyramidal scores (B = 0.27; p = 0.001; adjusted p[8] = 0.008). Education levels did not influence DD (rho = 0.40; p = 0.65). Patients with motor symptoms and polysymptomatic clinical presentations at the time of diagnosis did not show increased DD (data not shown).
Comparison of patients with (>3 months) and without (⩽3 months) DD
No differences were found between patients with and without DD. Patients with DD had a trend towards greater baseline EDSS score when the delay threshold was 6 months (MW: Z = −2.6; p = 0.009; B = 0.22; p = 0.006; adjusted p[8] = 0.042) or 9 months (MW: Z = −1.80; p = 0.071; B = 0.16; p = 0.046; adjusted p[8] = 0.34). No differences were found for thresholds of 12 or 24 months (data not shown).
Comparison of patients with and without previous relapsing activity
Compared with patients diagnosed at their first clinical relapse, patients (n = 63) with a history of >1 relapse at the time of diagnosis had a trend towards greater EDSS scores (MW: Z = −2.3; p = 0.023; adjusted p[8] = 0.16) total lesion number (Z = −2.3; p = 0.019; adjusted p[5] = 0.095), periventricular lesion number (Z = −2.0; p = 0.041; adjusted p[5] = 0.21), infratentorial lesion volume (Z = −2.3; p = 0.022; adjusted p[6] = 0.13) and CSF-NfL levels (Z = −2.1; p = 0.035; adjusted p[5] = 0.18; n = 76). Except for CSF-NfL and sNfL, these trends were confirmed using adjusted linear regression analysis (Figures 2–4). For example, patients experiencing their second or later relapse at the time of diagnosis had 0.37 points greater EDSS than patients diagnosed at their first clinical symptom (95% confidence interval (CI) = 0.11–0.62; p = 0.005; adjusted p[8] = 0.035; model without (log x + 1) transformed EDSS).
Prediction of future disease activity
New relapse activity occurred in 51.4% (75/146) of patients; 12 (8.2%) patients showed EDSS worsening after post-diagnosis DMT initiation. The median time to first relapse was 156 days (IQR = 81–395 days); median time to EDSS worsening was 485 days (IQR = 400–588 days). Neither greater diagnostic lag nor history of previous relapsing activity were associated with a greater risk of new relapse or EDSS worsening in adjusted Cox proportional hazard models (data not shown). Only the sNfL z-score at the time of diagnosis showed a trend for higher risk of EDSS worsening (hazard ratio (HR) = 2.12; 95% CI = 1.07–4.22; p = 0.031; adjusted p[5] = 0.16).
Discussion
A delayed MS diagnosis was identified in more than half of the patients; almost a third of all cases showed a physician-dependent DD, mostly because of an initial misdiagnosis by the specialist. Patients with a DD showed a trend towards greater disease burden.
Prevalence of DD
Our study’s DD prevalence was comparable to contemporary cohorts,7,13–15,21 except for a small single study with a slightly shorter delay, 22 but shorter when compared to historical cohorts.9,12–14,17,32,20 This finding supports that DDs are decreasing probably because of more sensitive MS diagnostic criteria, 24 increased MRI availability, 5 and heightened awareness of MS among patients and physicians. 9 However, the predisposing factors remains inconclusive (Table 1). Our study found no evidence to support increased DDs in related to female 32 or male sex,7,19 younger9,11,15,16 or older age,13,18,19 lower education level,7,19 or the presence of optic or motor symptoms.9,18,19
The 3-month definition of DD may be too strict. However, the proportion of patients with DD remained high when this threshold increased to 6–24 months.
Reasons for DD
DDs were physician-dependent and patients-dependent in approximately one quarter of cases each; 15.1% of all MS patients examined by physicians received a false negative diagnosis from a neurologist; 4.7% experienced DD because of a neurologist’s slow diagnostic process. We hypothesize the proportions of medical specialties responsible for DD in our study may be country-specific and differ across geographical regions and healthcare systems. 23 For example, patients in the Czech Republic with neurological symptoms often bypass general practitioners and directly visit neurologists for consultation. Alternatively, general practitioners may refer patients to specialists without initiating a differential diagnostic process, making the evaluation of the primary care role in MS diagnosis challenging. Therefore, the proportion of patients misdiagnosed by general practitioners is probably greater in healthcare systems with more primary care involvement than specialty care and vice versa. 23
Czech Republic citizens have public health insurance and generally good access to comprehensive medical care, minimizing socioeconomic barriers.5,15 Therefore, only a minimal number of patients experienced DDs because of long waiting times for paraclinical testing of referral to an MS centre.
Consequences of DD
Short delays in DMT initiation may increase the risk of long-term disability. 33 Our study suggests even relatively short DDs are associated with unfavourable consequences on disease activity. Although a greater relapse frequency was not observed in patients with a longer DD, these patients tended to have numerous risk factors associated with unfavourable disease outcomes, including a greater EDSS scores, lesion numbers on brain MRI and NfL levels, at MS diagnosis.2,30,31 While previous studies reported associations between DD and greater current9,10 or future 6 disability, our study identified a novel relationship between DD and a greater lesion load and neuroaxonal damage assessed by NfL levels, suggesting DD negatively affects patient’s prognosis.30,31 The relationship between DD and these objective paraclinical measures of CNS damage highlights the importance of early diagnosis and treatment of MS for minimizing long-term CNS damage.
Clinical implications and future directions
Future multicentre studies on the effect of DD on long-term prognosis should include greater sample sizes, more-detailed radiological and biochemical assessments and longer follow-up periods. Such studies should also investigate predisposing factors, including decreased availability of medical services, 5 primary progressive phenotype7,9,11,12,18,19 and comorbidities.16,17 Future evaluations of potential interventions are also needed to minimize DDs. Whether short-term delays in diagnosis and DMT onset are associated with worse long-term prognoses warrant further investigation.
Considering the consequences of initiating DMT late, reducing DDs of MS should be a priority. Physician-dependent DDs are often determined by neurologists; therefore, educational efforts that focusing on common differential diagnostic issues in MS patients, including misdiagnosis of peripheral syndromes, might improve the diagnostic accuracy. Public awareness campaigns could increase early recognition of MS symptoms and motivate visits to healthcare providers.
A symptomatic prodromal phase may precede the onset of classic MS symptoms by >5–10 years; therefore, developing standardized criteria for identifying prodromal MS may also improve early MS diagnosis.23,34
Limitations
The study is susceptible to selection bias 35 since it was conducted at a single-centre and included only RRMS patients, limiting the generalization of our findings to other geographical regions, healthcare systems and MS phenotypes. Healthcare barriers for patients with MS in the Czech Republic are minimal, especially in Prague, and care is concentrated in regional MS centres. We speculate that the proportion of patients with DDs may be greater in regions with fewer healthcare services.
Although this study was ambispective, recall bias 35 cannot be excluded. In addition, phone-interview confirmations of suspected DDs were based on medical records from the initial neurological visit in MS centre; consequently, some patients without a documented history of MS symptoms may have been overlooked.
Caution should be exercised when relying solely on patient-reported symptoms of a previous MS episode. Although we were conservative in assessing clinical activity histories, a possibility of detection bias 35 remains for misinterpreting symptoms of MS.
Our study design has possible immortal time bias 35 because of uncertainty regarding the actual time of clinical disease onset; therefore, the survival model coefficients could be overestimated because some patient’s onset times could be earlier than reported. We minimized this possibility by setting the DMT initiation time as a study baseline. Considering only a few days or weeks elapsed between the MS diagnosis and DMT initiation, the analyses considered these as simultaneous events.
Interestingly, the greater EDSS scores at diagnosis in patients with DD disappeared when the DD threshold was set at 12 or 24 months. We speculate this unexpected result could be attributed to two factors: an unequal sample size among the subgroups, resulting in reduced statistical power, and an ascertainment bias 35 in which individuals with milder symptoms may take longer to seek medical attention and receive a diagnosis of MS.
After the introduction of the new McDonald 2017 criteria, 24 a few patients who had previously been diagnosed with CIS were reclassified as having the RRMS. Because almost all study patients had positive oligoclonal bands in CSF analysis, fulfilled the MRI criteria for dissemination in space and were treated with DMT having already been diagnosed with CIS, we believe this limitation had negligible effect on our data.
One reason for physician-dependent DD was incorrectly excluded diagnosis of CIS based on normal brain MRI without indication of clinical and imaging follow-up. We acknowledge that including these patients is debatable since patients with a first demyelinating symptom and normal brain MRI are unlikely to fulfil the diagnostic criteria. 24 During the follow-up period, these patients exhibited new relapses and MRI activity, meeting the diagnostic criteria for MS. Consequently, the date of the first clinical symptoms suggestive of MS was retrospectively defined as the date of MS onset. We believe that if closer clinical and MRI monitoring had been recommended to the patients, diagnoses could have been established significantly earlier. Although we acknowledge the complexity of these cases, they emphasize the crucial clinical issue of interpreting initial negative imaging findings in some patients at the early stages of MS. In this context, we need to emphasize that uncertainty remains regarding whether all other patients who reported a history of neurological symptoms (indicating the initial demyelinating event of MS) met the diagnostic criteria for MS at that time.
Finally, the short-term nature of our study precluded an analysis of the relationship between DD and long-term disability risk. Moreover, heterogeneous DMTs including high-efficacy treatments complicate the prediction of future disease activity.
Conclusion
DD in MS is a common phenomenon often determined by a misdiagnosis by a healthcare provider early in the disease and tends to be associated with a high disease burden. Therefore, our findings should be considered in healthcare policy and the education of healthcare providers and the general population. This study provides contemporary frequencies, determinants and consequences of DD in MS. Considering the single-centre nature of this study, our results warrant further investigations in other geographical regions and healthcare systems.
Supplemental Material
Supplemental material, sj-docx-1-msj-10.1177_13524585231197076 for Diagnostic delay of multiple sclerosis: prevalence, determinants and consequences by Tomas Uher, Adrian Adzima, Barbora Srpova, Libuse Noskova, Bénédicte Maréchal, Aleksandra Maleska Maceski, Jan Krasensky, Dominika Stastna, Michaela Andelova, Klara Novotna, Karolina Vodehnalova, Jiri Motyl, Lucie Friedova, Jiri Lindner, Veronica Ravano, Andrea Burgetova, Petr Dusek, Lenka Fialova, Eva Kubala Havrdova, Dana Horakova, Tobias Kober, Jens Kuhle and Manuela Vaneckova in Multiple Sclerosis Journal
Supplemental material, sj-docx-2-msj-10.1177_13524585231197076 for Diagnostic delay of multiple sclerosis: prevalence, determinants and consequences by Tomas Uher, Adrian Adzima, Barbora Srpova, Libuse Noskova, Bénédicte Maréchal, Aleksandra Maleska Maceski, Jan Krasensky, Dominika Stastna, Michaela Andelova, Klara Novotna, Karolina Vodehnalova, Jiri Motyl, Lucie Friedova, Jiri Lindner, Veronica Ravano, Andrea Burgetova, Petr Dusek, Lenka Fialova, Eva Kubala Havrdova, Dana Horakova, Tobias Kober, Jens Kuhle and Manuela Vaneckova in Multiple Sclerosis Journal
Supplemental material, sj-docx-3-msj-10.1177_13524585231197076 for Diagnostic delay of multiple sclerosis: prevalence, determinants and consequences by Tomas Uher, Adrian Adzima, Barbora Srpova, Libuse Noskova, Bénédicte Maréchal, Aleksandra Maleska Maceski, Jan Krasensky, Dominika Stastna, Michaela Andelova, Klara Novotna, Karolina Vodehnalova, Jiri Motyl, Lucie Friedova, Jiri Lindner, Veronica Ravano, Andrea Burgetova, Petr Dusek, Lenka Fialova, Eva Kubala Havrdova, Dana Horakova, Tobias Kober, Jens Kuhle and Manuela Vaneckova in Multiple Sclerosis Journal
Supplemental material, sj-docx-4-msj-10.1177_13524585231197076 for Diagnostic delay of multiple sclerosis: prevalence, determinants and consequences by Tomas Uher, Adrian Adzima, Barbora Srpova, Libuse Noskova, Bénédicte Maréchal, Aleksandra Maleska Maceski, Jan Krasensky, Dominika Stastna, Michaela Andelova, Klara Novotna, Karolina Vodehnalova, Jiri Motyl, Lucie Friedova, Jiri Lindner, Veronica Ravano, Andrea Burgetova, Petr Dusek, Lenka Fialova, Eva Kubala Havrdova, Dana Horakova, Tobias Kober, Jens Kuhle and Manuela Vaneckova in Multiple Sclerosis Journal
Acknowledgments
The authors thank the patients who participated in this study.
Footnotes
Data Availability: The anonymized data not published in this article will be made available upon reasonable request from a qualified investigator.
The author(s) declared the following potential conflicts of interest with respect to the research, authorship and/or publication of this article: A.A. L.N., A.M.M., J.L., V.R., A.B., K.N. and L.F. have nothing to disclose. M.V. received speaker honoraria and consultant fees from Biogen, Novartis, Roche, Sanofi/Genzyme, TEVA, as well as support for research activities from Biogen Idec. B.S. received compensation for travelling and conference fees from Novartis, Sanofi, Biogen, Roche and Merck as well as support for research activities from Biogen. B.M. and T.K. are the employees of Siemens Healthineers International AG, Switzerland. J.K. received financial support for research activities from Biogen Idec. D.S. received financial support for conference travel from Novartis, Biogen, Merck, Bayer and Janssen-Cilag. M.A. received financial support for conference travel from Novartis, Genzyme, Merck Serono, Biogen Idec and Roche. K.V. received compensation for travelling, and conference fees from Biogen, Novartis and Merck. J.M. received compensation for travelling, conference fees and speaker honoraria from Sanofi Genzyme, Biogen, Novartis and Merck. P.D. received speaker honoraria from Orphalan and consultant fees from Alexion Pharmaceuticals, Inc. E.K.H. received speaker honoraria and consultant fees from Biogen Idec, Merck Serono, Novartis, Genzyme, Teva, Actelion and Receptos, as well as support for research activities from Biogen Idec and Merck Serono. D.H. received compensation for travel, speaker honoraria and consultant fees from Biogen Idec, Novartis, Merck Serono, Bayer Shering and Teva, as well as support for research activities from Biogen Idec. J.K. received speaker fees, research support, travel support and/or served on the advisory boards by ECTRIMS, Swiss MS Society, Swiss National Research Foundation, (320030_160221), University of Basel, Bayer, Biogen, Celgene, Genzyme, Merck, Novartis, Protagen AG, Roche and Teva. T.U. received financial support for conference travel and honoraria from Biogen Idec, Novartis, Roche, Genzyme and Merck Serono, as well as support for research activities from Biogen Idec and Sanofi.
Funding: The author(s) disclosed receipt of the following financial support for the research, authorship and/or publication of this article: The project has received the following support: The project National Institute for Neurological Research (Programme EXCELES, ID project no. LX22NPO5107) funded by the European Union-Next Generation EU; Czech Ministry of Health project – grant NU22-04-00193 and Charles University Grant Agency (GAUK) 230217; Institutional support of the hospital research RVO VFN 64165; Czech Ministry of Education – project Cooperatio LF1, research area Neuroscience. Assessment of serum neurofilament light chain levels was supported by Biogen
ORCID iDs: Tomas Uher  https://orcid.org/0000-0003-3160-9022
Jiri Motyl
https://orcid.org/0000-0002-7315-1251
Veronica Ravano
https://orcid.org/0000-0002-1532-9664
Tobias Kober
https://orcid.org/0000-0001-7598-9456
Supplemental Material: Supplemental material for this article is available online.
Contributor Information
Tomas Uher, Department of Neurology and Center of Clinical Neuroscience, First Faculty of Medicine and General University Hospital, Charles University, Prague, Czech Republic.
Adrian Adzima, Department of Neurology and Center of Clinical Neuroscience, First Faculty of Medicine and General University Hospital, Charles University, Prague, Czech Republic.
Barbora Srpova, Department of Neurology and Center of Clinical Neuroscience, First Faculty of Medicine and General University Hospital, Charles University, Prague, Czech Republic.
Libuse Noskova, Institute of Medical Biochemistry and Laboratory Diagnostics, First Faculty of Medicine and General University Hospital, Charles University, Prague, Czech Republic.
Bénédicte Maréchal, Advanced Clinical Imaging Technology, Siemens Healthineers International AG, Lausanne, Switzerland/Department of Radiology, Lausanne University Hospital and University of Lausanne, Lausanne, Switzerland/Signal Processing Laboratory (LTS5), École Polytechnique Fédérale de Lausanne (EPFL), Lausanne, Switzerland.
Aleksandra Maleska Maceski, Departments of Medicine, Biomedicine and Clinical Research, Neurologic Clinic and Policlinic, University Hospital Basel, University of Basel, Basel, Switzerland.
Jan Krasensky, Department of Radiology, Charles University in Prague, First Faculty of Medicine and General University Hospital in Prague, Czech Republic.
Dominika Stastna, Department of Neurology and Center of Clinical Neuroscience, First Faculty of Medicine and General University Hospital, Charles University, Prague, Czech Republic.
Michaela Andelova, Department of Neurology and Center of Clinical Neuroscience, First Faculty of Medicine and General University Hospital, Charles University, Prague, Czech Republic.
Klara Novotna, Department of Neurology and Center of Clinical Neuroscience, First Faculty of Medicine and General University Hospital, Charles University, Prague, Czech Republic.
Karolina Vodehnalova, Department of Neurology and Center of Clinical Neuroscience, First Faculty of Medicine and General University Hospital, Charles University, Prague, Czech Republic.
Jiri Motyl, Department of Neurology and Center of Clinical Neuroscience, First Faculty of Medicine and General University Hospital, Charles University, Prague, Czech Republic.
Lucie Friedova, Department of Neurology and Center of Clinical Neuroscience, First Faculty of Medicine and General University Hospital, Charles University, Prague, Czech Republic.
Jiri Lindner, Department of Radiology, Charles University in Prague, First Faculty of Medicine and General University Hospital in Prague, Czech Republic.
Veronica Ravano, Advanced Clinical Imaging Technology, Siemens Healthineers International AG, Lausanne, Switzerland/Department of Radiology, Lausanne University Hospital and University of Lausanne, Lausanne, Switzerland/Signal Processing Laboratory (LTS5), École Polytechnique Fédérale de Lausanne (EPFL), Lausanne, Switzerland.
Andrea Burgetova, Department of Radiology, Charles University in Prague, First Faculty of Medicine and General University Hospital in Prague, Czech Republic.
Petr Dusek, Department of Neurology and Center of Clinical Neuroscience, First Faculty of Medicine and General University Hospital, Charles University, Prague, Czech Republic/Department of Radiology, Charles University in Prague, First Faculty of Medicine and General University Hospital in Prague, Czech Republic.
Lenka Fialova, Institute of Medical Biochemistry and Laboratory Diagnostics, First Faculty of Medicine and General University Hospital, Charles University, Prague, Czech Republic.
Eva Kubala Havrdova, Department of Neurology and Center of Clinical Neuroscience, First Faculty of Medicine and General University Hospital, Charles University, Prague, Czech Republic.
Dana Horakova, Department of Neurology and Center of Clinical Neuroscience, First Faculty of Medicine and General University Hospital, Charles University, Prague, Czech Republic.
Tobias Kober, Advanced Clinical Imaging Technology, Siemens Healthineers International AG, Lausanne, Switzerland/Department of Radiology, Lausanne University Hospital and University of Lausanne, Lausanne, Switzerland/Signal Processing Laboratory (LTS5), École Polytechnique Fédérale de Lausanne (EPFL), Lausanne, Switzerland.
Jens Kuhle, Multiple Sclerosis Centre and Research Center for Clinical Neuroimmunology and Neuroscience (RC2NB), Departments of Biomedicine and Clinical Research, University Hospital and University of Basel, Basel, Switzerland; Department of Neurology, University Hospital and University of Basel, Basel, Switzerland.
Manuela Vaneckova, Department of Radiology, Charles University in Prague, First Faculty of Medicine and General University Hospital in Prague, Czech Republic.
References
- 1. Brown JWL, Coles A, Horakova D, et al. Association of initial disease-modifying therapy with later conversion to secondary progressive multiple sclerosis. JAMA 2019; 321: 175–187. [DOI] [PMC free article] [PubMed] [Google Scholar]
- 2. Giovannoni G, Butzkueven H, Dhib-Jalbut S, et al. Brain health: time matters in multiple sclerosis. Mult Scler Relat Disord 2016; 9(suppl 1): S5–S48. [DOI] [PubMed] [Google Scholar]
- 3. Clinical guideline [CG186] multiple sclerosis in adults: management. 2019. https://www.nice.org.uk/guidance/cg186
- 4. Hobart J, Bowen A, Pepper G, et al. International consensus on quality standards for brain health-focused care in multiple sclerosis. Mult Scler 2019; 25(13): 1809–1818. [DOI] [PMC free article] [PubMed] [Google Scholar]
- 5. Solomon AJ, Marrie RA, Viswanathan S, et al. global barriers to the diagnosis of multiple sclerosis: data from the multiple sclerosis international federation atlas of MS, third edition. Neurology 2023; 101(6): e624–e635. [DOI] [PMC free article] [PubMed] [Google Scholar]
- 6. Tintore M, Cobo-Calvo A, Carbonell P, et al. Effect of changes in MS diagnostic criteria over 25 years on time to treatment and prognosis in patients with clinically isolated syndrome. Neurology 2021; 97: e1641–e1652. [DOI] [PubMed] [Google Scholar]
- 7. Ghiasian M, Faryadras M, Mansour M, et al. Assessment of delayed diagnosis and treatment in multiple sclerosis patients during 1990-2016. Acta Neurol Belg 2021; 121(1): 199–204. [DOI] [PubMed] [Google Scholar]
- 8. Cárdenas-Robledo S, Lopez-Reyes L, Arenas-Vargas LE, et al. Delayed diagnosis of multiple sclerosis in a low prevalence country. Neurol Res 2021; 43(7): 521–527. [DOI] [PubMed] [Google Scholar]
- 9. Kingwell E, Leung AL, Roger E, et al. Factors associated with delay to medical recognition in two Canadian multiple sclerosis cohorts. J Neurol Sci 2010; 292: 57–62. [DOI] [PubMed] [Google Scholar]
- 10. Marrie RA, Cutter G, Tyry T, et al. Changes in the ascertainment of multiple sclerosis. Neurology 2005; 65: 1066–1070. [DOI] [PubMed] [Google Scholar]
- 11. Kaufmann M, Kuhle J, Puhan MA, et al. Factors associated with time from first-symptoms to diagnosis and treatment initiation of multiple sclerosis in Switzerland. Mult Scler J Exp Transl Clin 2018; 4(4): 2055217318814562. [DOI] [PMC free article] [PubMed] [Google Scholar]
- 12. Willumsen JS, Aarseth JH, Myhr KM, et al. High incidence and prevalence of MS in more and Romsdal county, Norway, 1950-2018. Neurol Neuroimmunol Neuroinflamm 2020; 7: e713. [DOI] [PMC free article] [PubMed] [Google Scholar]
- 13. Blaschke SJ, Ellenberger D, Flachenecker P, et al. Time to diagnosis in multiple sclerosis: Epidemiological data from the German multiple sclerosis registry. Mult Scler 2022; 28(6): 865–871. [DOI] [PubMed] [Google Scholar]
- 14. Jakimovski D, Kavak KS, Zakalik K, et al. Improvement in time to multiple sclerosis diagnosis: 25-year retrospective analysis from New York State MS CONSORTIUM (NYSMSC). Mult Scler 2023; 29(6): 753–756. [DOI] [PubMed] [Google Scholar]
- 15. Khedr EM, El Malky I, Hussein HB, et al. Multiple sclerosis diagnostic delay and its associated factors in Upper Egyptian patients. Sci Rep 2023; 13: 2249. [DOI] [PMC free article] [PubMed] [Google Scholar]
- 16. Marrie RA, Horwitz R, Cutter G, et al. Comorbidity delays diagnosis and increases disability at diagnosis in MS. Neurology 2009; 72: 117–124. [DOI] [PMC free article] [PubMed] [Google Scholar]
- 17. Thormann A, Sorensen PS, Koch-Henriksen N, et al. Comorbidity in multiple sclerosis is associated with diagnostic delays and increased mortality. Neurology 2017; 89: 1668–1675. [DOI] [PubMed] [Google Scholar]
- 18. Aires A, Barros A, Machado C, et al. Diagnostic delay of multiple sclerosis in a Portuguese population. Acta Med Port 2019; 32: 289–294. [DOI] [PubMed] [Google Scholar]
- 19. Patti F, Chisari CG, Arena S, et al. Factors driving delayed time to multiple sclerosis diagnosis: Results from a population-based study. Mult Scler Relat Disord 2022; 57: 103361. [DOI] [PubMed] [Google Scholar]
- 20. Fernández O, Fernández V, Arbizu T, et al. Characteristics of multiple sclerosis at onset and delay of diagnosis and treatment in Spain (the Novo Study). J Neurol 2010; 257(9): 1500–1507. [DOI] [PubMed] [Google Scholar]
- 21. Kelly SB, Chaila E, Kinsella K, et al. Multiple sclerosis, from referral to confirmed diagnosis: an audit of clinical practice. Mult Scler 2011; 17(8): 1017–1021. [DOI] [PubMed] [Google Scholar]
- 22. Adamec I, Barun B, Gabelić T, et al. Delay in the diagnosis of multiple sclerosis in Croatia. Clin Neurol Neurosurg 2013; 115(suppl 1): S70–S72. [DOI] [PubMed] [Google Scholar]
- 23. Gasperi C, Hapfelmeier A, Daltrozzo T, et al. Systematic assessment of medical diagnoses preceding the first diagnosis of multiple sclerosis. Neurology. Epub ahead of print 26 April 2021. DOI: 10.1212/WNL.0000000000012074 [DOI] [PubMed] [Google Scholar]
- 24. Thompson AJ, Banwell BL, Barkhof F, et al. Diagnosis of multiple sclerosis: 2017 revisions of the McDonald criteria. Lancet Neurol 2018; 17: 162–173. [DOI] [PubMed] [Google Scholar]
- 25. Dusankova JB, Kalincik T, Havrdova E, et al. Cross cultural validation of the Minimal Assessment of Cognitive Function in Multiple Sclerosis (MACFIMS) and the Brief International Cognitive Assessment for Multiple Sclerosis (BICAMS). Clin Neuropsychol 2012; 26(7): 1186–1200. [DOI] [PubMed] [Google Scholar]
- 26. Rao SM. A manual for the brief repeatable battery of neuropsychological tests in multiple sclerosis. New York: National Multiple Sclerosis Society, 1990. [Google Scholar]
- 27. Fartaria MJ, Bonnier G, Roche A, et al. Automated detection of white matter and cortical lesions in early stages of multiple sclerosis. J Magn Reson Imaging 2016; 43(6): 1445–1454. [DOI] [PubMed] [Google Scholar]
- 28. Schmitter D, Roche A, Maréchal B, et al. An evaluation of volume-based morphometry for prediction of mild cognitive impairment and Alzheimer’s disease. Neuroimage Clin 2015; 7: 7–17. [DOI] [PMC free article] [PubMed] [Google Scholar]
- 29. Andelova M, Uher T, Krasensky J, et al. Additive effect of spinal cord volume, diffuse and focal cord pathology on disability in multiple sclerosis. Front Neurol 2019; 10: 820. [DOI] [PMC free article] [PubMed] [Google Scholar]
- 30. Uher T, Havrdova EK, Benkert P, et al. Measurement of neurofilaments improves stratification of future disease activity in early multiple sclerosis. Mult Scler 2021; 27(13): 2001–2013. [DOI] [PubMed] [Google Scholar]
- 31. Benkert P, Meier S, Schaedelin S, et al. Serum neurofilament light chain for individual prognostication of disease activity in people with multiple sclerosis: a retrospective modelling and validation study. Lancet Neurol 2022; 21(3): 246–257. [DOI] [PubMed] [Google Scholar]
- 32. Marrie RA, Horwitz R, Cutter G, et al. The burden of mental comorbidity in multiple sclerosis: frequent, underdiagnosed, and undertreated. Mult Scler 2009; 15(3): 385–392. [DOI] [PubMed] [Google Scholar]
- 33. Cobo-Calvo A, Tur C, Otero S, et al. Very early treatment decreases the risk of long-term disability in patients with CIS or early MS. Amsterdam, The Netherlands: ECTRIMS; 2022. [Google Scholar]
- 34. Marrie RA, Allegretta M, Barcellos LF, et al. From the prodromal stage of multiple sclerosis to disease prevention. Nat Rev Neurol 2022; 18(9): 559–572. [DOI] [PubMed] [Google Scholar]
- 35. Kalincik T, Butzkueven H. Observational data: understanding the real MS world. Mult Scler 2016; 22(13): 1642–1648. [DOI] [PubMed] [Google Scholar]
Associated Data
This section collects any data citations, data availability statements, or supplementary materials included in this article.
Supplementary Materials
Supplemental material, sj-docx-1-msj-10.1177_13524585231197076 for Diagnostic delay of multiple sclerosis: prevalence, determinants and consequences by Tomas Uher, Adrian Adzima, Barbora Srpova, Libuse Noskova, Bénédicte Maréchal, Aleksandra Maleska Maceski, Jan Krasensky, Dominika Stastna, Michaela Andelova, Klara Novotna, Karolina Vodehnalova, Jiri Motyl, Lucie Friedova, Jiri Lindner, Veronica Ravano, Andrea Burgetova, Petr Dusek, Lenka Fialova, Eva Kubala Havrdova, Dana Horakova, Tobias Kober, Jens Kuhle and Manuela Vaneckova in Multiple Sclerosis Journal
Supplemental material, sj-docx-2-msj-10.1177_13524585231197076 for Diagnostic delay of multiple sclerosis: prevalence, determinants and consequences by Tomas Uher, Adrian Adzima, Barbora Srpova, Libuse Noskova, Bénédicte Maréchal, Aleksandra Maleska Maceski, Jan Krasensky, Dominika Stastna, Michaela Andelova, Klara Novotna, Karolina Vodehnalova, Jiri Motyl, Lucie Friedova, Jiri Lindner, Veronica Ravano, Andrea Burgetova, Petr Dusek, Lenka Fialova, Eva Kubala Havrdova, Dana Horakova, Tobias Kober, Jens Kuhle and Manuela Vaneckova in Multiple Sclerosis Journal
Supplemental material, sj-docx-3-msj-10.1177_13524585231197076 for Diagnostic delay of multiple sclerosis: prevalence, determinants and consequences by Tomas Uher, Adrian Adzima, Barbora Srpova, Libuse Noskova, Bénédicte Maréchal, Aleksandra Maleska Maceski, Jan Krasensky, Dominika Stastna, Michaela Andelova, Klara Novotna, Karolina Vodehnalova, Jiri Motyl, Lucie Friedova, Jiri Lindner, Veronica Ravano, Andrea Burgetova, Petr Dusek, Lenka Fialova, Eva Kubala Havrdova, Dana Horakova, Tobias Kober, Jens Kuhle and Manuela Vaneckova in Multiple Sclerosis Journal
Supplemental material, sj-docx-4-msj-10.1177_13524585231197076 for Diagnostic delay of multiple sclerosis: prevalence, determinants and consequences by Tomas Uher, Adrian Adzima, Barbora Srpova, Libuse Noskova, Bénédicte Maréchal, Aleksandra Maleska Maceski, Jan Krasensky, Dominika Stastna, Michaela Andelova, Klara Novotna, Karolina Vodehnalova, Jiri Motyl, Lucie Friedova, Jiri Lindner, Veronica Ravano, Andrea Burgetova, Petr Dusek, Lenka Fialova, Eva Kubala Havrdova, Dana Horakova, Tobias Kober, Jens Kuhle and Manuela Vaneckova in Multiple Sclerosis Journal