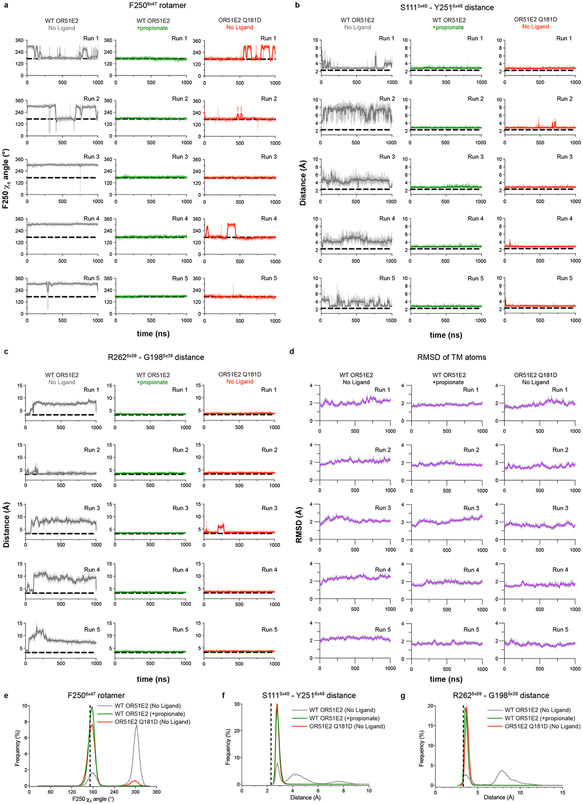
Extended Data Figure 8. OR51E2 molecular dynamics simulation trajectories.
a-c) Simulation trajectories for WT and Q18145x53D OR51E2 are shown in a-c. Five independent runs at different velocities are shown for each condition (top to bottom). a) F2506x47 χ1 angle over replicate simulations. b) Minimum distance between oxygen atoms of the hydroxyl groups in the side chains of S111 and Y2516x48 over replicate simulations. c) Minimum distance between R2626x59 sidechain atoms and G1985x39 mainchain atoms (excluding the hydrogens) for replicate simulations. d) Root-mean-square deviation (RMSD) values for TM backbone atoms in the transmembrane helices (see methods) calculated with reference to the equilibrated structure of the no ligand and propionate bound OR51E2 simulations, as well as for simulations of Q18145x53D OR51E2 from 5 independent MD simulation replicates (top to bottom). Thick traces represent smoothed values with an averaging window of 8 nanoseconds; thin traces represent unsmoothed values. e-f) Aggregate frequency distributions are shown for F2506x47 χ1 angle (e), minimum distance between heavy atoms of the hydroxyl groups of S1113x40 and Y2516x48 (f), and minimum distance between R2626x59 sidechain heavy atoms and G1985x39 main chain heavy atoms (excluding hydrogens) (g) using all five simulation replicates for each condition.

