

Abstract
Background and Objectives
The Veterans RAND 12-Item Health Survey (VR-12) is a generic patient-reported outcome measure of physical and mental health status. An adapted version of the VR-12 was developed for use with older adults living in long-term residential care (LTRC) homes in Canada: VR-12 (LTRC-C). This study aimed to evaluate the psychometric validity of the VR-12 (LTRC-C).
Research Design and Methods
Data for this validation study were collected via in-person interviews for a province-wide survey of adults living in LTRC homes across British Columbia (N = 8,657). Three analyses were conducted to evaluate validity and reliability: (1) confirmatory factor analyses were conducted to validate the measurement structure; (2) correlations with measures of depression, social engagement, and daily activities were examined to evaluate convergent and discriminant validity; and (3) Cronbach’s alpha (r) statistics were obtained to evaluate internal consistency reliability.
Results
A measurement model with 2 correlated latent factors (representing physical health and mental health), 4 cross-loadings, and 4 correlated items resulted in an acceptable fit (root-mean-square error of approximation = 0.07; comparative fit index = 0.98). Physical and mental health were correlated in expected directions with measures of depression, social engagement, and daily activities, though the magnitudes of the correlations were quite small. Internal consistency reliability was acceptable for physical and mental health (r > 0.70).
Discussion and Implications
This study supports the use of the VR-12 (LTRC-C) to measure perceived physical and mental health among older adults living in LTRC homes.
Keywords: Cross, sectional survey, Health, related quality of life, Long, term care, Patient, reported outcome measurement, Psychometrics
In Canada, facilities in the long-term residential care (LTRC) sector are designed to ensure the safety and security of frail and vulnerable older adults. In LTRC settings, resident populations are tracked using a wide range of indicators (e.g., fall and infection rates, staffing levels, use of certain medications, and complaints), with success in these areas viewed as a signal of high quality. In British Columbia (BC), the BC Office of the Seniors Advocate (OSA) has a statutory obligation to monitor services provided to seniors in the province and to report to the public on issues of concern. Although it is important to monitor clinical and administrative indicators as a measure of the quality and safety of the care provided to residents in LTRC homes, the OSA aimed to better understand the quality of care and health status from the perspective of those living in LTRC. With this in mind, the OSA included older adults living in LTRC, the frail and vulnerable in our society, in assessing the quality of their care by answering two overarching questions at the population level:
How is your care? (measuring self-reported quality of care experiences), and
How are you doing? (measuring self-reported health status).
These guiding principles motivated the OSA to commission the large-scale Residential Care Survey conducted in 2016–17 to measure both the quality of care and health status in LTRC homes from the perspective of every resident living in all care homes in the province with publicly funded beds. Hereafter, the focus of this paper is on measuring residents’ self-reported health status.
To assess residents’ self-reported physical and mental health status, the survey included a generic patient-reported outcome (PRO) measure, specifically, a version of the Veterans Rand 12-Item Health Survey (VR-12) that was adapted for adults living in LTRC in Canada: VR-12 (LTRC-C; Wilson et al., 2022). PRO measures are tools that can be used to collect information about a person’s health status directly from the person (via self-report or interview) by asking the respondent to provide self-reported ratings to questions about important aspects of their health, including their symptoms (e.g., pain and fatigue), as well as impacts on their general health (GH), physical health, activities of daily living (ADLs), social health, and mental health (McKenna, 2011). Generic PRO measures assess health domains that are not unique to any disease (e.g., physical, mental, emotional, and social functioning), while disease-specific PRO measures focus on assessing symptoms and/or impacts related to a particular condition. Given that LTRC residents live with complex care needs (e.g., multiple chronic conditions), a generic PRO measure has more utility in this setting than a disease-specific PRO measure. Importantly, generic PRO measures allow for comparisons across diverse health conditions within the general population, including the LTRC population (Haywood et al., 2005; Weldring & Smith, 2013). Conversely, disease-specific PRO measures do not allow for comparisons across multiple chronic conditions found in the LTRC setting, or with the general population. Although generic PRO measures have been used to assess health status in older populations living with a chronic condition(s) (Hayes et al., 1995; Haywood et al., 2005; Parker et al., 1998; Pugh et al., 2005; Rebollo et al., 1998; Schick-Makaroff et al., 2021; Schlenk et al., 1997) and a few studies have used PRO measures specifically developed for people living in LTRC (e.g., Almomani et al., 2014; Drageset et al., 2008, 2009; Tabali et al., 2015), research on using existing generic PRO measures or adapting existing PRO measures for use with older adults living in LTRC is limited (Hickey et al., 2005). As such, psychometric measurement validity evidence is needed to justify the use of a generic PRO measure among LTRC populations and to allow for comparisons with other populations.
A particular challenge regarding the use of generic PROs with older adults living in LTRC is that items or wording included in some tools may not be relevant to the population or setting. For example, generic PROs often include questions about activities or experiences that do not occur in LTRC settings (e.g., climbing several flights of stairs, vacuuming, etc.). Consequently, adaptions would be required to ensure the applicability of items and wording. Following such adaptation, validation research, both qualitative (content validity) and quantitative (construct validity, reliability), must be conducted to ensure measurement validity of the adapted version (Housen et al., 2008; Patrick et al., 2011; Rothman et al., 2009; Snyder et al., 2007). Although a few studies have addressed the validation of existing PRO measures that assess perceived health status in older adult populations in general (Bartsch et al., 2011; Gandek et al., 2004; Hayes et al., 1995; Kazis, Lee, et al., 2004; Peek et al., 2004; von Renteln-Kruse et al., 2006), measurement validity evidence focusing specifically on the use of generic PROs among older adults living in LTRC settings is limited.
The Medical Outcomes Study 36-Item Short-Form Health Survey (SF-36) (version 1.0; Ware & Sherbourne, 1992), and the related family of “SF-36 measures,” including the more recently developed Veterans RAND 36-Item Health Survey (VR-36) and the Veterans RAND 12-Item Health Survey (VR-12; Kazis, 2000; Kazis, Miller, et al., 2004; Selim et al., 2009), are among the most widely used generic PRO measures in population health surveys (Bryan et al., 2014; Selim et al., 2009, 2019). Reviews of psychometric studies provide measurement validity evidence of the SF-36 family of instruments, including support for their use in older adult populations (Bryan et al., 2014; Haywood et al., 2005). A potentially suitable generic PRO measure for older adults living in LTRC is the brief, self-administered VR-12 (previously known as the Veterans SF-12; Kazis et al., 1998, 1999), which is available upon request without cost for licensing to nonprofit and academic organizations. The key advantage of using the 12-item version to assess self-perceived physical and mental health status among residents living in LTRC homes is that it is a useful tool for minimizing respondent burden, which is particularly important in populations who may experience varying levels of cognitive impairment and functional limitations due to chronic conditions. The VR-12 includes those 12 items from the longer VR-36 (which was based on the SF-36v.1) that contributed most to the physical and mental health summary scores (Jones et al., 2001; Kazis et al., 2006). In 2007, VR-12 replaced the SF-36v.1 as the primary measure of perceived physical and mental health status in the Medicare Health Outcomes Survey in the United States (Kazis et al., 2012). However, although the VR-12 has been widely used in the general population, validation of this PRO measure has not been conducted in adults living in LTRC homes. For that purpose, the VR-12 (LTRC-C) was developed based on the results of qualitative cognitive interviews with older adult residents living in a LTRC home setting (n = 18; Wilson et al., 2022). The cognitive interviews were conducted to examine older adults’ responses and interpretation of each item, as well as any difficulties experienced when answering the item (Willis, 2015). During the cognitive interviews, interviewers read each item aloud followed by the item’s response options. To support residents in keeping track of the different response options, interviewers used visual response boards when reading each answer option aloud. These boards were developed using the same wording and formatting included in the original VR-12. Participants were then asked to select an answer that best reflected their views about their health. Immediately after receiving a response, the interviewer followed-up with structured and semistructured probes for each item to confirm the respondents’ item comprehension. Findings from the cognitive interviews indicated that two VR-12 items had limited acceptability among residents living in LTRC homes because they assess physical activities that do not typically take place in LTRC homes (e.g., “climbing several flights of stairs” and “pushing a vacuum cleaner”). Additionally, a few items referenced the word “work” which in the sense of paid employment is generally not applicable to those living in LTRC. From these findings, the VR-12 (LTRC-C) was developed, with adaptations including the replacement of the physical functioning items with items relevant to residents living in LTRC homes and removing the word “work” from the PRO measure. In addition, although the original VR-12 presents multiple items in a grid format with a single item stem (e.g., “During the past week”), the item context is repeated for all items in the VR-12 (LRTC-C), to improve item comprehensibility.
The purpose of this study was to evaluate the validity and reliability of the VR-12 (LTRC-C) for use among older adults living in LTRC homes in Canada. Specifically, the objectives of this study were to (a) confirm whether a psychometric measurement model for the VR-12 (LTRC-C) could be constructed that is consistent with the general theoretical model of the SF family of instruments and (b) evaluate the following measurement properties of the VR-12 (LTRC-C): item distribution, convergent and discriminant validity, and internal consistency reliability.
Design and Methods
Sample and Setting
This validation study involved the secondary analysis of data that were collected as a part of the BC OSA’s long-term care sector Residential Care Survey conducted in 2016 and 2017 (see www.seniorsadvocatebc.ca). The survey aimed to include all residents (irrespective of their cognitive status) living in BC’s 292 publicly funded LTRC homes who had resided in the care home for at least 2 weeks, as evidenced by the completion and recording of the residential assessment instrument-minimum data set (RAI-MDS 2.0) clinical health assessment for the resident in the health administrative database. Residents were excluded if they were living in group homes and family homes, in special care/behavioral units, in tertiary mental health units, receiving designated respite care, or in palliative care. Residents were also excluded if they were unresponsive when approached three times to participate in an interview. Across 292 LTRC homes, 22,162 residents were invited to participate, and 9,605 residents completed the BC OSA Residential Care Survey (43% response rate). Further details on the BC OSA Residential Care Survey are provided elsewhere (https://www.seniorsadvocatebc.ca/osa-reports/residential-care-survey). This study included those residents who completed the VR-12 (LTRC-C) in English, responded to at least one VR-12 (LTRC-C) item included in the physical and mental domains, and for whom an RAI-MDS 2.0 clinical assessment had been completed. The study was approved by the University of British Columbia—Providence Health Care Research Ethics Board and by the Trinity Western University Research Ethics Board.
Data Collection and Measures
Screened and trained volunteer interviewers who approached eligible residents (up to 3 times) to complete the BC OSA Residential Care Survey during a one-on-one interview. Survey interviews were conducted in the facility in a space that offered privacy for the respondent (e.g., the resident’s room). Visual response boards were used during the survey interview to help the resident keep track of the item’s response options. Residents’ demographic information and clinical health assessment data were available from administrative sources.
VR-12 (LTRC-C)
The adapted VR-12 (LTRC-C) is a 12-item generic PRO measure that was developed to assess self-perceived physical and mental health status among older adults living in LTRC homes (Wilson et al., 2022). This PRO measure was modified from the phone administration version of the original VR-12 with a 1-week (acute) recall period. The development of the adapted VR-12 (LTRC-C) followed established guidance for modifying an existing PRO measure (Rothman et al., 2009; Snyder et al., 2007), including conducting cognitive interviews among the target population to examine content validity. The sequence and response options for the items, as well as formatting, remained identical to the original VR-12. Further details on the development and content validity evidence for the VR-12 (LTRC-C) are reported elsewhere (Wilson et al., 2022).
The VR-12 (LTRC-C; Table 1) includes items that measure eight health domains, or scales, with a 1-week recall period: general health (i.e., self-rated health), physical functioning, role limitations due to physical problems (role-physical), bodily pain, role limitations due to emotional problems (role-emotional), vitality, mental health, and social functioning. Each scale contains one or two items, with response options ranging from 3 to 6 points on seven different Likert-type scales. Eight of the VR-12 (LTRC-C) items are reverse scored such that higher scores represented better health for all items. The VR-12 provides a physical component score (i.e., physical health domain) that provides larger weights for four of the domains (physical function, role-physical, bodily pain, and general health), and a mental component score (i.e., mental health domain) that provides larger weights for the four remaining domains (mental health, role-emotional, vitality, and social functioning). For the original VR-12, both physical and mental component summary scores are often standardized to a norm of 50 using a t-score transformation. The original VR-12 includes two additional items to assess change in physical and mental health over the past year, which are not part of the VR-12 scoring, and thus were not included in the psychometric analysis reported in this study.
Table 1.
The VR-12 Adapted for Use in Canadian Long-Term Residential Care Homes: VR-12 (LTRC-C)
| Item no. | Scale | Item |
|---|---|---|
| 1 | General health | In general, would you say your health is: |
| 2 | Physical function | Does your health now limit you in moderate activities, such as walking a block? |
| 3 | Physical function | Does your health now limit you in bathing and dressing yourself? |
| 4 | Role-physical | During the past week, have you accomplished less than you would like as a result of your physical health? |
| 5 | Role-physical | During the past week, were you limited in the kind of daily activities as a result of your physical health? |
| 6 | Role-emotional | During the past week, have you accomplished less than you would like as a result of any emotional problems? |
| 7 | Role-emotional | During the past week, did you not do activities as carefully as usual as a result of any emotional problems? |
| 8 | Bodily pain | During the past week, how much did pain interfere with your normal activities? |
| 9 | Mental health | How much of the time during the past week have you felt calm and peaceful? |
| 10 | Vitality | How much of the time during the past week did you have a lot of energy? |
| 11 | Mental health | How much of the time during the past week have you felt downhearted and blue? |
| 12 | Social functioning | During the past week, how much of the time has your physical health or emotional problems interfered with your social activities (like visiting with friends, relatives, etc.)? |
Notes: The VR-12 (LTRC-C) is a modified version of the original VR-12 (phone administration) for use in Canadian LTRC settings. VR-12 was developed from the Veterans RAND 36-Item Health Survey (VR-36) which was developed and modified from the original RAND version of the 36-Item Health Survey version 1.0 (also known as the “MOS SF-36”). These modifications were made by the British Columbia Ministry of Health’s Office of Patient-Centred Measurement in consultation with Lewis Kazis Sc.D. (a member of the original VR-12 scale development team). The sequence and response options for each item of the VR-12 (LTRC-C) remained identical to the VR-12. VR-12 = Veterans RAND 12-Item Health Survey.
Residential assessment instrument—minimum data set
Participants’ basic demographic information and scores on four clinical scales were obtained from administrative sources that included information originally collected by the LTRC facility during the completion of the RAI-MDS 2.0 (Morris et al., 1997). The RAI-MDS 2.0 is a tool widely used in Canadian LTRC homes to assess a resident’s care needs for care planning purposes, as well as to improve care quality, allocate resources, and understand populations (see www.interrai.org). Reliability and validity evidence for the suite of instruments included in the RAI-MDS 2.0 is reported elsewhere (Burrows et al., 2000; Hirdes et al., 2008, 2013; Hutchinson et al., 2010; Poss et al., 2008; Powell Laivton et al., 1998). This study used scores from four of the 10 outcome scales embedded in the RAI-MDS 2.0:
Cognitive performance scale (Morris et al., 1994) measures an individual’s cognitive status by combining information from five items: daily decision making; the level of consciousness; expressive communication; eating performance; and short-term memory (Morris et al., 1994). A 7-point hierarchical scale is used to rate cognitive impairment from intact to comatose (0–6).
Depression rating scale (Burrows et al., 2000) is used clinically to screen for depression. The scale uses seven items from the RAI-MDS 2.0 to assess symptom frequency (e.g., crying, tearfulness). Each item can receive a score of 0, 1, or 2 with a total score ranging from 0 to 14 (0 = no mood symptoms; 14 = all mood symptoms present in the last 3 days). Higher scores indicate poorer mental health, with a score of three or more indicating potential depression problems.
Index of social engagement (ISE) scale (Mor et al., 1995) is a quality of life measure that uses six items from the RAI-MDS 2.0 that describe the resident’s initiative and social involvement with the LTRC facility (e.g., at ease interacting with others). Scores can range from 0 to 6, with scores ranging from 3 to 6 indicating moderate to high levels of social engagement (Achterberg et al., 2003).
ADLs Long Form Scale (Morris et al., 1999) measures a resident’s ability to complete ADLs using seven items embedded within the RAI-MDS 2.0 (e.g., personal hygiene, toilet use, transfer, and dressing). Scale scores range from 1 to 28, with response categories ranging from 0 to 4 (total independence, some supervision, limited assistance, extensive assistance, and total dependence). Higher scores indicate poorer function.
Statistical Analysis
Relative frequencies were used to describe item response distributions. Confirmatory factor analysis (CFA) was used to address the first objective to confirm a psychometrically defensible measurement model for VR-12 (LTRC-C; Byrne, 2012). Because different measurement models of the SF-12 have been reported in other studies, we first evaluated the fit of these previously published models based on the VR-12 (LTRC-C) data from this study before considering the need for any modifications. All models included two correlated latent factors representing physical and mental health, consistent with the original theoretical model of the SF-36 family of instruments (Ware et al., 1996). Our goal was to identify which previously published model applied best to our data with minimal modification. Table 2 shows a complete description of all the models that were tested (i.e., Models 1–6), along with supporting evidence from psychometric studies. To evaluate the presence of an adequate fit between the hypothesized models and the observed categorical data, three goodness-of-fit indexes were examined. Although the Chi-square test (χ2) of model fit is a conventional absolute fit index, it is not recommended to rely solely on the Chi-square statistic to evaluate model fit for a larger sample size (Byrne, 2012). Thus, the combination of two different types of fit indexes and their recommended cutoff guidelines were also evaluated: (1) a root-mean-square error of approximation (RMSEA; absolute fit index) value between 0.06 and 0.08 to indicate an acceptable fit and values of 0.06 or less to indicate a good fit (Hu & Bentler, 1999; Schreiber et al., 2006); and (2) a comparative fit index (CFI; incremental/relative fit index) value between 0.90 and 0.95 for an acceptable fit (Marsh et al., 2004) and values greater than 0.95 for a good fit (Hu & Bentler, 1999; Schreiber et al., 2006). The residual correlations were also examined to identify potential areas of a misfit. Weighted least squares estimations with mean and variance adjustment were applied to accommodate the ordinal categorical nature of the data (Brown, 2006; Byrne, 2012). The pairwise deletion method was used to accommodate missing responses (Enders, 2013) for people who did not respond to one or more of the VR-12 (LTRC-C) items (a total of 7.1% missing data).
Table 2.
Tested Confirmatory Factor Analysis Models: Description and Supporting Literature
| Model | Description | Supporting literature |
|---|---|---|
| 1 | • All items contribute freely to both factors • Physical component score and mental component score uncorrelated |
Ware et al. (1996); Forero et al. (2013); Chum et al. (2016) |
| 2 | • Physical function, role-physical, bodily pain items load onto the physical component score (zero loadings on the mental component score) • Role-emotional, vitality, mental health, social functioning items load onto mental component score (zero loadings on the physical component score) • Physical component score and mental component score are correlated |
Anagnostopoulos et al. (2009); Hann & Reeves (2008); Maurischat et al. (2008); Maurischat et al. 2005; Fleishman et al. (2010); Okonkwo et al. (2010); Chum et al. (2016); Forero et al. (2013) |
| 3 | Same as Model 2 with the addition of: • Cross-loadings (general health, vitality, social functioning items) |
Selim et al. (2009); Fleishman & Lawrence (2003); Keller, Ware et al. (1998); Selim et al. (2009); Okonkwo et al. (2010) |
| 4 | Same as Model 2 with the addition of: • Scale item correlations (physical function items; role-physical items; role-emotional items; mental health items) |
Chum et al. (2016); Maurischat et al. 2008; Wilson et al. (2002) |
| 5 | Same as Model 2 with the addition of: • Cross-loadings (general health, vitality, social functioning items) • Scale item correlations (physical function items; role-physical items; role-emotional items; mental health items) |
Okonkwo et al. (2010) |
| 6a | Same as Model 5 with the addition of: • Cross-loading bodily pain |
Based on the results reported in this manuscript |
Notes: All models were first-order two latent factor models.
aModel 6 was the model used in the final analysis reported in this study.
Convergent and discriminant validity were examined based on Pearson correlations between the two latent factors, representing perceived physical and mental health, and other measures. Specifically, physical health was expected to be more strongly correlated with the functional scale and mental health with the depressive symptoms scale. Considering the items of the VR-12 (LTRC-C), both physical and mental health factors were expected to be correlated with the social engagement scale. Convergent and discriminant validity were assessed based on the strengths of the Pearson r correlation coefficients, with an r = 0.70 or greater indicating a strong relationship, an r between 0.50 and 0.30, indicating a moderate relationship, and an r less than 0.30 indicating a weak relationship (Mukaka, 2012). Cronbach’s α coefficients were calculated to evaluate internal consistency reliability for the perceived physical and mental health factors (Zumbo et al., 2007). A Cronbach’s α of 0.70 or greater was considered the threshold to indicate acceptable internal consistency reliability (Tavakol & Dennick, 2011). All descriptive statistics (e.g., respondent characteristics and distribution of item categories) were calculated in IBM SPSS Statistics for Windows, Version 24.0. All CFAs were conducted using MPlus software version 7.4 (Muthén & Muthén, 1998–2015).
Results
Participants
Of the 9,605 residents who completed the BC OSA Residential Care Survey, a total of 8,657 residents who completed at least one item on the VR-12 (LTRC-C) in English, and RAI-MDS 2.0 data were also obtained, were included in this study (90%). Residents were, on average, 83 (SD = 11) years old and the majority were female (64.1; Table 3). Common health conditions included hypertension (49.1%) and dementia (46.2%). Most residents had mild to no cognitive impairment (59.5%), demonstrated moderate-to-high social engagement (72.5%), and did not report depression (57.3 %).
Table 3.
Resident Characteristics
| Characteristics | Mean (SD) | Median (interquartile range) | N | % |
|---|---|---|---|---|
| Age, yearsa | 82.41 (11.14) | 85 (76–90) | ||
| Sex | ||||
| Female | 5,082 | 64.1 | ||
| Male | 2,834 | 35.8 | ||
| Other | 7 | 0.1 | ||
| Health conditions | ||||
| Hypertensionb | 3,824 | 49.1 | ||
| Dementia (excluding Alzheimer’s Disease) | 3,663 | 46.2 | ||
| Arthritisb | 2,208 | 28.3 | ||
| Depression | 2,052 | 25.9 | ||
| Cerebrovascular accident | 1,704 | 21.5 | ||
| Diabetes | 1,841 | 23.2 | ||
| Cognitive performance scale (CPS)a | ||||
| Scores 0–2 (intact/mild impairment) | 4,714 | 59.5 | ||
| Scores 3 and 4 (moderate impairment) | 2,771 | 35.0 | ||
| Scores 5 and 6 (severe impairment) | 438 | 5.5 | ||
| Index of social engagement (ISE) scalea | ||||
| Scores 0–2 (low social engagement) | 2,176 | 27.5 | ||
| Scores 3–6 (moderate-high social engagement) | 5,747 | 72.5 | ||
| Depressive rating scale (DRS)a | ||||
| Score 0 | 4,543 | 57.3 | ||
| Scores 1 and 2 | 1,936 | 24.4 | ||
| Scores 3 + | 1,444 | 18.2 | ||
| Activities of daily living (ADLs) Long Forma | ||||
| Scores 0–4 (most independent) | 1,998 | 25.2 | ||
| Scores 5–9 (some supervision) | 1,440 | 18.2 | ||
| Scores 10–14 (limited assistance) | 1,251 | 15.8 | ||
| Scores 15–19 (extensive assistance) | 1,410 | 17.8 | ||
| Scores 20–28 (most dependent) | 1,824 | 23.0 | ||
Notes: Results based on the RAI-MDS 2.0 data (N = 7,923; not available = 734).
a N = 7,919 (missing = 4).
b N = 7,793 (missing = 130).
Item Distribution
Most resident respondents completed all 12 items of the VR-12 (LTRC-C; n = 5,166/8,657, 59.7%) with the remaining respondents contributing to a relatively small amount of missing data overall (7.1% missing item responses). The general health item was the most frequently completed (n = 8,376/8,657, 96.8%), with 65.6% of residents indicating that they are in good to very good health, and only 5.8% of residents indicating that their general health was poor (Figure 1). The two role-emotional domain items had the lowest percent complete: accomplished less due to emotional problems (n = 7,491/8,657, 86.5%) and emotional problems affected doing activities carefully as usual (n = 7,174/8,657, 82.9%), with most residents who responded indicating that emotional problems did not affect their ability to accomplish activities (59.8%) or their ability to do activities as carefully as usual (67.2%). Most of the residents indicated that their health limited their ability to participate in moderate activities (70.9%) or self-care tasks (59.5%) and half of the residents (52.3%) indicated that pain interfered with normal activities at least a little of the time or more (Figure 1).
Figure 1.
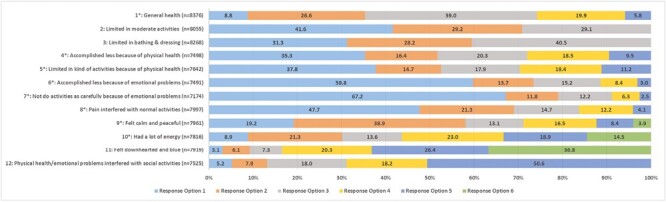
Relative frequency distribution of selected response options for each item (N = 8,657). Notes: For the VR-12 (LTRC-C), four items have response options ordered so that higher numbers represent better health status. The remaining eight items have response options with the reverse representation (i.e., higher numbered category = poorer health status). These items are marked with * in Figure 1. Item response options: *Item 1: 1 (excellent) to 5 (poor); Items 2–3: 1 (yes, limited a lot) to 3 (no, not limited at all); *Items 4–7: 1 (no, none of the time) to 5 (yes, all the time); *Item 8: 1 (not at all) to 5 (extremely); Items 9–11: 1 (all of the time) to 6 (none of the time); Item 12: 1 (all of the time) to 5 (none of the time).
Construct Validity
Factor structure
Model 1, which represents the original model for the SF-12 (Ware et al., 1996; all items contribute freely to both the physical component score and the mental component score latent factors [uncorrelated]), demonstrated the poorest fit with the observed data (χ2 = 4,232.73, df = 43, p < .001; RMSEA = 0.106; CFI = 0.95; see Table 4 for all models). Of the models supported in the literature, Model 3 and Model 5 demonstrated adequate fit with room for improvement (χ2 = 3,973.53, df = 49, p < .001; RMSEA = 0.10; CFI = 0.95; χ2 = 2,939.83, df = 46, p < .001; RMSEA = 0.09; CFI = 0.97, respectively). After examining fit indexes, standardized estimates, and the misfit of the bodily pain item in this study’s sample, the researchers modified Model 5, and a final CFA, Model 6 (with bodily pain cross-loaded on both latent factors), was examined. The subsequently modified model makes theoretical sense, as pain may be more common in this population (i.e., living with multiple chronic conditions that may be associated with pain), thus having a greater impact on residents’ social health as well as physical health. CFA values for the modified Model 6 indicate an acceptable to good fitting model (χ2 = 1958.52, df = 45, p < .001; RMSEA = 0.07; CFA = 0.98).
Table 4.
Goodness-of-Fit Indices of Models Tested for the VR-12 (LTRC-C) (N = 8,657)
| Fit index | Model | |||||
|---|---|---|---|---|---|---|
| 1 | 2 | 3 | 4 | 5 | 6 | |
| χ 2 test of model fit (df) | 4,232.730 (43)* | 6,607.133 (53)* | 3,973.525 (49)* | 3,411.576 (49)* | 2,939.826 (46)* | 1,958.523 (45)* |
| RMSEA | 0.106 | 0.120 | 0.096 | 0.089 | 0.085 | 0.070 |
| CFI | 0.950 | 0.921 | 0.953 | 0.960 | 0.965 | 0.977 |
Notes: CFI = comparative fit index; df = degrees of freedom; RMSEA = root-mean-square error of approximation; VR-12 (LTRC-C) = The Veterans RAND 12-item health survey (long-term residential care-Canada version); χ2 = Chi-square test of model fit.
* p < .001.
The standardized factor loadings (i.e., parameter estimates) for Model 6 ranged from 0.10 to 0.87 (Figure 2), with the physical functioning scale and the role-physical scale loading strongly on the physical health factor (0.70–0.87) and the role-emotional, mental health, and social functioning scales loading strongly onto the mental health factor (0.61–0.77; Figure 2). A moderate positive correlation was found between physical health and mental health latent factors (0.62). The general health and bodily pain scales showed weaker loadings on physical health (0.32 for both) and the vitality scale had a weak loading on mental health (0.27). Residual covariance results indicated that only two residual correlations were equal to or greater than 0.10: Item 10 (vitality scale) with Item 1 (general health scale; 0.11) and Item 9 (mental health scale; 0.12).
Figure 2.
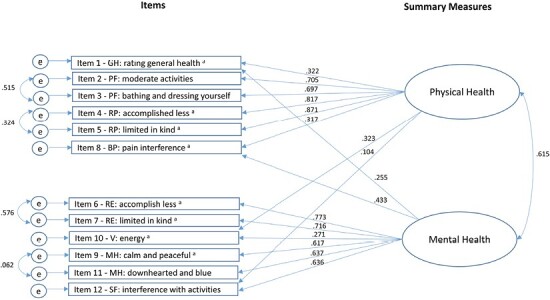
Standardized factor loading results for Model 6 of the VR-12 (LTRC-C). Notes: Confirmatory factor analysis results for Model 6 (final model): 2-factor model with correlated summary measures, cross-loadings for four items (GH = general health, BP = bodily pain, V = vitality, SF = social functioning) and four item residual correlations (PF = physical functioning, RP = role-physical, RE = role-emotional, MH = mental health). Positive factor loadings represent VR-12vLTRC items whereby higher scores indicate poorer health status. a = indicates reverse scored items; e = error. For all coefficients, p ≤ .001.
Convergent and discriminant validity
Results from correlation analyses (N = 7,923) were used to examine construct validity. Overall, the correlations were weak. The physical component score showed a moderate, negative correlation with the functional scale (r = −0.33, 95% CI: −0.31, −0.35), indicating that higher perceived physical health status was related to residents’ ability to complete ADLs. The physical component score was weakly correlated with depressive symptoms (measured using the depressive rating scale; r = −0.07, 95% CI: −0.09, −0.04) and social involvement (based on the ISE scale; r = 0.06, 95% CI: 0.04, 0.09). As expected, a relative improvement in mental health status, as indicated by a higher mental component score, was associated with fewer depressive symptoms based on the depressive rating scale (r = −0.11, 95% CI: −0.13, −0.09), though the magnitude of the correlation was small, albeit statistically significant. As expected, a negative correlation was obtained for the mental component score and the functional scale (r = −0.22, 95% CI: −0.24, −0.19), indicating that reduced mental health status was associated with increased dependence on activities for daily living. Additionally, the mental component score was weakly positively correlated with the social engagement scale (r = 0.10, 95% CI: 0.08, 0.12), which is consistent with the expectation that increased mental health would be associated with increased social engagement.
Reliability
The Cronbach’s α for the VR-12 (LTRC-C) was calculated, based on Model 6, and demonstrated acceptable internal consistency reliability for all six items loading onto the physical component score (α = 0.81) and all six items loading onto the mental component score (α = 0.75).
Discussion and Implications
This was a large validation study of the adapted VR-12 (LTRC-C) among adults living in Canadian LTRC homes. This study aimed to examine the construct validity of the generic PRO measure among adults living in LTRC homes, with findings supporting the construct validity of the VR-12 (LTRC-C) in the LTRC setting. Specifically, the CFA results for the VR-12 (LTRC-C) demonstrated acceptable model fit (i.e., measurement structure) for the two-factor model with (a) correlated latent factors, (b) forced zero loadings, (c) cross-loadings of general health, bodily pain, vitality, and social functioning, and (d) scale item correlations (Model 6). The additional constraint of cross-loading bodily pain to the previously examined Model 5 (Okonkwo et al., 2010) contributed to a better fitting model among LTRC residents than other models previously reported in the literature (Chum et al., 2016; Okonkwo et al., 2010; Ware et al., 1996). This finding supports a grounded conceptual basis for the social activity being a regular part of daily life in LTRC and is likely considered when responding to the pain item (“… how much did pain interfere with your normal activities”). Moreover, pain is likely to influence participation in social activities, which is also part of the mental health domain. Acceptable internal consistency reliability (α = 0.75), anticipated correlations between the physical component score scale and the functional scale (i.e., convergent validity), and weaker correlations between the physical component score scale and the depressive symptom and social engagement scales (discriminant validity) provided additional validation evidence for the VR-12 (LTRC-C).
The results of our psychometric analysis of a two-factor model provide support for the construct validity of the adapted VR-12 (LTRC-C) as a generic measure of physical and mental health status among adults living in the LTRC setting. However, since a few modifications to the original two-factor model were required to achieve an acceptable fit, the resulting scores of the VR-12 (LTRC-C) may not be directly comparable to those of the original VR-12. Further research is, therefore, recommended to develop scoring algorithms that will allow for comparisons of VR-12 (LTRC-C) scores with VR-12 scores obtained in other populations. Additionally, although the pattern of correlations among the physical and mental health latent factors with clinical measures of ADLs, social engagement, and depression was consistent with our expectations, the magnitudes of the correlations were quite small. This finding is not surprising, considering that the clinician-reported measures do not assess the full scope of physical and mental health status, whereas the VR-12 (LTRC-C) is a PRO measure that includes aspects of self-perceived physical and mental health that are not part of the clinical measures. The Cronbach’s alpha estimates provide evidence of internal consistency reliability. Together, these findings provide initial psychometric validity evidence of the adapted VR-12 (LTRC-C) as a brief generic tool to assess health status (physical and mental health) of residents living in the LTRC setting. However, test–retest reliability was not examined. Further research examining test–retest reliability and convergent and discriminant validity is therefore recommended (Park et al., 2018). Additionally, future work can consider item response theory to build bridges across assessments with the original VR-12 and the VR-12 (LTRC-C).
Limitations
Limitations of this study include the one-time administration of the VR-12 (LTRC-C), precluding the examination of other psychometric properties of the scale (e.g., test–retest reliability or sensitivity to change). Although Cronbach’s ordinal α results for the VR-12 (LTRC-C) were acceptable (>0.70), these values alone may not be enough to establish internal consistency reliability, thus future studies may be needed. Another limitation of this study relates to the representativeness of the data available from the OSA’s Resident Care Survey. Although all residents in publicly funded beds in the province were invited to complete the survey, not all consented to participate. Also, most respondents who completed the VR-12 (LTRC-C) also had cognitive status scores that indicated they were cognitively intact or had mild cognitive impairment, as such the respondent population was not representative of the total population of residents living in all care homes in the province. Thus, given the response rate and uniqueness of this population, findings may not be representative and may not apply to those living with greater cognitive impairment, including older adults living in the LTRC setting. Further validation research on the adapted VR-12 (LTRC-C) is recommended, including research to examine the possibility of different measurement models and to evaluate how residents with different levels of cognitive function respond to items on the VR-12 (LTRC-C). An additional limitation is that the VR-12 (LTRC-C) physical and mental component summary scales cannot be directly compared with those based on the original VR-12. Further research is recommended to develop algorithms that map VR-VR-12 (LTRC-C) scores onto those of the original VR-12. A final limitation and area for further research is in the development of norms that can be used to standardize the physical and mental summary scale scores and allow for comparisons with other populations. Given the purposes of a generic PRO measure, we recommend the norms should be based on a representative general (Canadian) elderly population.
Conclusion
The perceived physical and mental health status of adults living in the LTRC setting is not well documented, in part, because of the limited availability of appropriate and relevant PRO measures that can be used to assess health status in this population. Having access to a brief, generic PRO measure that has been developed and evaluated among residents living in LTRC homes will help to inform research and quality improvement initiatives to enhance physical and mental health status and, ultimately, the quality of life of this population.
Acknowledgments
We wish to thank the province of British Columbia’s (BC’s) Seniors Advocate, Isobel Mackenzie, for her vision for commissioning a survey of all older adults living in publicly funded long-term residential care (LTRC) homes to assess the quality of their experiences and their health-related quality of life. Isobel Mackenzie’s Office funded the provincially coordinated survey and the BC Office of Patient-Centred Measurement planned and implemented the 2016/17 BC Residential Care Survey. We are grateful for their support for this study. The authors also gratefully acknowledge the LTRC residents for participating in the survey interviews, the LTRC staff who assisted during the survey roll-out, and the trained interviewers who administered the survey.
Contributor Information
Rozanne Wilson, School of Nursing, Trinity Western University, Langley, British Columbia, Canada; Centre for Health Evaluation and Outcome Sciences, Providence Health Care Research Institute, Vancouver, British Columbia, Canada.
Lena Cuthbertson, British Columbia Office of Patient-Centred Measurement, British Columbia Ministry of Health, Vancouver, British Columbia, Canada.
Ayumi Sasaki, Centre for Health Evaluation and Outcome Sciences, Providence Health Care Research Institute, Vancouver, British Columbia, Canada.
Lara Russell, School of Nursing, Trinity Western University, Langley, British Columbia, Canada; Centre for Health Evaluation and Outcome Sciences, Providence Health Care Research Institute, Vancouver, British Columbia, Canada.
Lewis E Kazis, Boston University School of Public Health, Department of Health Law, Policy & Management, Boston, Massachusetts, USA; Department of Pulmonary Medicine and Rehabilitation, Harvard Medical School, Boston, Massachusetts, USA.
Richard Sawatzky, School of Nursing, Trinity Western University, Langley, British Columbia, Canada; Centre for Health Evaluation and Outcome Sciences, Providence Health Care Research Institute, Vancouver, British Columbia, Canada.
Funding
This research was jointly supported by the Canadian Frailty Network (known previously as Technology Evaluation in the Elderly Network, TVN), which is supported by the Government of Canada through the Networks of Centres of Excellence program, and by the British Columbia Office of Patient-Centred Measurement (2016 Interdisciplinary Fellowship awarded to Rozanne Wilson, PhD, under the supervision of Richard Sawatzky, PhD). This research was undertaken, in part, thanks to funding from the Canada Research Chairs program in support of Richard Sawatzky’s Canada Research Chair in Person-Centred Outcomes at Trinity Western University.
Conflict of Interest
None declared.
Data Availability
The data used for these analyses are managed by Population Data BC. Requests to access the data can be made via the data application request system available at www.popdata.bc.ca. This study was not preregistered. VR-12 and VR-36 are copyright by the Trustees of Boston University.
References
- Achterberg, W., Pot, A. M., Kerkstra, A., Ooms, M., Muller, M., & Ribbe, M. (2003). The effect of depression on social engagement in newly admitted Dutch nursing home residents. Gerontologist, 43(2), 213–218. doi: 10.1093/geront/43.2.213 [DOI] [PubMed] [Google Scholar]
- Almomani, F. M., McDowd, J. M., Bani-Issa, W., & Almomani, M. (2014). Health-related quality of life and physical, mental, and cognitive disabilities among nursing home residents in Jordan. Quality of Life Research, 23(1), 155–165. doi: 10.1007/s11136-013-0461-2 [DOI] [PubMed] [Google Scholar]
- Anagnostopoulos, F., Niakas, D., & Tountas, Y. (2009). Comparison between exploratory factor-analytic and SEM-based approaches to constructing SF-36 summary scores. Quality of Life Research, 18(1), 53–63. doi: 10.1007/S11136-008-9423-5 [DOI] [PubMed] [Google Scholar]
- Bartsch, L. J., Butterworth, P., Byles, J. E., Mitchell, P., Shaw, J., & Anstey, K. J. (2011). Examining the SF-36 in an older population: Analysis of data and presentation of Australian adult reference scores from the Dynamic Analyses to Optimise Ageing (DYNOPTA) project. Quality of Life Research, 20(8), 1227–1236. doi: 10.1007/s11136-011-9864-0 [DOI] [PubMed] [Google Scholar]
- Brown, T. A. (2006). Confirmatory factor analysis for applied research. Guilford Press. [Google Scholar]
- Bryan, S., Davis, J., Broesch, J., Doyle-Waters, M. M., Lewis, S., McGrail, K., McGregor, M. J., Murphy, J. M., & Sawatzky, R. (2014). Choosing your partner for the PROM: A review of evidence on patient-reported outcome measures for use in primary and community care. Healthcare Policy [Politiques de sante], 10(2), 38–51. [PMC free article] [PubMed] [Google Scholar]
- Burrows, A. B., Morris, J. N., Simon, S. E., Hirdes, J. P., & Phillips, C. (2000). Development of a minimum data set-based depression rating scale for use in nursing homes. Age and Ageing, 29(2), 165–172. doi: 10.1093/ageing/29.2.165. http://www.ncbi.nlm.nih.gov/pubmed/10791452 [DOI] [PubMed] [Google Scholar]
- Byrne, B. M. (2012). Structural equation modeling with Mplus: Basic concepts, applications, and programming. Taylor & Francis Group. [Google Scholar]
- Chum, A., Skosireva, A., Tobon, J., & Hwang, S. (2016). Construct validity of the SF-12v2 for the homeless population with mental illness: An instrument to measure self-reported mental and physical health. PLoS One, 11(3), e0148856. doi: 10.1371/journal.pone.0148856 [DOI] [PMC free article] [PubMed] [Google Scholar]
- Drageset, J., Natvig, G. K., Eide, G. E., Bondevik, M., Nortvedt, M. W., & Nygaard, H. A. (2009). Health-related quality of life among old residents of nursing homes in Norway. International Journal of Nursing Practice, 15(5), 455–466. doi: 10.1111/j.1440-172x.2009.01794.x [DOI] [Google Scholar]
- Drageset, J., Natvig, G. K., Eide, G. E., Clipp, E. C., Bondevik, M., Nortvedt, M. W., & Nygaard, H. A. (2008). Differences in health-related quality of life between older nursing home residents without cognitive impairment and the general population of Norway. Journal of Clinical Nursing, 17(9), 1227–1236. doi: 10.1111/j.1365-2702.2007.02132.x [DOI] [PubMed] [Google Scholar]
- Enders, C. K. (2013). Analyzing structural equation models with missing data. In Hancock G. R. & Mueller R. O. (Eds.), Structural equation modeling: A second course (2nd ed., pp. 439–520). Information Age Publishing. [Google Scholar]
- Fleishman, J. A., & Lawrence, W. F. (2003). Demographic variation in SF-12 scores: True differences or differential item functioning? Medical Care, 41(Suppl), III-75–III-86. doi: 10.1097/00005650-200307007-00009 [DOI] [PubMed] [Google Scholar]
- Fleishman, J. A., Selim, A. J., & Kazis, L. E. (2010). Deriving SF-12v2 physical and mental health summary scores: A comparison of different scoring algorithms. Quality of Life Research, 19(2), 231–241. doi: 10.1007/S11136-009-9582-Z [DOI] [PubMed] [Google Scholar]
- Forero, C. G., Vilagut, G., Adroher, N. D., Alonso, J., & ESEMeD/MHEDEA Investigators (2013). Multidimensional item response theory models yielded good fit and reliable scores for the Short Form-12 questionnaire. Journal of Clinical Epidemiology, 66(7), 790–801. doi: 10.1016/j.jclinepi.2013.02.007 [DOI] [PubMed] [Google Scholar]
- Gandek, B., Sinclair, S. J., Kosinski, M., & Ware, J. E., Jr. (2004). Psychometric evaluation of the SF-36 health survey in Medicare managed care. Health Care Financing Review, 25(4), 5–25. [PMC free article] [PubMed] [Google Scholar]
- Hann, M., & Reeves, D. (2008). The SF-36 scales are not accurately summarised by independent physical and mental component scores. Quality of Life Research, 17(3), 413–423. doi: 10.1007/s11136-008-9310-0 [DOI] [PubMed] [Google Scholar]
- Hayes, V., Morris, J., Wolfe, C., & Morgan, M. (1995). The SF-36 Health Survey Questionnaire: Is it suitable for use with older adults? Age and Ageing, 24(2), 120–125. doi: 10.1093/ageing/24.2.120 [DOI] [PubMed] [Google Scholar]
- Haywood, K. L., Garratt, A. M., & Fitzpatrick, R. (2005). Quality of life in older people: A structured review of generic self-assessed health instruments. Quality of Life Research, 14(7), 1651–1668. doi: 10.1007/s11136-005-1743-0 [DOI] [PubMed] [Google Scholar]
- Hickey, A., Barker, M., McGee, H., & O’Boyle, C. (2005). Measuring health-related quality of life in older patient populations: A review of current approaches. PharmacoEconomics, 23(10), 971–993. doi: 10.2165/00019053-200523100-00002 [DOI] [PubMed] [Google Scholar]
- Hirdes, J. P., Ljunggren, G., Morris, J. N., Frijters, D. H., Finne Soveri, H., Gray, L., & Gilgen, R. (2008). Reliability of the interRAI suite of assessment instruments: A 12-country study of an integrated health information system. BMC Health Services Research, 8(1), 1–11. doi: 10.1186/1472-6963-8-277 [DOI] [PMC free article] [PubMed] [Google Scholar]
- Hirdes, J. P., Poss, J. W., Caldarelli, H., Fries, B. E., Morris, J. N., Teare, G. F., Reidel, K., & Jutan, N. (2013). An evaluation of data quality in Canada’s continuing care reporting system (CCRS): Secondary analyses of Ontario data submitted between 1996 and 2011. BMC Medical Informatics and Decision Making, 13, 27. doi: 10.1186/1472-6947-13-27 [DOI] [PMC free article] [PubMed] [Google Scholar]
- Housen, P., Shannon, G. R., Simon, B., Edelen, M. O., Cadogan, M. P., Sohn, L., & Saliba, D. (2008). What the resident meant to say: Use of cognitive interviewing techniques to develop questionnaires for nursing home residents. Gerontologist, 48(2), 158–169. doi: 10.1093/geront/48.2.158 [DOI] [PubMed] [Google Scholar]
- Hu, L., & Bentler, P. M. (1999). Cutoff criteria for fit indexes in covariance structure analysis: Conventional criteria versus new alternatives. Structural Equation Modeling: A Multidisciplinary Journal, 6(1), 1–55. doi: 10.1080/10705519909540118 [DOI] [Google Scholar]
- Hutchinson, A. M., Milke, D. L., Maisey, S., Johnson, C., Squires, J. E., Teare, G., & Estabrooks, C. A. (2010). The resident assessment instrument-minimum data set 2.0 quality indicators: A systematic review. BMC Health Services Research, 10(1), 166. doi: 10.1186/1472-6963-10-166 [DOI] [PMC free article] [PubMed] [Google Scholar]
- Jones, D., Kazis, L., Lee, A., Rogers, W., Skinner, K., Cassar, L., Wilson, N., & Hendricks, A. (2001). Health status assessments using the Veterans SF-12 and SF-36: methods for evaluating otucomes in the Veterans Health Administration. The Journal of Ambulatory Care Management, 24(3), 68–86. doi: 10.1097/00004479-200107000-00011 [DOI] [PubMed] [Google Scholar]
- Kazis, L. E. (2000). The veterans SF-36 health status questionnaire: Development and application in the Veterans Health Administration. Medical Outcomes Trust Monitor, 5(1), 1–14. [Google Scholar]
- Kazis, L. E., Miller, D. R., Clark, J., Skinner, K., Lee, A., Rogers, W., Spiro, A., 3rd, Payne, S., Fincke, G., Selim, A., & Linzer, M. (1998). Health-related quality of life in patients served by the Department of Veterans Affairs: Results from the Veterans Health Study. Archives of Internal Medicine, 158(6), 626–632. doi: 10.1001/archinte.158.6.626 [DOI] [PubMed] [Google Scholar]
- Kazis, L. E., Ren, X. S., Lee, A., Skinner, K., Rogers, W., Clark, J., & Miller, D. R. (1999). Health status in VA patients: Results from the Veterans Health Study. American Journal of Medical Quality, 14(1), 28–38. doi: 10.1177/106286069901400105 [DOI] [PubMed] [Google Scholar]
- Kazis, L. E., Lee, A., Spiro, A., 3rd, Rogers, W. H., Ren, X. S., Miller, D. R., Selim, A., Hamed, A., & Haffer, S. C. (2004). Measurement comparisons of the medical outcomes study and veterans SF-36 health survey. Health Care Financing Review, 25(4), 43–58. [PMC free article] [PubMed] [Google Scholar]
- Kazis, L. E., Miller, D. R., Clark, J. A., Skinner, K. M., Lee, A., Ren, X. S., Spiro, A., 3rd, Rogers, W. H., & Ware, J. E., Jr. (2004). Improving the response choices on the veterans SF-36 health survey role functioning scales: Results from the Veterans Health Study. Journal of Ambulatory Care Management, 27(3), 263–280. doi: 10.1097/00004479-200407000-00010. [DOI] [PubMed] [Google Scholar]
- Kazis, L. E., Miller, D. R., Skinner, K. M., Lee, A., Ren, X. S., Clark, J. A., Rogers, W. H., Sprio, A., III, Selim, A., Linzer, M., Payne, S. M., Mansell, D., & Fincke, B. G. (2006). Applications of methodologies of the Veterans Health Study in the VA healthcare system: conclusions and summary. The Journal of Ambulatory Care Management, 29(2), 182–188. doi: 10.1097/00004479-200604000-00011 [DOI] [PubMed] [Google Scholar]
- Kazis, L. E., Selim, A. J., Rogers, W., Qian, S. X., & Brazier, J. (2012). Monitoring outcomes for the Medicare advantage program. Journal of Ambulatory Care Management, 35(4), 263–276. doi: 10.1097/jac.0b013e318267468f [DOI] [PubMed] [Google Scholar]
- Keller, S. D., Ware, J. E., Bentler, P. M., Aaronson, N. K., Alonso, J., Apolone, G., Bjorner, J. B., Brazier, J., Bullinger, M., Kaasa, S., Leplège, A., Sullivan, M., & Gandek, B. (1998). Use of structural equation modeling to test the construct validity of the SF-36 Health Survey in ten countries: Results from the IQOLA project. Journal of Clinical Epidemiology, 51(11), 1179–1188. doi: 10.1016/s0895-4356(98)00110-3 [DOI] [PubMed] [Google Scholar]
- Marsh, H. W., Hau, K. -T., & Wen, Z. (2004). In search of golden rules: Comment on hypothesis-testing approaches to setting cutoff values for fit indexes and dangers in overgeneralizing Hu and Bentler’s (1999) findings. Structural Equation Modeling: A Multidisciplinary Journal, 11(3), 320–341. doi: 10.1207/s15328007sem1103_2 [DOI] [Google Scholar]
- Maurischat, C., Ehlebracht-König, I., Kühn, A., & Bullinger, M. (2005). Factorial validity and norm data comparison of the Short Form 12 in patients with inflammatory-rheumatic disease. Rheumatology International, 26(7), 614–621. doi: 10.1007/S00296-005-0046-7 [DOI] [PubMed] [Google Scholar]
- Maurischat, C., Herschbach, P., Peters, A., & Bullinger, M. (2008). Factorial validity of the Short Form 12 (SF-12) in patients with diabetes mellitus. Psychology Science, 50, 7–20. [Google Scholar]
- McKenna, S. P. (2011). Measuring patient-reported outcomes: Moving beyond misplaced common sense to hard science. BMC Medicine, 9(1), 86. doi: 10.1186/1741-7015-9-86 [DOI] [PMC free article] [PubMed] [Google Scholar]
- Mor, V., Branco, K., Fleishman, J., Hawes, C., Phillips, C., Morris, J., & Fries, B. (1995). The structure of social engagement among nursing home residents. Journals of Gerontology, Series B: Psychological Sciences and Social Sciences, 50B(1), P1–P8. doi: 10.1093/geronb/50b.1.p1 [DOI] [PubMed] [Google Scholar]
- Morris, J. N., Fries, B. E., Mehr, D. R., Hawes, C., Phillips, C., Mor, V., & Lipsitz, L. A. (1994). MDS cognitive performance scale. Journal of Gerontology, 49(4), M174–M182. doi: 10.1093/geronj/49.4.m174 [DOI] [PubMed] [Google Scholar]
- Morris, J. N., Nonemaker, S., Murphy, K., Hawes, C., Fries, B. E., Mor, V., & Phillips, C. (1997). A commitment to change: Revision of HCFA’s RAI. Journal of the American Geriatrics Society, 45(8), 1011–1016. doi:j.1532-5415.1997.tb02974.x [DOI] [PubMed] [Google Scholar]
- Morris, J. N., Fries, B. E., & Morris, S. A. (1999). Scaling ADLs within the MDS. Journals of Gerontology, Series A: Biological Sciences and Medical Sciences, 54(11), M546–M553. doi: 10.1093/gerona/54.11.m546 [DOI] [PubMed] [Google Scholar]
- Mukaka, M. M. (2012). Statistics corner: A guide to appropriate use of correlation coefficient in medical research. Malawi Medical Journal, 24 (3), 69–71. [PMC free article] [PubMed] [Google Scholar]
- Muthén, L. K., & Muthén, B. O. (1998–2015). Mplus User’s Guide. 7th edn. Los Angeles, CA: Muthén & Muthén. [Google Scholar]
- Okonkwo, O. C., Roth, D. L., Pulley, L., & Howard, G. (2010). Confirmatory factor analysis of the validity of the SF-12 for persons with and without a history of stroke. Quality of Life Research, 19(9), 1323–1331. doi: 10.1007/s11136-010-9691-8 [DOI] [PMC free article] [PubMed] [Google Scholar]
- Park, M. S., Kang, K. J., Jang, S. J., Lee, J. Y., & Chang, S. J. (2018). Evaluating test-retest reliability in patient-reported outcome measures for older people: A systematic review. International Journal of Nursing Studies, 79, 58–69. doi: 10.1016/j.ijnurstu.2017.11.003 [DOI] [PubMed] [Google Scholar]
- Parker, S. G., Peet, S. M., Jagger, C., Farhan, M., & Castleden, C. M. (1998). Measuring health status in older patients. The SF-36 in practice. Age and Ageing, 27(1), 13–18. doi: 10.1093/ageing/27.1.13 [DOI] [PubMed] [Google Scholar]
- Patrick, D. L., Burke, L. B., Gwaltney, C. J., Leidy, N. K., Martin, M. L., Molsen, E., & Ring, L. (2011). Content validity—Establishing and reporting the evidence in newly developed patient-reported outcomes (PRO) instruments for medical product evaluation: ISPOR PRO good research practices task force report: Part 1—Eliciting concepts for a new PRO instrument. Value in Health, 14(8), 967–977. doi: 10.1016/j.jval.2011.06.014 [DOI] [PubMed] [Google Scholar]
- Peek, M. K., Ray, L., Patel, K., Stoebner-May, D., & Ottenbacher, K. J. (2004). Reliability and validity of the SF-36 among older Mexican Americans. Gerontologist, 44(3), 418–425. doi: 10.1093/geront/44.3.418 [DOI] [PubMed] [Google Scholar]
- Poss, J. W., Jutan, N. M., Hirdes, J. P., Fries, B. E., Morris, J. N., Teare, G. F., & Reidel, K. (2008). A review of evidence on the reliability and validity of minimum data set data. Healthcare Management Forum, 21(1), 33–39. doi: 10.1016/S0840-4704(10)60127-5 [DOI] [PubMed] [Google Scholar]
- Powell Laivton, M., Casten, R., Parmelee, P. A., Van Haitsma, K., Corn, J., & Kleban, M. H. (1998). Psychometric characteristics of the minimum data set II: Validity. Journal of the American Geriatrics Society, 46(6), 736–744. doi: 10.1111/j.1532-5415.1998.tb03809.x [DOI] [PubMed] [Google Scholar]
- Pugh, M. J. V., Copeland, L. A., Zeber, J. E., Cramer, J. A., Amuan, M. E., Cavazos, J. E., & Kazis, L. E. (2005). The impact of epilepsy on health status among younger and older adults. Epilepsia, 46(11), 1820–1827. doi: 10.1111/j.1528-1167.2005.00291.x [DOI] [PubMed] [Google Scholar]
- Rebollo, P., Ortega, F., Baltar, J. M., Díaz-Corte, C., Navascués, R. A., Naves, M., Ureña, A., Badía, X., Alvarez-Ude, F., & Alvarez-Grande, J. (1998). Health-related quality of life (HRQOL) in end stage renal disease (ESRD) patients over 65 years. Geriatric Nephrology and Urology, 8(2), 85–94. doi: 10.1023/a:1008338802209 [DOI] [PubMed] [Google Scholar]
- Rothman, M., Burke, L., Erickson, P., Leidy, N. K., Patrick, D. L., & Petrie, C. D. (2009). Use of existing patient-reported outcome (PRO) instruments and their modification: The ISPOR good research practices for evaluating and documenting content validity for the use of existing instruments and their modification PRO task force report. Value in Health, 12(8), 1075–1083. doi: 10.1111/j.1524-4733.2009.00603.x [DOI] [PubMed] [Google Scholar]
- Schick-Makaroff, K., Karimi-Dehkordi, M., Cuthbertson, L., Dixon, D., Cohen, S. R., Hilliard, N., & Sawatzky, R. (2021). Using patient- and family-reported outcome and experience measures across transitions of care for frail older adults living at home: A meta-narrative synthesis. Gerontologist, 61(3), e23–e38. doi: 10.1093/geront/gnz162 [DOI] [PMC free article] [PubMed] [Google Scholar]
- Schlenk, E. A., Erlen, J. A., Dunbar-Jacob, J., McDowell, J., Engberg, S., Sereika, S. M., & Bernier, M. J. (1997). Health-related quality of life in chronic disorders: A comparison across studies using the MOS SF-36. Quality of Life Research, 7(1), 57–65. doi: 10.1023/A:1008836922089 [DOI] [PubMed] [Google Scholar]
- Schreiber, J. B., Nora, A., Stage, F. K., Barlow, E. A., & King, J. (2006). Reporting structural equation modeling and confirmatory factor analysis results: A review. Journal of Educational Research, 99(6), 323–338. doi: 10.3200/joer.99.6.323-338 [DOI] [Google Scholar]
- Selim, A. J., Qian, S. X., Rogers, W., Arya, D., Simmons, K., Shapiro, G. D., Sonis, L. A., & Kazis, L. E. (2019). Health status in adults with chronic conditions: Intervention strategies for improving patient-reported outcomes. Journal of Ambulatory Care Management, 42(1), 2–20. doi: 10.1097/JAC.0000000000000262 [DOI] [PubMed] [Google Scholar]
- Selim, A. J., Rogers, W., Fleishman, J. A., Qian, S. X., Fincke, B. G., Rothendler, J. A., & Kazis, L. E. (2009). Updated U.S. population standard for the Veterans RAND 12-item Health Survey (VR-12). Quality of Life Research, 18(1), 43–52. doi: 10.1007/s11136-008-9418-2 [DOI] [PubMed] [Google Scholar]
- Snyder, C. F., Watson, M. E., Jackson, J. D., Cella, D., Halyard, M. Y., & Sloan, J. A. (2007). Patient-reported outcome instrument selection: Designing a measurement strategy. In Value in Health (Vol. 10). Blackwell Publishing Inc. doi: 10.1111/j.1524-4733.2007.00270.x [DOI] [PubMed] [Google Scholar]
- Tabali, M., Ostermann, T., Jeschke, E., Dassen, T., & Heinze, C. (2015). The relationship between health-related quality of life and care dependency among nursing home residents in Germany: A longitudinal study. Journal of Gerontology & Geriatric Research, 04(05), 1–6. doi: 10.4172/2167-7182.1000239 [DOI] [Google Scholar]
- Tavakol, M., & Dennick, R. (2011). Making sense of Cronbach’s alpha. International Journal of Medical Education, 2, 53–55. doi: 10.5116/ijme.4dfb.8dfd [DOI] [PMC free article] [PubMed] [Google Scholar]
- von Renteln-Kruse, W., Krause, T., Dieckmann, P., & Vogel, J. (2006). Geriatric patients’ mobility status as reflected by the relevant items of the Barthel Index and in-hospital falls. Journal of the American Geriatrics Society, 54(6), 1012–1013. doi: 10.1111/j.1532-5415.2006.00755.x [DOI] [PubMed] [Google Scholar]
- Ware, J., Kosinski, M., & Keller, S. D. (1996). A 12-item short-form health survey: Construction of scales and preliminary tests of reliability and validity. Medical Care, 34(3), 220–233. doi: 10.1097/00005650-199603000-00003. Retrieved from http://www.ncbi.nlm.nih.gov/pubmed/8628042 [DOI] [PubMed] [Google Scholar]
- Ware, J. E., & Sherbourne, C. D. (1992). The MOS 36-item short-form health survey (SF-36). I. Conceptual framework and item selection. Medical Care, 30(6), 473–483. [PubMed] [Google Scholar]
- Weldring, T., & Smith, S. M. S. (2013). Article commentary: Patient-reported outcomes (PROs) and patient-reported outcome measures (PROMs). Health Services Insights. SAGE Publications Ltd. doi: 10.4137/HSI.S11093 [DOI] [PMC free article] [PubMed] [Google Scholar]
- Willis, G. B. (2015). Analysis of the cognitive interview in questionnaire design. Oxford University Press. [Google Scholar]
- Wilson, D., Tucker, G., & Chittleborough, C. (2002). Rethinking and rescoring the SF-12. Sozial- Und Präventivmedizin, 47(3), 172–177. doi: 10.1007/BF01591889 [DOI] [PubMed] [Google Scholar]
- Wilson, R., Cuthbertson, L., Kazis, L., & Sawatzky, R. (2022). Measuring health status in long-term residential care: Adapting the Veterans RAND 12 item health survey (VR-12©). Clinical Gerontologist, 45(3), 562–574. doi: 10.1080/07317115.2020.1752347 [DOI] [PubMed] [Google Scholar]
- Zumbo, B., Gadermann, A., & Zeisser, C. (2007). Ordinal versions of coefficients alpha and theta for Likert rating scales. Journal of Modern Applied Statistical Methods, 6(1), 4. doi: 10.22237/jmasm/1177992180 [DOI] [Google Scholar]
Associated Data
This section collects any data citations, data availability statements, or supplementary materials included in this article.
Data Availability Statement
The data used for these analyses are managed by Population Data BC. Requests to access the data can be made via the data application request system available at www.popdata.bc.ca. This study was not preregistered. VR-12 and VR-36 are copyright by the Trustees of Boston University.