Abstract
Objectives
The aim of this study was to compare image quality and endoleak detection after endovascular abdominal aortic aneurysm repair between a triphasic computed tomography (CT) with true noncontrast (TNC) and a biphasic CT with virtual noniodine (VNI) images on photon-counting detector CT (PCD-CT).
Materials and Methods
Adult patients after endovascular abdominal aortic aneurysm repair who received a triphasic examination (TNC, arterial, venous phase) on a PCD-CT between August 2021 and July 2022 were retrospectively included. Endoleak detection was evaluated by 2 blinded radiologists on 2 different readout sets (triphasic CT with TNC-arterial-venous vs biphasic CT with VNI-arterial-venous). Virtual noniodine images were reconstructed from the venous phase. The radiologic report with additional confirmation by an expert reader served as reference standard for endoleak presence. Sensitivity, specificity, and interreader agreement (Krippendorf α) were calculated. Image noise was assessed subjectively in patients using a 5-point scale and objectively calculating the noise power spectrum in a phantom.
Results
One hundred ten patients (7 women; age, 76 ± 8 years) with 41 endoleaks were included. Endoleak detection was comparable between both readout sets with a sensitivity and specificity of 0.95/0.84 (TNC) versus 0.95/0.86 (VNI) for reader 1 and 0.88/0.98 (TNC) versus 0.88/0.94 (VNI) for reader 2. Interreader agreement for endoleak detection was substantial (TNC: 0.716, VNI: 0.756). Subjective image noise was comparable between TNC and VNI (4; IQR [4, 5] vs 4; IQR [4, 5], P = 0.44). In the phantom, noise power spectrum peak spatial frequency was similar between TNC and VNI (both fpeak = 0.16 mm−1). Objective image noise was higher in TNC (12.7 HU) as compared with VNI (11.5 HU).
Conclusions
Endoleak detection and image quality were comparable using VNI images in biphasic CT as compared with TNC images in triphasic CT offering the possibility to reduce scan phases and radiation exposure.
Key Words: photon-counting CT, aorta, aneurysm, endoleak, virtual noniodine images
Endoleak is the most common complication after endovascular aortic aneurysm repair (EVAR) and prevalent in approximately 25%–50% of patients.1–3 Endoleaks are associated with an increased aneurysm rupture rate and a reduced viability and patency of the endograft itself.4 Therefore, in patients treated with EVAR, life-long follow-up imaging, usually with multiphasic computed tomography (CT) angiography, is necessary.5,6 The typical CT protocol consists of a true noncontrast (TNC) phase, an arterial phase, and a venous phase.5 A TNC phase is necessary to establish a baseline density within the aneurysm sac and to detect intra-aneurysmatic calcifications, which can mimic contrast medium in arterial and venous phases. Both arterial and venous phases are commonly performed due to differences in flow rates of endoleaks and in perfusion of parenchymal organs.7 Imaging is usually performed 1, 6, and 12 months after the intervention and yearly thereafter.8 Computed tomography follow-up imaging carries a significant amount of ionizing radiation over time, and due to the concern about radiation dose accumulation, it is desirable to eliminate phases from the triphasic CT angiography protocol.9–11
The reconstruction of virtual noncontrast (VNC) images from dual-energy CT has been investigated as an option to reduce the number of acquisition phases in multiphasic CT,12–16 consequently reducing radiation dose to the patient. These images are based on decomposition algorithms that use water and iodine as base materials.17 Some disadvantages of VNC as compared with TNC in dual-energy CT are excessive smoothing of the image,14 increased image noise in obese patients,18 incomplete elimination of the contrast media, or erroneous calcium subtraction.14,19,20
Recently, the first dual-source photon-counting detector CT (PCD-CT) became available for clinical use.21–25 With the introduction of PCD-CT, a novel reconstruction algorithm called virtual noniodine (VNI) images, which is based on a decomposition of iodine and calcium as base materials, became clinically available. Based on an additional decomposition into iodine and calcium, this reconstruction provides iodine contrast removal while at the same time avoiding a reduction in calcium contrast, which is the case in traditional VNC images.26–28 This offers the potential to improve contrast removal in vascular imaging compared with traditional VNC images, which are better suited for quantitative measurement of CT attenuation in organs.28–32 Decker et al28 demonstrated the superiority of VNI over VNC in patients after EVAR and concluded that VNI can serve as a substitute for TNC in terms of image quality. However, endoleak detection analysis was not performed in this study.
Therefore, the aim of this study was to compare image quality and diagnostic accuracy for endoleak detection after endovascular abdominal aortic aneurysm repair between a triphasic CT with TNC and a biphasic CT with VNI images acquired on PCD-CT.
MATERIALS AND METHODS
Patient Part
Patient Cohort
This retrospective study was performed at an academic medical center and approved by the institutional review board and the local ethics committee. Written informed consent was obtained from all patients. Consecutive adult patients who received a triphasic thoracoabdominal CT examination (TNC, arterial, venous phase) on a first-generation dual-source PCD-CT (NAEOTOM Alpha, Syngo CT VA50; Siemens Healthcare GmbH, Forchheim, Germany) between August 2021 and July 2022 were retrospectively searched. Only patients with an infrarenal abdominal aortic aneurysm and EVAR who underwent to a triphasic CT were included. Exclusion criteria were missing raw data to reconstruct VNI and abdominal aortic graft prosthesis.
One hundred fifty-six patients underwent a triphasic CTA of the aorta on PCD-CT between August 2021 and July 2022. Of these, 46 patients were excluded (Fig. 1). The final study cohort consisted of 110 patients. Patient characteristics and CT radiation dose are summarized in Table 1. Of these, the majority were male (n = 103; 94%), the average age was 76 ± 8 years, and the mean body mass index was 27 ± 4 kg/m2. Most patients had arterial hypertension (n = 97; 88%) and/or were smokers (n = 74; 67%).
FIGURE 1.
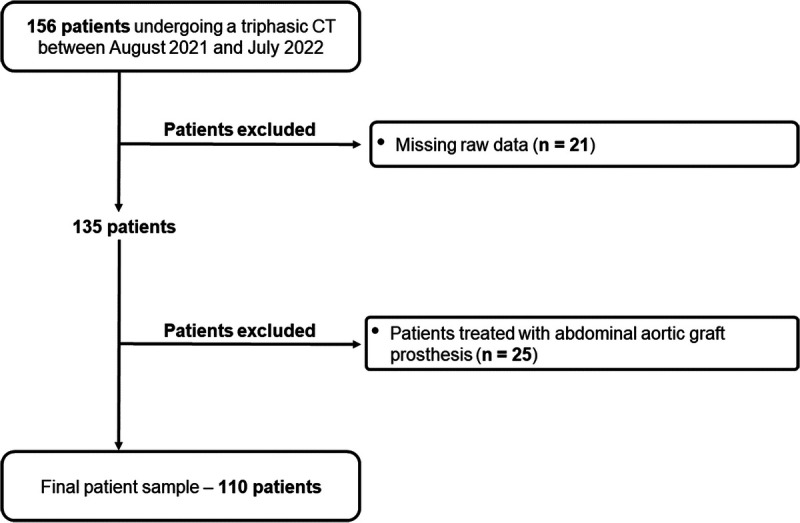
Flowchart shows patient inclusion.
TABLE 1.
Patient Demographics and CT Radiation Dose
| Characteristic | All Patients (n = 110) |
|---|---|
| Sex | |
| Women | 7 |
| Male | 103 |
| Age, y | 76 ± 8 |
| Body weight, kg | 83 ± 15 |
| Body mass index, kg/m2 | 27 ± 4 |
| Indications for imaging | Follow-up after EVAR (n = 110) |
| Months between EVAR and CT scan | 54 ± 47 |
| Medical history | |
| Hypertension | 97 |
| Diabetes | |
| Type 1 | 0 |
| Type 2 | 18 |
| Renal insufficiency | 21 |
| Hyperlipidemia | 55 |
| Peripheral arterial occlusive disease | 27 |
| Nicotine abuse | 74 |
| Treated aneurysm diameter | |
| Maximum diameter, mm | 55 ± 16 |
| Endoleaks | 41 |
| CT radiation dose | |
| True noncontrast phase | CTDIvol: 5.1 ± 1.5 mGy; DLP: 353.3 ± 108.1 mGy·cm |
| Arterial phase | CTDIvol: 3.74 ± 1.4 mGy; DLP: 258.9 ± 88.8 mGy·cm |
| Venous phase | CTDIvol: 4.65 ± 1.4 mGy; DLP: 320 ± 100 mGy·cm |
| Total per patient | CTDIvol: 13.5 ± 3.9 mGy; DLP: 932.2 ± 286 mGy·cm |
Data are mean ± standard deviation.
N, number of patients; EVAR, endovascular aortic aneurysm repair; CTDIvol, volume CT dose index; DLP, dose length product.
Scan Protocol
All patients were imaged on a first-generation dual-source PCD-CT equipped with 2 cadmium telluride PCDs. All scans were obtained in the multienergy mode (QuantumPlus) at 120 kV with a collimation of 144 × 0.4 mm, an image quality level of 68 using automated tube current modulation (CARE Dose4D; Siemens Healthcare), a gantry rotation time of 0.25 seconds, and a spiral pitch factor of 1.2. Contrast-enhanced phases were acquired after an injection of 70 mL of contrast material (370 mg I/mL, iopromide [Ultravist; Bayer Healthcare]), starting with a 40-mL bolus followed by a 60-mL 1:1 mixture of contrast material and saline solution, and followed by a saline chaser of 20 mL. The flow rate was 4 mL/s. Bolus tracking was used in the ascending aorta with a threshold of 140 HU at 90 kV. The arterial phase was acquired 12 seconds and the venous phase 70 seconds after reaching this threshold. Dose length product (DLP) and volume CT dose index (CTDIvol) were noted from the dose reports.
Image Reconstruction
All data sets were reconstructed in the axial plane using a quantum iterative reconstruction algorithm at a strength level of 4.33 The slice thickness was 2 mm, and the increment was 1.6 mm. True noncontrast images were reconstructed as virtual monoenergetic images at 70 keV using a soft tissue reconstruction kernel (Br36). Virtual noniodine images at 70 keV (PureCalcium; Siemens) were reconstructed from the venous phase using a quantitative kernel (Qr36). Virtual monoenergetic images at 55 keV and 60 keV were used for the arterial and venous phases, respectively.
Endoleak Detection
The radiologic report with additional confirmation by an expert reader (A.E., board-certified radiologist with 11 years of experience in cardiothoracic imaging) served as the reference standard for the presence of an endoleak in all patients. Two readout sets were created from the same patients. Set A consisted of the TNC, arterial, and venous scans, and set B consisted of the VNI, arterial, and venous scans. Both sets were independently assessed for the presence of an endoleak by 2 radiologists (M.P., subspecialized radiologist with 10 years of experience and D.N., radiologist in training with 5 years of experience). The order of the readout sets was randomized, and the readers were blinded to the presence or absence of endoleaks, as well as the reconstruction parameters.
Assessment of Subjective Image Quality
Subjective image quality (image noise, overall image quality, and artifacts) of TNC and VNI images was evaluated by the subspecialized radiologist. Image noise was assessed using a 5-point visual scale with 5, excellent image quality; 4, good image quality; 3, moderate image quality; 2, poor image quality; and 1, nondiagnostic. Overall quality was evaluated using a 5-point visual scale as well, whereby 5 indicates excellent image quality; 4, good image quality; 3, moderate image quality but sufficient for diagnosis; 2, poor image quality (diagnostic confidence substantially reduced); and 1, nondiagnostic. All images were assessed for the presence of artifacts (yes/no) that are not related to the reconstruction algorithm (eg, artifacts due to metal implants).
Assessment of Calcification Subtraction
In a third readout, 1 radiologist (A.M.T.G., radiologist in training with 2 years of experience) determined the presence of wall and luminal calcifications in the aneurysm in the TNC images of all patients. Afterward, the expert reader judged if these calcifications were subtracted in the VNI images. If calcifications were subtracted, they were classified as either intraluminal or in the wall of the aneurysm. In a third step, the expert reader assessed if these subtracted calcifications changed the diagnosis of endoleak using all 3 phases.
Phantom Part—Assessment of Noise Characteristics
The aim of this part of the study was to compare image noise between TNC and VNI images objectively. The noise power spectrum (NPS) was used to assess image noise magnitude and the normalized NPS to assess image noise texture. A water-filled cylindrical container emulating an intermediate-sized patient (diameter, 30 cm) was imaged with the same CT protocol and reconstruction settings as used in patients. CTDIvol was 5 mGy. An open-source software (ImQuest Version 7; Duke University) was used to measure the NPS.34 Four different quadratic regions of interest with an area of approximately 12 cm2 were placed on 100 consecutive slices of the phantom. One-dimensional NPS profiles depicting the radial average of the 2-dimensional NPS profile were computed. The NPS was divided by the pixel variance to compute the normalized NPS.35 The average (fav) and peak spatial frequencies (fpeak) of the NPS curves were compared to assess image noise texture.
STATISTICAL ANALYSIS
Data distribution was checked visually by means of quantile-quantile plots, box plots, and histograms. Quantitative variables are presented as means ± SDs and/or median (interquartile range) depending on the data distribution (normal/nonnormal distribution). Categorical variables are expressed as counts and percentages. Diagnostic performance of endoleak detection (sensitivity and specificity) was computed for both readout sets using the radiologic report with additional confirmation by an expert reader as the reference standard. To check for differences in values from subjective image analysis, Wilcoxon signed rank test and χ2 test were computed. Interreader agreement was quantified with Krippendorff α coefficients (0.0–0.20 = poor agreement, 0.21–0.40 = fair agreement, 0.41–0.60 = moderate agreement, 0.61–0.80 = substantial agreement, and 0.81–1.00 = almost perfect agreement). Two-tailed P values <0.05 were considered statistically significant. All statistical analyses were performed in the R programming language (version 4.0.2).
RESULTS
Patient Part
Endoleak Detection
Endoleaks were present in 41 patients (37%). Endoleak detection was comparable between sets A and B. Reader 1 had a sensitivity of 0.95 versus 0.95 and a specificity of 0.84 versus 0.86 for endoleak detection using set A (TNC) and B (VNI), respectively. Reader 2 had a sensitivity of 0.88 versus 0.88 and a specificity of 0.98 versus 0.94 for endoleak detection using set A and B, respectively (Table 2). Interreader agreement for endoleak detection was substantial for both sets A and B (TNC: 0.716, VNI: 0.756). Figure 2 provides a representative image example.
TABLE 2.
Accuracy of Endoleak Detection With TNC and VNI Images
| Reader 1 | Reader 2 | |||
|---|---|---|---|---|
| Set A (TNC) | Set B (VNI) | Set A (TNC) | Set B (VNI) | |
| Sensitivity | 0.95 (CI, 0.89–1.0) | 0.95 (CI, 0.89–1.0) | 0.88 (CI, 0.78–0.98) | 0.88 (CI, 0.78–0.98) |
| Specificity | 0.84 (CI, 0.75–0.93) | 0.86 (CI, 0.77–0.94) | 0.98 (CI, 0.96–1.0) | 0.94 (CI, 0.89–0.1) |
TNC, true nonconstrast; VNI, virtual noniodine; CI, confidence interval.
FIGURE 2.
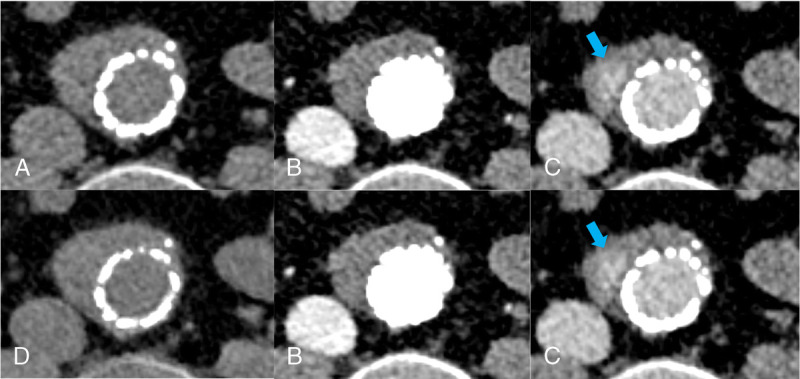
Axial CT images at the level of the aortic aneurysm acquired with photon-counting detector CT in a 60-year-old man referred for follow-up imaging after EVAR: (A) true noncontrast images, (B) arterial phase, (C) venous phase with an arrow pointing at the endoleak, and (D) virtual noniodine images reconstructed from venous phase images.
Subjective Image Quality
There were no significant differences between sets A and B in terms of overall image quality (4; [4, 5] vs 4; [4, 5] for A and B, respectively, P = 0.37) and image noise (4; [4, 5] vs 4; [4, 5] for A and B, respectively, P = 0.44). There were an equal number of artifacts (4.5% [5/110] vs 4.5% [5/110]; P = 1) in both sets (Fig. 3).
FIGURE 3.
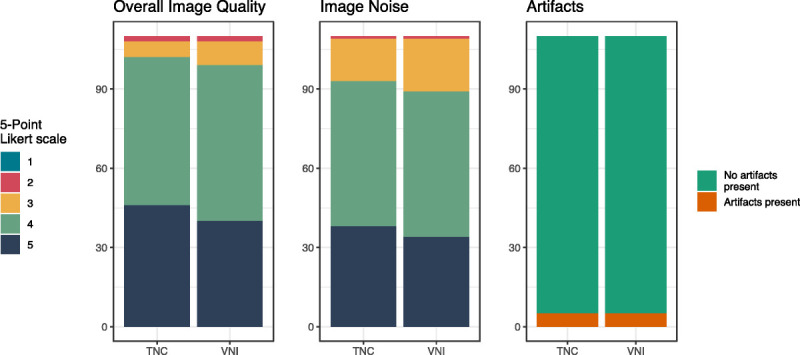
Subjective image quality. Comparison of overall image quality, image noise, and artifacts between true noncontrast and virtual noniodine images for reader 1. Data are shown by means of bar plots.
Calcification Subtraction
Almost all included patients had calcifications at the wall or within the abdominal aortic aneurysm (n = 108, 98%). In 80% of these patients, the calcifications were within the vessel wall, and in the remaining 20%, calcifications were within the lumen of the aneurysm. In 15 patients (14%), small aortic aneurysm calcifications were subtracted in the VNI images. Most of these calcifications were in the vessel wall (n = 12), and a few were intraluminal (n = 3). In 1 case (6.7%), erroneous calcium subtraction of an intraluminal calcification was relevant for the detection with a false-positive interpretation of an endoleak (Fig. 4). Calcifications and stent endograft generally appeared slightly less dense in VNI images as compared with TNC images in all patients.
FIGURE 4.
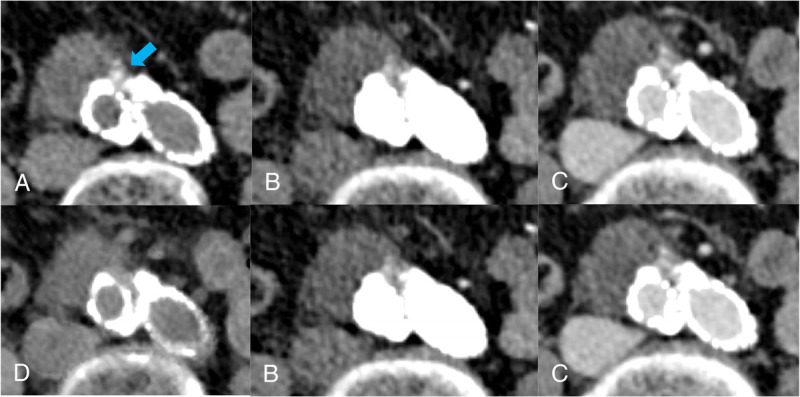
Axial CT images at the level of the aortic aneurysm obtained in an 86-year-old man referred for follow-up imaging after EVAR: (A) true noncontrast images with an arrow pointing at the calcifications, (B) arterial phase, (C) venous phase, and (D) virtual noniodine images with erroneous calcium subtraction. Please note the erroneous subtraction of intraluminal calcifications in (D), which led to a false-positive interpretation of an endoleak.
Phantom Part—Assessment of Noise Characteristics
Image noise magnitude was 12.7 HU and 11.5 HU for TNC and VNI, respectively. Image noise texture was comparable between the 2 reconstructions, with an average spatial frequency (fav) of 0.21 mm−1 and 0.22 mm−1 and a peak spatial frequency (fpeak) of 0.16 mm−1 and 0.16 mm−1 for TNC and VNI, respectively (Fig. 5).
FIGURE 5.
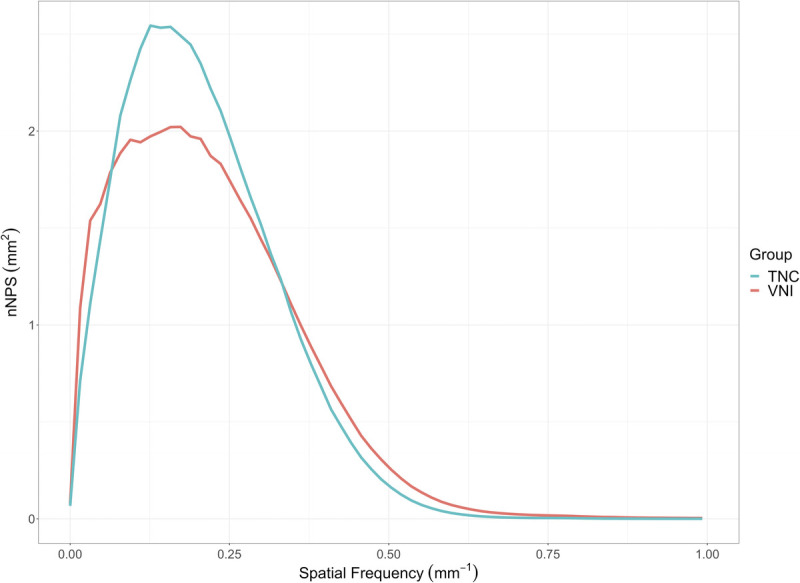
Normalized noise power spectrum demonstrated similar image noise texture between TNC and VNI images as indicated by comparable average and peak spatial frequencies. fav = 0.21 mm−1 and 0.22 mm−1 and fpeak 0.16 mm−1 and 0.16 mm−1 for TNC and VNI, respectively.
DISCUSSION
In this study, we evaluated the image quality, image noise texture, and diagnostic accuracy for endoleak detection in CT angiography after endovascular abdominal aortic aneurysm repair in 110 patients between a triphasic CT with a TNC scan and a biphasic CT with VNI images using PCD-CT. Our results demonstrated comparable objective and subjective image noise, noise texture, and diagnostic performance between TNC and VNI groups. By omitting the TNC scan, a potential radiation dose reduction of 38% would have been possible in our patient sample.
Several studies on energy-integrating detector dual-energy CT investigated the possibility to replace TNC with VNC in patients after EVAR.12,14,15,36 Although these studies found reliable endoleak detection, VNC images were typically limited by reduced subjective image quality or subtraction of aneurysmal calcifications.14 With the introduction of PCD-CT into clinical practice, a novel VNI algorithm became available, which is more suitable to distinguish calcium from iodine. This is particularly important in vascular imaging. In an initial study, Decker et al28 have compared these VNI to VNC in 20 patients after EVAR. The authors concluded that, in most cases, TNC could be substituted by VNI. However, endoleak detection analysis was not performed in this study. Therefore, our study extends the current body of literature by including image noise texture and endoleak detection analysis in a large patient sample. Decker et al28 demonstrated that VNI images were subjectively and objectively superior to VNC images, a finding that was confirmed subjectively by one expert reader in our study and led to the investigation of VNI compared with TNC in our study. In line with our results, the authors concluded that calcifications and stent grafts appeared slightly less dense in VNI compared with TNC images. In our study, small aortic aneurysm calcifications were erroneously subtracted in the VNI images in 15 patients. However, in most of these cases, subtracted calcifications were minuscule and distinguishable from contrast medium due to differences in density in the arterial and venous phases. In 1 case, however, erroneous calcium subtraction was relevant for endoleak detection with a false-positive interpretation of an endoleak.
Emrich et al30 compared TNC, VNC, and VNI for coronary calcium scoring in a phantom and patients. The authors concluded that there were significant improvements in calcium scoring using VNI as compared with VNC reconstructions. Nevertheless, VNI did not detect calcifications with very low densities accurately compared with TNC. Risch et al31 examined the quantification of epicardial adipose tissue using TNC, VNI, and VNC in PCD-CT. They observed that VNI had superior results compared with VNC, and it can be used to evaluate epicardial adipose tissue as a possible substitute for TNC, although there were minimal deviations compared with TNC.
Dangelmaier et al37 investigated the use of PCD-CT combined with a 2-contrast agent injection protocol for endoleak detection using a prototype PCD-CT system in a phantom. They explored dual contrast agent application for endoleak detection with a single CT acquisition. The authors concluded that the dual contrast agent application allows reliable distinction of endoleak from intra-aneurysmatic calcifications in a single CT acquisition. However, the authors noted important limitations such as the dual contrast agent application, which is not approved in a clinical setting.
The optimal number of scan phases required for imaging after EVAR remains a contentious topic in the literature. Some studies have suggested that a noncontrast scan alone is adequate to assess size changes of the aneurysmal sac and predict significant endoleaks.38 Others have recommended the use of VNC and late delayed phase images obtained from a single dual-energy CT acquisition.12,39 Nonetheless, we believe that the noncontrast phase is crucial in the initial postoperative imaging after EVAR to establish a baseline for calcifications and foreign material.9 Given that VNI is a novel reconstruction algorithm based on a new CT detector technology, we opted to use a full triphasic imaging protocol to compare VNI to TNC. Our results indicate that biphasic PCD-CT with VNI images may provide a good alternative to triphasic CT for the assessment of endoleaks after EVAR. Erroneous calcium subtraction with VNI was present in a few cases; however, this subtraction was minuscule and only relevant for endoleak detection in 1 case. Because of similar sensitivity and specificity, we think that this is not a significant limitation to replace TNC with VNI. Virtual noniodine may provide significant dose reduction. By omitting TNC images in the CT-follow up of the patients after EVAR, a dose reduction of 5.1 ± 1.5 mGy would have been possible. This can be relevant considering the cumulative radiation dose due to repeated follow-up imaging of this patient population and the generally increasing life expectancy.
Our study had several limitations. First, clinical outcome was not assessed. Second, we did not perform an objective image quality analysis in patients. We used a phantom to compare objective image noise and noise texture between VNI and TNC. Third, we did not systematically compare VNC to VNI. Decker et al28 have already demonstrated the superiority of VNI over VNC in patients after EVAR regarding subjective image quality. Fourth, we limited our investigation to VNI at a single VMI energy and reconstruction with a single kernel and iterative reconstruction algorithm strength. Fink et al40 have shown that calcium scoring differed among VNI of different VMI energies and reconstruction strengths. Fifth, we did not investigate the performance of VNI reconstructed from the arterial phase acquisition.
In conclusion, VNI images from PCD-CT are comparable to TNC images with regards to endoleak detection and image quality in patients after EVAR. Virtual noniodine images offer a promising alternative to TNC scans substantially reducing patients' radiation dose in follow-up imaging.
Footnotes
Conflicts of interest and sources of funding: M.P. is supported by a grant from the Promedica Foundation. The authors received institutional grants from Bayer Healthcare AG, Canon, Guerbet, and Siemens Healthcare GmbH. In addition, André Euler and Hatem Alkadhi are part of the speaker’s bureau of Siemens Healthcare GmbH.
Contributor Information
Ana Maria Turrion Gomollon, Email: anamaria.turriongomollon@usz.ch.
Victor Mergen, Email: victor.mergen@usz.ch.
Thomas Sartoretti, Email: thomas.sartoretti@usz.ch.
Malgorzata Polacin, Email: malgorzata.polacin@usz.ch.
Dominik Nakhostin, Email: dominik.nakhostin@usz.ch.
Gilbert Puippe, Email: gilbert.puippe@usz.ch.
Hatem Alkadhi, Email: hatem.alkadhi@usz.ch.
REFERENCES
- 1.Cassagnes L, Pérignon R, Amokrane F. Aortic stent-grafts: endoleak surveillance. Diagn Interv Imaging. 2016;97:19–27. [DOI] [PubMed] [Google Scholar]
- 2.Stavropoulos SW, Charagundla SR. Imaging techniques for detection and management of endoleaks after endovascular aortic aneurysm repair. Radiology. 2007;243:641–655. [DOI] [PubMed] [Google Scholar]
- 3.Zaiem F Almasri J Tello M, et al. A systematic review of surveillance after endovascular aortic repair. J Vasc Surg. 2018;67:320–331.e37. [DOI] [PubMed] [Google Scholar]
- 4.Ameli-Renani S, Pavlidis V, Morgan RA. Secondary endoleak management following TEVAR and EVAR. Cardiovasc Interv Radiol. 2020;43:1839–1854. [DOI] [PMC free article] [PubMed] [Google Scholar]
- 5.Picel AC, Kansal N. Essentials of endovascular abdominal aortic aneurysm repair imaging: postprocedure surveillance and complications. AJR Am J Roentgenol. 2014;203:W358–W372. [DOI] [PubMed] [Google Scholar]
- 6.Skawran S Angst F Blüthgen C, et al. Dual-energy low-keV or single-energy low-kV CT for endoleak detection?: a 6-reader study in an aortic aneurysm phantom. Invest Radiol. 2020;55:45–52. [DOI] [PubMed] [Google Scholar]
- 7.Iezzi R, Santoro M, Dattesi R. Multi-detector CT angiographic imaging in the follow-up of patients after endovascular abdominal aortic aneurysm repair (EVAR). Insights Imaging. 2012;3:313–321. [DOI] [PMC free article] [PubMed] [Google Scholar]
- 8.Chaikof EL, Brewster DC, Dalman RL. SVS practice guidelines for the care of patients with an abdominal aortic aneurysm: executive summary. J Vasc Surg. 2009;50:880–896. [DOI] [PubMed] [Google Scholar]
- 9.Iezzi R Cotroneo AR Filippone A, et al. Multidetector CT in abdominal aortic aneurysm treated with endovascular repair: are unenhanced and delayed phase enhanced images effective for endoleak detection? Radiology. 2006;241:915–921. [DOI] [PubMed] [Google Scholar]
- 10.Javor D Wressnegger A Unterhumer S, et al. Endoleak detection using single-acquisition split-bolus dual-energy computer tomography (DECT). Eur Radiol. 2017;27:1622–1630. [DOI] [PMC free article] [PubMed] [Google Scholar]
- 11.Macari M Chandarana H Schmidt B, et al. Abdominal aortic aneurysm: can the arterial phase at CT evaluation after endovascular repair be eliminated to reduce radiation dose? Radiology. 2006;241:908–914. [DOI] [PubMed] [Google Scholar]
- 12.Stolzmann P Frauenfelder T Pfammatter T, et al. Endoleaks after endovascular abdominal aortic aneurysm repair: detection with dual-energy dual-source CT. Radiology. 2008;249:682–691. [DOI] [PubMed] [Google Scholar]
- 13.Lehti L Söderberg M Höglund P, et al. Reliability of virtual non-contrast computed tomography angiography: comparing it with the real deal. Acta Radiol Open. 2018;7:205846011879011. [DOI] [PMC free article] [PubMed] [Google Scholar]
- 14.Sommer WH, Graser A, Becker CR. Image quality of virtual noncontrast images derived from dual-energy CT angiography after endovascular aneurysm repair. J Vasc Interv Radiol. 2010;21:315–321. [DOI] [PubMed] [Google Scholar]
- 15.Buffa V, Solazzo A, D'Auria V. Dual-source dual-energy CT: dose reduction after endovascular abdominal aortic aneurysm repair. Radiol Med. 2014;119:934–941. [DOI] [PubMed] [Google Scholar]
- 16.Lehti L Söderberg M Höglund P, et al. Comparing arterial- and venous-phase acquisition for optimization of virtual noncontrast images from dual-energy computed tomography angiography. J Comput Assist Tomogr. 2019;43:770–774. [DOI] [PMC free article] [PubMed] [Google Scholar]
- 17.Johnson TR, Krauß B, Sedlmair M. Material differentiation by dual energy CT: initial experience. Eur Radiol. 2007;17:1510–1517. [DOI] [PubMed] [Google Scholar]
- 18.Scheffel H, Stolzmann P, Frauenfelder T. Dual-energy contrast-enhanced computed tomography for the detection of urinary stone disease. Invest Radiol. 2007;42:823–829. [DOI] [PubMed] [Google Scholar]
- 19.Virarkar MK, Vulasala SSR, Gupta AV. Virtual non-contrast imaging in the abdomen and the pelvis: an overview. Semin Ultrasound CT MR. 2022;43:293–310. [DOI] [PubMed] [Google Scholar]
- 20.De Cecco CN Buffa V Fedeli S, et al. Dual energy CT (DECT) of the liver: conventional versus virtual unenhanced images. Eur Radiol. 2010;20:2870–2875. [DOI] [PubMed] [Google Scholar]
- 21.Euler A Higashigaito K Mergen V, et al. High-pitch photon-counting detector computed tomography angiography of the aorta: intraindividual comparison to energy-integrating detector computed tomography at equal radiation dose. Invest Radiol. 2022;57:115–121. [DOI] [PubMed] [Google Scholar]
- 22.McCollough CH, Rajendran K, Leng S. Standardization and quantitative imaging with photon-counting detector CT. Invest Radiol. 2023. [DOI] [PMC free article] [PubMed] [Google Scholar]
- 23.Schwartz FR, Samei E, Marin D. Exploiting the potential of photon-counting CT in abdominal imaging. Invest Radiol. 2023. [DOI] [PubMed] [Google Scholar]
- 24.Wildberger JE, Alkadhi H. New horizons in vascular imaging with photon-counting detector CT. Invest Radiol. 2023. [DOI] [PubMed] [Google Scholar]
- 25.Jost G McDermott M Gutjahr R, et al. New contrast media for K-edge imaging with photon-counting detector CT. Invest Radiol. 2023. [DOI] [PMC free article] [PubMed] [Google Scholar]
- 26.Flohr T Petersilka M Henning A, et al. Photon-counting CT review. Phys Med. 2020;79:126–136. [DOI] [PubMed] [Google Scholar]
- 27.Symons R Sandfort V Mallek M, et al. Coronary artery calcium scoring with photon-counting CT: first in vivo human experience. Int J Cardiovasc Imaging. 2019;35:733–739. [DOI] [PubMed] [Google Scholar]
- 28.Decker JA Bette S Scheurig-Muenkler C, et al. Virtual non-contrast reconstructions of photon-counting detector CT angiography datasets as substitutes for true non-contrast acquisitions in patients after EVAR-performance of a novel calcium-preserving reconstruction algorithm. Diagn Basel Switz. 2022;12:558. [DOI] [PMC free article] [PubMed] [Google Scholar]
- 29.Mergen V Racine D Jungblut L, et al. Virtual noncontrast abdominal imaging with photon-counting detector CT. Radiology. 2022;305:107–115. [DOI] [PubMed] [Google Scholar]
- 30.Emrich T, Aquino G, Schoepf UJ. Coronary Computed tomography angiography-based calcium scoring: in vitro and in vivo validation of a novel virtual noniodine reconstruction algorithm on a clinical, first-generation dual-source photon counting-detector system. Invest Radiol 2022;57:536–543. [DOI] [PubMed] [Google Scholar]
- 31.Risch F, Schwarz F, Braun F. Assessment of epicardial adipose tissue on virtual non-contrast images derived from photon-counting detector coronary CTA datasets. Eur Radiol. 2023;33:2450–2460. [DOI] [PMC free article] [PubMed] [Google Scholar]
- 32.Sartoretti T Mergen V Higashigaito K, et al. Virtual noncontrast imaging of the liver using photon-counting detector computed tomography: a systematic phantom and patient study. Invest Radiol. 2022;57:488–493. [DOI] [PubMed] [Google Scholar]
- 33.Sartoretti T Landsmann A Nakhostin D, et al. Quantum iterative reconstruction for abdominal photon-counting detector CT improves image quality. Radiology. 2022;303:339–348. [DOI] [PubMed] [Google Scholar]
- 34.Samei E, Bakalyar D, Boedeker KL. Performance evaluation of computed tomography systems: summary of AAPM task group 233. Med Phys. 2019;46:735–756. [DOI] [PubMed] [Google Scholar]
- 35.Nakhostin D Sartoretti T Eberhard M, et al. Low-dose dual-energy CT for stone characterization: a systematic comparison of two generations of split-filter single-source and dual-source dual-energy CT. Abdom Radiol N Y. 2021;46:2079–2089. [DOI] [PubMed] [Google Scholar]
- 36.Maturen KE, Kleaveland PA, Kaza RK. Aortic endograft surveillance: use of fast-switch kVp dual-energy computed tomography with virtual noncontrast imaging. J Comput Assist Tomogr. 2011;35:742–746. [DOI] [PubMed] [Google Scholar]
- 37.Dangelmaier J, Bar-Ness D, Daerr H. Experimental feasibility of spectral photon-counting computed tomography with two contrast agents for the detection of endoleaks following endovascular aortic repair. Eur Radiol. 2018;28:3318–3325. [DOI] [PMC free article] [PubMed] [Google Scholar]
- 38.Boos J Brook OR Fang J, et al. What is the optimal abdominal aortic aneurysm sac measurement on CT images during follow-up after endovascular repair? Radiology. 2017;285:1032–1041. [DOI] [PubMed] [Google Scholar]
- 39.Flors L Leiva-Salinas C Norton PT, et al. Endoleak detection after endovascular repair of thoracic aortic aneurysm using dual-source dual-energy CT: suitable scanning protocols and potential radiation dose reduction. AJR Am J Roentgenol. 2013;200:451–460. [DOI] [PubMed] [Google Scholar]
- 40.Fink N Zsarnoczay E Schoepf UJ, et al. Photon counting detector CT-based virtual noniodine reconstruction algorithm for in vitro and in vivo coronary artery calcium scoring: impact of virtual monoenergetic and quantum iterative reconstructions. Invest Radiol. 2023. [DOI] [PubMed] [Google Scholar]


