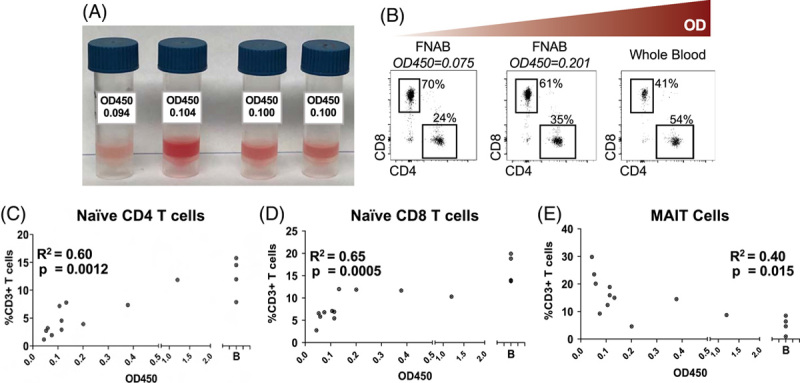
FIGURE 1.

Quantification of RBC contamination of liver FNAs. (A) Images showing variable RBC contents of individual FNA passes. (B) CD4:CD8 ratio in FNA passes from a single patient with increasing OD450 values. Frequency of (C) naïve CD4 T cells (D) naïve CD8 T cells and (E) MAIT cells compared to OD450 values of each FNA pass. Analysis was done using the Pearson pairwise correlation. Abbreviation: MAIT, mucosal-associated invariant T.
