FIGURE 6.

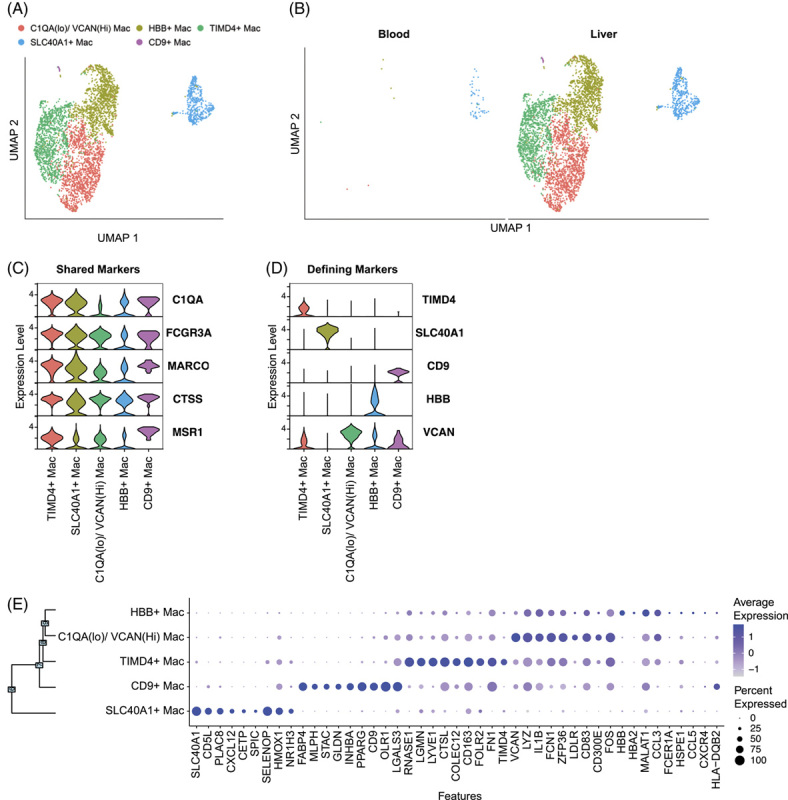
Macrophage identification in liver FNAs. (A) scRNA-seq UMAP for macrophages colored by cluster IDs. (B) UMAP dimensionality reduction of macrophages by compartment. Violin plots of (C) macrophage-shared genes and (D) unique cluster-defining genes. (E) Dot plot showing the top 9 cluster-defining genes. Significance was determined using the Wilcoxon Rank-Sum test with the Bonferroni correction (adjusted p-value < 0.05). Abbreviations: Mac, macrophages; scRNA-seq, single cell RNA sequencing.
