

Abstract
We define an iterative method for dimensionality reduction using categorical gradient boosted trees and Shapley values and created four machine learning models which potentially could be used as diagnostic tests for acute myeloid leukaemia (AML). For the final Catboost model we use a dataset of 2177 individuals using as features 16 probe sets and the age in order to classify if someone has AML or is healthy. The dataset is multicentric and consists of data from 27 organizations, 25 cities, 15 countries and 4 continents. The performance of our last model is specificity: 0.9909, sensitivity: 0.9985, F1-score: 0.9976 and its ROC-AUC: 0.9962 using ten fold cross validation. On an inference dataset the perormance is: specificity: 0.9909, sensitivity: 0.9969, F1-score: 0.9969 and its ROC-AUC: 0.9939. To the best of our knowledge the performance of our model is the best one in the literature, as regards the diagnosis of AML using similar or not data. Moreover, there has not been any bibliographic reference which associates AML or any other type of cancer with the 16 probe sets we used as features in our final model.
1. Introduction
Acute myeloid leukaemia (AML) [1] is often characterized by non detectable early symptoms and its quick diagnosis, even in an intensive care unit could have a huge impact on the overall survival [2]. The use of machine learning can be helpful on the diagnosis of this disease and therefore in the creation of a screening tool [3], [4]. The early diagnosis of AML using only peripheral blood and the cost reduction a machine learning based diagnostic test could create a tremendous positive impact to society. A method for categorizing and examining acute myeloid leukemia is presented in the diagnostic flowchart in Figure 1 of [5]. It is founded on the recommendations of various authoritative bodies, such as the World Health Organization, the College of American Pathologists, the National Comprehensive Cancer Network, the American Society of Clinical Oncology, the European Society of Medical Oncology and the European LeukemiaNet. The diagnostic flowchart approach introduces a certain degree of complexity to the process, which in turn increases the cost and time needed to reach a near-certain diagnosis, which is far more complex and it could be more costly than our approach. If our work progresses, it may lead to a diagnostic approach that profiles the transcriptome of 16-34 genes from peripheral blood to determine if someone is healthy or has AML. While this method appears promising, it's crucial to underscore the need for additional validation before gaining clinical acceptance, especially given that most of these markers aren't conclusively associated with the disease.
Here we focus on the primary diagnosis of AML using the minimum number of probe sets possible in order to achieve excellent performance regarding both true positives and true negatives. In addition, we use the age as feature to our final model since its prognostic value is high regarding the survival of patients with AML [6]. Another reason we include the age is that from deep learning work in radiology, in particular in ultrasound with even small data sets of 100 data instances [7], [8], and with CatBoost [9] using features coming from different sources we can achieve high performance in binary classification problems both on sensitivity and specificity.
We first tune a CatBoost [10] on a curated publicly available Affymetrix microarray gene expression and normalized batch corrected dataset consisted of probe sets of 3374 individuals [3], in order to classify if an individual has AML or is healthy. CatBoost library offers the option to return the set of features' importance of CatBoost algorithm and also the set of features' importance of the loss function change using Shapley values [11]. The above two sets can differ.
CatBoost is a machine learning algorithm and it stands for “Categorical Boosting”. It is used to predict outcomes based on past data. It does this by repeatedly learning from the data, adjusting its predictions, and striving to make fewer mistakes in each round of learning, a process known as ‘boosting’. Catboost has 103 hyperparameters. In our approach, we tune only three of them: learning rate, depth and iterations. The default values of the other hyperparameters work in general very well. Regarding the hyperparameters, the learning rate determines how quickly or slowly the model ‘learns’ or adjusts its predictions in each iteration. The depth refers to the complexity of the model. A higher depth means a more complex model that can capture more nuanced relationships in the data. Iterations are the number of times the model goes through the learning cycle. Adjusting these hyperparameters helps find the best balance for the specific task, which in our case is the diagnosis of acute myeloid leukaemia. The default loss function catboost uses for binary classification problems is the log-loss:
where
-
•
L(y,p) is the log-loss function.
-
•
N is the total number of observations in the dataset
-
•
is the true label (either 0 or 1) of the observation
-
•
is the predicted probability of the observation being class 1.
The log-loss function measures how far the model's predictions are from the true values . If the predicted probability closely matches the actual class, the log-loss will be small, and vice versa.
The concept of Shapley values originates from cooperative game theory, where it is used to divide up gains among players based on their contribution to the total gain. In the context of machine learning Shapley values are used to measure the importance of each feature — the equivalent of a “player” — in making a prediction. Specifically with CatBoost, both feature importance on predictability and feature importance on log-loss change assess the significance of each feature in the model, but they focus on different aspects and their calculations are influenced by different aspects of the model's behavior.
-
•
Feature Importance on Predictability using Shapley Values: In this context, the Shapley value of a feature is determined by systematically considering all possible combinations of features, and then averaging the changes in prediction caused by adding that feature. If a feature often results in significant changes in prediction when added to different combinations of other features, it would have a high Shapley value and therefore be considered important for predictability. In essence, it captures how much the presence of a feature changes the model's predictions.
-
•
Feature Importance on Log-Loss Change using Shapley Values: This method measures how much each feature contributes to changes in the log-loss, or error, of the model. It looks at how the log-loss changes when the values of a feature are altered. The Shapley value of a feature in this context indicates how much, on average, removing or including that feature changes the error of the model. If a feature significantly impacts the log-loss when its values are altered, it would be considered important in this context.
In summary, feature importance on predictability looks at how much the inclusion of a feature changes the model's output, while feature importance on log-loss change looks at how much a feature changes the error of the model. Both perspectives are useful, and Shapley values provide a unified and theoretically grounded way to calculate these measures of feature importance.
Our approach is to keep the 100 most important features for each of the above two sets and then we take the intersection of these which consists of 34 probe sets. The idea of intersection comes from the fact that we would like to include features of high importance regarding the predictability of CatBoost algorithm and at the same time its loss function change during the training process.
We randomly split the dataset of the 34 probe sets and the 3374 data instances using 80% for training and 20% for validation. We use 10 fold cross validation (10CV) [12] in order to tune a CatBoost on the training set, and then we validate it on the test set.
From these 34 probe sets we keep only those for which we cannot find any bibliographic reference regarding their association to AML, Table 12. The only associated to AML feature we include in our final machine learning models is the age of each individual.
Table 12.
The 26 probe sets ranked by their feature importance regarding the predictability of CatBoost. Information such as, probe set's ID, corresponding gene symbols or NCBI accession numbers, blood malignancies and/or other types of cancer they are associated with, as well as, general annotations about the probe sets and the role of the gene products are presented here.
| Probe set ID | Gene Symbol/NCBI Accesion Number | Blood Malignancies | Other types of cancer | General |
|---|---|---|---|---|
| 234632_x_at | AK026267 | n/a | n/a | cDNA: FLJ22614 fis, clone HSI05089 [53] |
| 209603_at | GATA3 | Acute Lymphoblastic Leukemia (ALL) [54] | Breast Cancer [55], Bladder Cancer [56] | This gene encodes a protein, which plays a role as regulator of T-cell development [53] |
| 230527_at | LOC101926907 | n/a | n/a | Uncharacterized Gene [53] |
| 229963_at | BEX5 | n/a | n/a | The protein encoded by this gene plays a role in neuronal development [57] |
| 217901_at | DSG2 | n/a | Cervical Cancer [58], Epithelial-derived Carcinomas [59], Pancreatic Cancer [60], Breast Cancer [61], Colon Cancer [62], Lung Cancer [63], [64], Gastric Cancer [65], [66], Ovarian Cancer [67], Laryngeal Cancer [68], Liver Cancer [69] | This gene encodes a calcium-binding transmembrane glycoprotein component of desmosomes, which plays a role in cell-cell junctions between epithelial, myocardial, and other types of cells [53] |
| 214719_at | SLC46A3 | n/a | Liver Cancer [70] | This gene encodes a protein, which is involved in transportation of small molecules across membranes [53] |
| 219513_s_at | SH2D3A | n/a | n/a | This gene encodes a protein, which may play a role in JNK activation [71] |
| 210789_x_at | CEACAM3 | n/a | n/a | The protein encoded by this gene it is thought to play an important role in controlling human-specific pathogens [53] |
| 204777_s_at | MAL | n/a | Gastric Cancer [72], Breast Cancer [73], Ovarian Cancer [74], Colorectal Cancer [75] | This gene encodes a protein, which plays a central role in the formation, stabilization and maintenance of glycosphingolipid-enriched membrane microdomains [53] |
| 203294_s_at | LMAN1 | n/a | n/a | This gene encodes a protein, which is involved in glycoprotein transportation [53] |
| 230753_at | PATL2 | n/a | n/a | This gene encodes an RNA-binding protein, which plays a role as translational repressor in regulation of maternal mRNAs during oocyte maturation [76] |
| 242056_at | TRIM45 | n/a | Lung Cancer [77], Glioma [78] | The encoded protein acts as a transcriptional repressor of the mitogen-activated protein kinase pathway [53] |
| 217680_x_at | RPL10 | T-cell Acute Lymphoblastic Leukemia (T-ALL) [79], [80] | Ovarian Cancer [81], Pancreatic Cancer [82] | The encoded protein is a component of the 60S ribosome subunit [53] |
| 214945_at | FAM153A & FAM153B & FAM153C & LOC100507387 & LOC105377751 | n/a | n/a | Unknown function/Uncharacterized gene [53] |
| 222312_s_at | AW969803 | n/a | n/a | Expressed sequence tag [53] |
| 214705_at | PATJ | n/a | n/a | This gene encodes a protein, which is located in tight junctions and in the apical membrane of epithelial cells [53] |
| 241688_at | AA677700 | n/a | n/a | Expressed sequence tag [53] |
| 241611_s_at | FNDC3A | Multiple Myeloma [83] | n/a | The protein encoded by this gene plays a role in spermatid-Sertoli adhesion during spermatogenesis [84] |
| 236952_at | AI309861 | n/a | n/a | Expressed sequence tag [53] |
| 207636_at | SERPINI2 | Chronic Lymphocytic Leukemia (CLL) [85] | pancreatic cancer [86] | The encoded protein is involved in the regulation of a variety of physiological processes, including coagulation, fibrinolysis, development, malignancy, and inflammation [53] |
| 243659_at | N63876 | n/a | n/a | Expressed sequence tag [53] |
| 226311_at | ADAMTS2 | Mixed Phenotype Acute Leukemias (MPAL) [87] | Gastric Cancer [88], Kidney Cancer [89] | This gene encodes an extracellular metalloproteinase, which plays a significant role in the excision of the N-propeptides of procollagens I-III and type V [53] |
| 211772_x_at | CHRNA3 | T-cell Acute Lymphoblastic Leukemia (T-ALL) [90] | Lung Cancer [91] | The protein encoded by this gene is a ligand-gated ion channel, which plays a role in neurotransmission [53] |
| 244719_at | AA766704 | n/a | n/a | Expressed sequence tag [53] |
| 239766_at | BF507518 | n/a | n/a | Expressed sequence tag [53] |
| 243272_at | LOC101593348 | n/a | n/a | Uncharacterized gene [53] |
We randomly split the dataset of 2177 individuals using 80% for training and 20% for validation. We use 10CV in order to tune the CatBoost on the training set, and then we validate it on the test set.
In Fig. 1 we show diagram of the four models and the corresponding datasets of our approach.
Figure 1.

Datasets and CatBoost models with their harmonic mean of precision and recall. The first integer corresponds to the number of the data instances and the second one corresponds to the number of features.
2. Models
The dimensionality reduction CatBoost model has 200 iterators, depth 6 and learning rate 0.1. We randomly split the initial dataset of 3374 data instances and 44754 probe sets. The performance of the tuned model appears in Table 1.
Table 1.
Performance of the dimensionality reduction CatBoost model of the 10CV on the 80% training set and on the 20% validation set of 3374 data instances and 44754 probe sets. The dataset corresponds to U133A, U133B and U133 2.0 microarrays.
| Metrics | Validation Set | 10CV |
|---|---|---|
| Spec. | 0.9929 | 0.9805 |
| Sens. | 1.0000 | 0.9991 |
| AUC | 0.9965 | 0.9898 |
| F1-score | 0.9964 | 0.9884 |
We compute the intersection of the sets of the most important features, regarding the predictability of CatBoost, and the most important features regarding the loss function change during the training process. We set the number of elements of each set to be 100. The intersection has only 34 probe sets. We tune a CatBoost model (CatBoost34) of 200 iterators, depth 5 and learning rate 0.1 on the dataset of 3374 data instances. The results in Table 2 show that using only 34 probe sets our machine learning model is able to achieve great performance.
Table 2.
Performance of the CatBoost34 model of the 10CV on the 80% training set and on the 20% validation set of 3374 data instances and 34 probe sets. The dataset corresponds to U133A, U133B and U133 2.0 microarrays.
| Metrics | Validation Set | 10CV |
|---|---|---|
| Spec. | 1.0000 | 0.9929 |
| Sens. | 1.0000 | 0.9926 |
| AUC | 1.0000 | 0.9920 |
| F1-score | 1.0000 | 0.9972 |
From the 34 probe sets we exclude all which are associated from bibliographic references to AML so we keep only the 26 probe sets of Table 12. From these 26 probe sets six: {209603_at, 217680_x_at, 241611_s_at, 207636_at, 226311_at, 211772_x_at} are associated to other than AML blood malignancies (Acute Lymphoblastic Leukemia, T-cell Acute Lymphoblastic Leukemia, Multiple Myeloma, Chronic Lymphocytic Leukemia, Mixed Phenotype Acute Leukemias); 9 are associated to other types of cancer and from which 5 belong to both blood and other types of cancer. To the best of our knowledge from the 26 probe sets of Table 12 the following 16 are not associated to any type of cancer: {234632_x_at, 230527_at, 229963_at, 219513_s_at, 210789_x_at, 203294_s_at, 230753_at, 214945_at, 222312_s_at, 214705_at, 241688_at, 236952_at, 236952_at, 244719_at, 239766_at, 243272_at}. The tuned CatBoost model which we use for the diagnosis of AML (CatBoost26) has 100 iterators and depth 11 with learning rate 0.1.
As final experiment we use the 16 probe sets that, according to bibliography, there have not been associated yet with AML or with any other cancer and we tune another catboost model, namely the CatBoost16. In this machine learning model we also use the age as feature for the reasons we discussed above. The number of these probe sets makes the CatBoost16 a potential candidate for clinical application since the cost of identifying the expression of these 16 probe sets from peripheral blood is much less than the cost of examinations needed to finally conclude if an individual has AML. The results of CatBoost16 on the same train/test split that we used for CatBoost26 can be found at Table 5. We observe that CatBoost16's performance is similar to the performance of the CatBoost26 and it is still better than the performance of the k-NN model (6) which uses 984 probe sets from [3]. CatBoost16 has 200 iterators and depth 7 with learning rate 0.1.
Table 5.
Performance of the CatBoost16 of the 10CV on the 80% training set and on the 20% validation set of 2177 data instances on 16 probe sets and the age.
| Metrics | Validation Set | 10CV |
|---|---|---|
| Spec. | 0.9909 | 0.9909 |
| Sens. | 0.9969 | 0.9985 |
| AUC | 0.9939 | 0.9962 |
| F1-score | 0.9969 | 0.9976 |
Table 6.
Performance of the k-NN model of [3] of the 10CV on 80% training set and on the 20% validation set of 3374 data instances and 984 probe sets.
| Metrics | Validation Set | 10CV |
|---|---|---|
| Spec. | 0.9716 | 0.9546 |
| Sens. | 0.9925 | 0.9920 |
| AUC | 0.9821 | 0.9788 |
| F1-score | 0.9925 | 0.9899 |
3. Data
The initial dataset is a curated publicly available Affymetrix microarray gene expression one and it consists of 34 datasets derived from 32 studies [3]. It is an international multicentric dataset since its data instances come from 27 organizations, 25 cities, 15 countries and 4 continents. The data come from different transcriptomic platforms: Affymetrix Human Genome U133 Plus 2.0 microarray, Affymetrix Human Genome U133A microarray and Affymetrix Human Genome U133B microarray.
At first, the dataset consisted of 44754 probe sets and 3374 data instances which corresponded to 3374 individuals. From the 3374 data instances 2668 (79.08%) were labelled as AML and 706 (20.92%) as healthy.
The dimensionality reduction tuned model is applied on this dataset. We keep the 26 probe sets of the 34 {227923_at, 212549_at, 219386_s_at, 207754_at, 208022_s_at, 209543_s_at, 210244_at, 207206_s_at, 210789_x_at, 239766_at, 241688_at, 244719_at, 236952_at, 241611_s_at, 217901_at, 229963_at, 230527_at, 222312_s_at, 214705_at, 203294_s_at, 209603_at, 243659_at, 230753_at, 204777_s_at, 234632_x_at, 217680_x_at, 219513_s_at, 214719_at, 211772_x_at, 207636_at, 243272_at, 214945_at, 226311_at, 242056_at} for which, to the best of our knowledge, there has not been any reference regarding their association to AML yet. Since we want to use also the age of the individuals as feature to our diagnostic CatBoost model, we drop-out all the data instances with no age filled-in.
The final dataset consists of 2177 data instances and it has 27 features (26 probe sets and the age). Table 7, Table 8, Table 11 provide detailed information about the dataset, including the number of samples used, the sample source, the sex and the age of the individuals, the organizations which provided the data, the AML subtypes and statistics about the overall survival when available, as well as the total number of AML patients and healthy individuals.
Table 7.
Number of samples and sample source, (peripheral blood (PB), bone marrow (BM)) of the train and validation set of 2177 individuals.
| Index | Train #Sam. & Sam. Source | % | Val. #Sam. & Sam. Source | % |
|---|---|---|---|---|
| 0 | 6 BM | 75.00% | 2 BM | 25.00% |
| 1 | 245 BM | 81.67% | 55 BM | 18.33% |
| 2 | 22 PB | 84.62% | 4 PB | 15.38% |
| 3 | 56 (52 BM & 4 PB) | 71.80% | 22 (21 BM & 1 PB) | 28.20% |
| 4 | 412 (379 BM & 33 PB) | 78.48% | 113 (103 BM & 10 PB) | 21.52% |
| 5 | 14 BM | 87.50% | 2 BM | 12.50% |
| 6 | 194 (177 BM & 17 PB) | 77.29% | 57 (54 BM & 3 PB) | 22.71% |
| 7 | 6 PB | 75.00% | 2 PB | 25.00% |
| 8 | 18 PB | 81.82% | 4 PB | 18.18% |
| 9 | 11 PB | 78.57% | 3 PB | 21.43% |
| 10 | 13 PB | 76.47% | 4 PB | 23.53% |
| 11 | 20 PB | 80.00% | 5 PB | 20.00% |
| 12 | 50 PB | 79.37% | 13 PB | 20.63% |
| 13 | 22 (12 BM & 10 PB) | 64.71% | 12 (9 BM & 3 PB) | 35.29% |
| 14 | 11 PB | 91.67% | 1 PB | 8.33% |
| 15 | 1 PB | 50.00% | 1 PB | 50.00% |
| 16 | 11 (9 BM & 2 PB) | 91.67% | 1 BM | 8.33% |
| 17 | 28 PB | 80.00% | 7 PB | 20.00% |
| 18 | 120 BM | 85.71% | 20 BM | 14.29% |
| 19 | 37 PB | 80.43% | 9 PB | 19.57% |
| 20 | 12 (10 BM & 2 PB) | 92.30% | 1 BM | 7.70% |
| 21 | 19 PB | 79.17% | 5 PB | 20.83% |
| 22 | 9 (6 BM & 3 PB) | 75.00% | 3 (2 BM & 1 PB) | 25.00% |
| 23 | 148 BM | 80.87% | 35 BM | 19.13% |
| 24 | 12 PB | 100.00% | - | 00.00% |
| 25 | 3 PB | 100.00% | - | 00.00% |
| 26 | 42 (23 BM & 19 PB) | 93.33% | 3 (2 BM & 1 PB) | 6.67% |
| 27 | 26 PB | 86.67% | 4 PB | 13.33% |
| 28 | 25 PB | 71.43% | 10 PB | 28.57% |
| 29 | 49 PB | 76.56% | 15 PB | 23.44% |
| 30 | 99 PB | 81.82% | 22 PB | 18.18% |
| 31 | - | 00.00% | 1 PB | 100.00% |
Table 8.
Number of patients per age group of the train and validation set. As regards the train set the mean of age is 48.98 with standard deviation 17.06 and as regards the validation set the mean of age is 48.46 and the standard deviation is 16.79.
| Train set | Validation set | ||
|---|---|---|---|
| Age group: # Number of patients | % | Age group: # Number of patients | % |
| 0 to 19: 75 | 4.31% | 0 to 19: 24 | 5.5% |
| 20 to 29: 180 | 10.34% | 20 to 29: 37 | 8.49% |
| 30 to 39: 272 | 15.62% | 30 to 39: 68 | 15.6% |
| 40 to 49: 313 | 17.98% | 40 to 49: 80 | 18.35% |
| 50 to 59: 378 | 21.71% | 50 to 59: 109 | 25% |
| 60 to 69: 319 | 18.32% | 60 to 69: 71 | 16.28% |
| 70 to 79: 171 | 9.82% | 70 to 79: 41 | 9.4% |
| 80 to 100: 33 | 1.9% | 80 to 100: 6 | 1.38% |
Table 11.
References, GEO Accesion, Health Status, Origin of Study, AML subtypes of the study and Overall Survival of the train and validation set of 2177 individuals. The index corresponds to the index of Table 7. Some references which have not been published yet are notated with NYP.
| Index | Reference | GEO Acc. | AML/Healthy | City, Country, Org. | AML subtypes | OS |
|---|---|---|---|---|---|---|
| 0 | [19] | GSE10258 | AML | Vienna, Austria, Medical University of Vienna | M1, M5 | n/a |
| 1 | [20], [21] | GSE10358 | AML | St Louis, USA, Washington University School of Medicine | M0, M1, | n/a |
| M2, M3, | ||||||
| M4, M5, | ||||||
| M6, M7 | ||||||
| 2 | [22] | GSE11375 | Healthy | Boston, USA, Massachusetts General Hospital | n/a | n/a |
| 3 | [23], [24] | GSE12417 | AML | Munich, Germany, University of Munich | M0, M1, | Mean: 614.76, |
| M2, M4, | Std: 503.59 | |||||
| M5, M6 | ||||||
| 4 | [25], [26], [27] | GSE14468 | AML | Houston, USA, MD Anderson Cancer Center | M0, M1, | n/a |
| M2, M3, | ||||||
| M4, M4 eos, | ||||||
| M5, M6 | ||||||
| 5 | [28] | GSE14479 | AML | Rotterdam, Netherlands, Erasmus University Medical Center | n/a | n/a |
| 6 | [29] | GSE15434 | AML | New York, USA, Columbia University Medical Center | n/a | n/a |
| 7 | Wu 2012 (NYP) | GSE15932 | Healthy | Hangzhou, China, Second Affiliated Hospital, School of Medicine, Zhejiang University | n/a | n/a |
| 8 | [30] | GSE16028 | Healthy | Basel, Switzerland, F.Hoffmannn/La Roche AG | n/a | n/a |
| 9 | Krug 2011 (NYP) | GSE17114 | Healthy | Lisbon, Portugal, Instituto de Medicina Molecular | n/a | n/a |
| 10 | [31] | GSE18123 | Healthy | Boston, USA, Boston Children's Hospital | n/a | n/a |
| 11 | [32] | GSE18781 | Healthy | Portland, USA, Oregon Health & Science University | n/a | n/a |
| 12 | [33] | GSE19743 | Healthy | Palo Alto, USA, Stanford Genome Technology Center | n/a | n/a |
| 13 | [34] | GSE23025 | AML | Duarte, USA, City of Hope Beckman Research Institute | n/a | n/a |
| 14 | [35] | GSE25414 | Healthy | Barcelona, Spain, Institut de Recerca Hospital Vall d'Hebron | n/a | n/a |
| 15 | [36] | GSE2842 | Healthy | Bolzano, Italy, EURAC | n/a | n/a |
| 16 | [37] | GSE29883 | AML | Berlin, Germany, Charité | t(8;21), t(16;16) | n/a |
| 17 | [38] | GSE36809 | Healthy | Boston, USA, Massachusetts General Hospital | n/a | n/a |
| 18 | [39], [40], [41], [42] | GSE37642 | AML | Munich, Germany, University Hospital Grosshadern, Ludwign/Maximiliansn/University (LMU) | M0, M1, | Mean: 962.32, |
| M2, M3, | Std: 1106.70 | |||||
| M4, M5, | ||||||
| M6, M7 | ||||||
| 19 | [43], [44] | GSE39088 | Healthy | Brussels, Belgium, Université catholique de Louvain | n/a | n/a |
| 20 | Bullinger 2014 (NYP) | GSE39363 | AML | Berlin, Germany, Charité | t(3;3) | n/a |
| 21 | [45] | GSE46449 | Healthy | New York, USA, Columbia University Medical Center | n/a | n/a |
| 22 | [46], [47] | GSE46819 | AML | Berlin, Germany, Charité | t(16;16) | n/a |
| 23 | Leong 2015 (NYP) | GSE68833 | AML | Rockville, USA, NCI | M0, M1, | n/a |
| M2, M3, | ||||||
| M4, M5, | ||||||
| M6, M7 | ||||||
| 24 | [48] | GSE69565 | AML | Singapore, Singapore, Cancer Science Institute of Singapore | n/a | n/a |
| 25 | Meng 2015 (NYP) | GSE71226 | Healthy | Changchun, China, the Department of Cardiology, China-Japan Union Hospital, Jilin University | n/a | n/a |
| 26 | Bohl 2016 (NYP) | GSE84334 | AML | Ulm, Germany, University Hospital of Ulm | n/a | n/a |
| 27 | [49] | GSE84844 | Healthy | Fujisawa, Japan, Takeda Pharmaceutical Company Limited | n/a | n/a |
| 28 | [50] | GSE93272 | Healthy | Fujisawa, Japan, Takeda Pharmaceutical Company Limited | n/a | n/a |
| 29 | [51] | GSE98793 | Healthy | Cambridge, United Kingdom, University of Cambridge | n/a | n/a |
| 30 | [52] | GSE99039 | Healthy | Tel Aviv, Israel, Tel Aviv University | n/a | n/a |
| 31 | Green 2009 (NYP) | GSE14845 | Healthy | Southport, Australia, Griffith Insitute for Health & Medical Research | n/a | n/a |
From the 2177 individuals, 1013 are female (46.53%), 943 are male (43.32%) and 221 are unknown (10.15%). In addition, 1629 are AML patients (74.83%) and 548 are healthy (25.17%). The mean and the standard deviation of age are 48.87 and 17.01, respectively. As regards the number of data instances per age group in the data set we have: 99 [0-19], 217 [20-29], 340 [30-39], 393 [40-49], 487 [50-59], 390 [60-69], 212 [70-79] and 39 [80-89].
We randomly split the final dataset in two sets: training and validation (Table 7, Table 8). The training set consists of 1740 data instances (79.93%) and the validation set of the rest 437 (20.07%). Since the dataset is relatively small we use 10 fold cross validation in order to tune our model. In the Fig. 2 we observe the feature importance of the 27 features as regards the predictability of the CatBoost model using the 10CV, while in the Fig. 3 we can see the feature importance of the loss change for each one of the 27 features.
Figure 2.

Features' importance of the predictability of CatBoost diagnosis model.
Figure 3.

Features' importance of the CatBoost diagnosis model.
4. Results
At Table 3 we see that our diagnosis model, CatBoost26, performs really well. The confusion matrix, Table 4, shows the true-positives (down-right), the true-negatives (up-left), false-positives (down-left) and false-negatives (up-right). Here, a positive data instance is a data instance labelled as AML and negative as a healthy one. The mean area under the curve (AUC) from the 10CV is 0.9988 with standard deviation 0.0023 and 95% confidence interval: . The mean accuracy is 0.9994 with standard deviation 0.0011.
Table 3.
Performance of the CatBoost diagnosis model, CatBoost26, of the 10CV on the 80% training set and on the 20% validation set of 2177 data instances on 26 probe sets and the age.
| Metrics | Validation Set | 10CV |
|---|---|---|
| Spec. | 1.0000 | 1.0000 |
| Sens. | 1.0000 | 0.9992 |
| AUC | 1.0000 | 0.9988 |
| F1-score | 1.0000 | 0.9996 |
Table 4.
Confusion Matrix of the CatBoost diagnosis model's performance on the training set.
| 437 | 1 |
| 0 | 1302 |
Since the performance of the CatBoost26 model is perfect on the validation set, in order to eliminate the possibility that our results are based on the random split, and we would like to have a better understanding of the robustness of our model, we randomly split, 96 more times, the data in train and validation sets (80%/20%) and we run 10 fold cross validation on the train set and we apply on the validation set. The Table 9 shows the descriptive statistics of the performance of the CatBoost26 of the total 97 random splits.
Table 9.
Descriptive statistics of the performance of CatBoost26 on 97 random splits in train and validation sets using 10 fold cross validation on the training set.
| spec_test | sens_test | roc_test | f1_test | spec_cv10 | sens_cv10 | roc_cv10 | f1_cv10 | |
|---|---|---|---|---|---|---|---|---|
| mean | 0.9966 | 0.9995 | 0.9987 | 0.9992 | 0.9962 | 0.9990 | 0.9978 | 0.9988 |
| std | 0.0065 | 0.0017 | 0.0030 | 0.0016 | 0.0025 | 0.0006 | 0.0010 | 0.0005 |
| min | 0.9730 | 0.9906 | 0.9818 | 0.9906 | 0.9908 | 0.9969 | 0.9950 | 0.9973 |
| 25% | 1.0000 | 1.0000 | 0.9978 | 0.9978 | 0.9953 | 0.9985 | 0.9973 | 0.9985 |
| 50% | 1.0000 | 1.0000 | 1.0000 | 1.0000 | 0.9956 | 0.9993 | 0.9977 | 0.9988 |
| 75% | 1.0000 | 1.0000 | 1.0000 | 1.0000 | 0.9977 | 0.9992 | 0.9985 | 0.9992 |
| max | 1.0000 | 1.0000 | 1.0000 | 1.0000 | 1.0000 | 1.0000 | 0.9996 | 0.9996 |
From Figure 2, Figure 3 we observe that the probe set: 234632_x_at, which is a cDNA capturing a RNA molecule, is the most important probe set as regards both, the predictability of the CatBoost and the loss function change.
Our CatBoost34 model is transcriptomic platform agnostic [13] since the label if a data instance comes either from Affymetrix Human Genome U133 Plus 2.0 microarray or the Affymetrix Human Genome U133A microarray or the Affymetrix Human Genome U133B microarray, has not been used as feature. This helps in the robustness and universality of our model's application in the diagnosis of AML. As regards the diagnosis model CatBoost26, all the data instances comes from the Affymetrix Human Genome U133 Plus 2.0.
From Fig. 2 we observe that the first 8 probe sets have the highest impact on the predictability of CatBoost26, including 6 named genes {GATA3, BEX5, DSG2, SLC46A3, SH2D3A, CEACAM3}, 1 uncharacterized gene {LOC101926907} and 1 cDNA probe set. The first probe set has remarkably high feature importance compared to the others, more than 4 times higher. To the best of our knowledge these genes have not been associated to AML yet. The gene GATA3 has been associated to acute lymphoblastic leukemia [54] and other types of cancer as well breast cancer [55], bladder cancer [56]; the gene DSG2 is implicated in various kinds of cancer including cervical cancer [58], epithelial-derived carcinomas [59], pancreatic cancer [60], breast cancer [61], colon cancer [62], lung cancer [63], [64], gastric cancer [65], [66], ovarian cancer [67], laryngeal cancer [68] and liver cancer [69]. In addition, SLC46A3 is associated to liver cancer [70] and BEX5, SH2D3A, CEACAM3 have not been associated to any type of cancer yet.
In Fig. 3 we observe that the first 11 probe sets have the highest importance of loss function change of CatBoost26, including 10 named genes {GATA3, BEX5, DSG2, SLC46A3, FAM153A, FAM153B, FAM153C, PATL2, CEACAM3, MAL}, 3 uncharacterized genes {LOC101926907, LOC100507387, LOC105377751}, 1 expressed sequence tag and 1 cDNA probe set. The 234632_x_at probe set, which binds to LOC653117, has at least 4 times higher feature importance than the 210789_x_at, while 230527_at is approximately 3 times more important feature than 210789_x_at. Moreover, the gene MAL has been associated to gastric cancer [72], breast cancer [73], ovarian cancer [74] and colorectal cancer [75]. The genes {PATL2, FAM153A, FAM153B, FAM153C} have not been associated to any type of cancer yet.
Following similar approach with in total 97 random splits, different from the 97 random splits where we applied CatBoost26 In order to reduce the impact of randomness on the initial split of the dataset to train and validation, we applied 96 more random splits, different from the 96 random splits where we applied CatBoost26. The performance of CatBoost16 on the 97 random splits is similar to the performance of CatBoost26 both on the test and using 10 fold cross validation. The descriptive statistics can be found in Table 10.
Table 10.
Descriptive statistics of the performance of CatBoost16 on 97 random splits in train and validation sets using 10 fold cross validation on the training set.
| spec_test | sens_test | roc_test | f1_test | spec_cv10 | sens_cv10 | roc_cv10 | f1_cv10 | |
|---|---|---|---|---|---|---|---|---|
| mean | 0.9870 | 0.9990 | 0.9963 | 0.9973 | 0.9877 | 0.9980 | 0.9949 | 0.9969 |
| std | 0.01267 | 0.0025 | 0.0044 | 0.0025 | 0.0035 | 0.0008 | 0.0013 | 0.0007 |
| min | 0.9545 | 0.9863 | 0.9737 | 0.9886 | 0.9798 | 0.9961 | 0.9920 | 0.9953 |
| 25% | 0.9833 | 1.0000 | 0.9939 | 0.9956 | 0.9844 | 0.9977 | 0.9942 | 0.9965 |
| 50% | 0.9868 | 1.0000 | 0.9977 | 0.9978 | 0.9871 | 0.9977 | 0.9951 | 0.9969 |
| 75% | 1.0000 | 1.0000 | 1.0000 | 1.0000 | 0.9909 | 0.9985 | 0.9958 | 0.9973 |
| max | 1.0000 | 1.0000 | 1.0000 | 1.0000 | 0.9934 | 1.0000 | 0.9977 | 0.9985 |
5. Related work
The first machine learning approach on a subset of the dataset of 3374 individuals with the 44754 probe sets, has been done in [3]. Statistical methods have been used in order to reduce the dimensionality of the dataset, which dropped down to 984 probe sets. Here we trained the k-NN machine learning model of [3] on the same 80% train set as we did with our four dimensionality reduction CatBoost models, using 10CV. The results, Table 6, shows that the dimensionality reduction CatBoost model, CatBoost34, as well as CatBoost26 and CatBoost16 outperform k-NN (Table 1, Table 2, Table 5).
Using similar to our work data of Affymetrix Human Genome U133A microarray, Affymetrix Human Genome U133 2.0 microarray and Illumina RNA-seq, different machine learning models and statistical learning techniques have been used (k-NN, LASSO, linear discriminant analysis, random forest, linear SVM, polynomial SVM, radial SVM, sigmoid SVM) in [13] in order to predict if an individual has AML or is healthy. The best results regarding the accuracy are the following: 97.6%, 98.0% and 99.1%. These results have been achieved by training and validating the LASSO algorithm on each of the Affymetrix Human Genome U133A microarray, Affymetrix Human Genome U133 2.0 microarray and Illumina RNA-seq datasets accordingly. The first dataset consisted of 2500 data instances from which 1049 (41.96%) were labelled as AML and 1451 (58.04%) as healthy. The second dataset consisted of 8348 data instances from which 2588 (31.00%) were labelled as AML and 5760 (69%) as healthy. Finally, the third dataset consisted of 1181 data instances from which 508 (43.01%) were labelled as AML and 673 (56.99%) as healthy.
The last work related directly to ours is [14] in which using microarrays a deep neural network (DNN) has been trained to classify AML from healthy individuals. The corresponding dataset consisted of only 26 data instances. DNN's accuracy score was 96.67%.
All methods above use datasets from gene expression profiling (GEP) to diagnose AML. Another approach on different type of data like histopathology slides, using machine techniques has a been tried out but the performance of the corresponding model, as regards accuracy, is around 95% [15].
Using invariant cluster genomic signatures a machine learning approach has been developed in [16] for the classification of primary and secondary AML reaching an accuracy score of 97%.
Our method can be used in the classification of diffuse large B-cell lymphoma patients [17] and also in sub-classification of leukaemia [18] since GEP has been used as dataset in both cases.
6. Conclusion
We developed four machine learning models which using CatBoost and gene expression profiling data produced in Affymetrix Human Genome U133A, Affymetrix Human Genome U133B and Affymetrix Human Genome U133 2.0 and samples retrieved from peripheral blood or bone marrow are able to diagnose with the highest performance in literature if an individual has acute myeloid leukaemia or is healthy. We use CatBoost not only as a predictor to our problem, but also as a dimensionality reduction/feature selection technique and information retrieval. In our approach, all the three machine learning models, CatBoost34, CatBoost26 and CatBoost16 outperform other machine learning approaches which use a variety of different classifiers and similar or different datasets.
On the clinical side, we show that the diagnosis of AML could be possible using only 16 probe sets and our model CatBoost16. Our approach as a flowchart can be found in 4. The potential use of our solution could be applicable even in primary care. It would be of great importance to further investigate the role of these 16 probe sets, not only as regards the AML, but also other types of cancer. Machine learning can provide to us different insights from conventional approaches. As regards the explainability part, we hope the scientific community will use the importance of the probe sets shown in Figure 2, Figure 3 in order to explain further their behavior in AML. In addition, from the 16 probe sets some of them have not been yet related to known genes.
Figure 4.
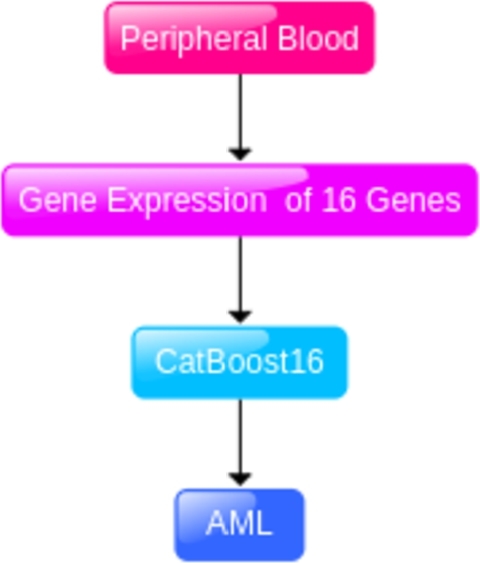
Our approach on the diagnosis of AML using CatBoost16.
Incorporating demographic data such as age, sex, and other can enrich transcriptomic datasets and the problem could be defined as a multriparametric one. Consequently, a comprehensive analysis could be conducted to evaluate the impact of these additional features on the performance of machine learning models, like the CatBoost model.
The current dataset consists of only 20% of the samples representing healthy individuals. Such an imbalance could pose a significant challenge for the development of robust and reliable machine learning models, especially given that in clinical settings, we typically encounter a large number of healthy individuals compared to a relatively small cohort of AML patients. Even though the dataset is imbalanced the performance scores of our machine learning models show the robustness of their applicability to the general population. Future studies could enrich the dataset with a more representative sample of healthy individuals to enhance the model's utility and reliability in real-world applications.
Acute myeloid leukaemia can appear suddenly to anyone. The importance of a screening tool where its sensitivity and specificity is close to 1.00, where the sample source is peripheral blood and the cost is low, it would have a tremendous impact to humanity.
CRediT authorship contribution statement
Athanasios Angelakis: Writing – review & editing, Writing – original draft, Visualization, Validation, Supervision, Software, Project administration, Methodology, Investigation, Formal analysis, Data curation, Conceptualization. Ioanna Soulioti: Visualization, Software, Formal analysis, Data curation. Michael Filippakis: Visualization, Software, Formal analysis.
Declaration of Competing Interest
The authors declare that they have no known competing financial interests or personal relationships that could have appeared to influence the work reported in this paper.
Contributor Information
Athanasios Angelakis, Email: a.angelakis@amsterdamumc.nl.
Ioanna Soulioti, Email: ioannasoul@biol.uoa.gr.
Michael Filippakis, Email: mfilip@unipi.gr.
Data availability
Data associated with this study has been deposited at https://doi.org/10.5281/zenodo.3257786.
References
- 1.Short N.J., Rytting M.E., Cortes J.E. Acute myeloid leukaemia. Lancet. 2018;392(10147):593–606. doi: 10.1016/S0140-6736(18)31041-9. [DOI] [PMC free article] [PubMed] [Google Scholar]
- 2.Mottal N., Issa N., Dumas P.Y., et al. Reduce mortality and morbidity in acute myeloid leukemia with hyperleukocytosis with early admission in intensive care unit: a retrospective analysis. J Hematol. 2020;9(4):109–115. doi: 10.14740/jh691. [DOI] [PMC free article] [PubMed] [Google Scholar]
- 3.Roushangar R., Mias G.I. Multi-study reanalysis of 2,213 acute myeloid leukemia patients reveals age- and sex-dependent gene expression signatures. Sci. Rep. 2019;9(1) doi: 10.1038/s41598-019-48872-0. [DOI] [PMC free article] [PubMed] [Google Scholar]
- 4.Abelson S., Collord G., Ng S.W.K., et al. Prediction of acute myeloid leukaemia risk in healthy individuals. Nature. 2018;559(7714):400. doi: 10.1038/s41586-018-0317-6. [DOI] [PMC free article] [PubMed] [Google Scholar]
- 5.Narayanan D., Weinberg O.K. How I investigate acute myeloid leukemia. Int. J. Lab. Hematol. 2019;42(1):3–15. doi: 10.1111/ijlh.13135. [DOI] [PubMed] [Google Scholar]
- 6.Mosquera Orgueira A., Peleteiro Raíndo A., Cid López M., et al. Personalized survival prediction of patients with acute myeloblastic leukemia using gene expression profiling. Front. Oncol. 2021;11 doi: 10.3389/fonc.2021.657191. [DOI] [PMC free article] [PubMed] [Google Scholar]
- 7.Angelakis A., Gatos I., Theotokas I., et al. A deep-learning approach to the significant liver fibrosis binary classification problem using gender, morphologic and haemodynamic measurements derived from B-mode ultrasound images. Insights Imaging. 2018;9(Suppl 1):S279. doi: 10.1007/s13244-018-0603-8. [DOI] [Google Scholar]
- 8.Angelakis A., Gatos I., Theotokas I., et al. Binary classification of chronic liver disease patients using deep learning on morphologic B-mode and demographic data. AIUM 2018 Annual Convention, S3J. Ultrasound. Med. 2018 doi: 10.1002/jum.14750. [DOI] [Google Scholar]
- 9.Angelakis A. Cats on the classification of benign and malignant breast lesions using ultrasound shear wave elastography features and BI-RADS score. AIUM 2021 Annual ConventionJ. Ultrasound. Med. 2021 doi: 10.1002/jum.15752. [DOI] [Google Scholar]
- 10.Prokhorenkova L., Gusev G., Vorobev A., et al. CatBoost: unbiased boosting with categorical features. Adv. Neural Inf. Process. Syst. 2018;31 [Google Scholar]
- 11.S. Lundberg, S. Lee, A Unified Approach to Interpreting Model Predictions, in: 31st Conference on Neural Information Processing Systems, NIPS 2017.
- 12.Kohavi R. Proceedings of the 14th International Joint Conference on Artificial Intelligence. vol. 2. 1995. A study of cross-validation and bootstrap for accuracy estimation and model selection. [Google Scholar]
- 13.Warnat-Herresthal S., Perrakis K., Taschler B., et al. Scalable prediction of acute myeloid leukemia using high-dimensional machine learning and blood transcriptomics. iScience. 2020;23(1) doi: 10.1016/j.isci.2019.100780. [DOI] [PMC free article] [PubMed] [Google Scholar]
- 14.Nazari E., Farzin A.H., Aghemiri M., Avan A., Tara M., Tabesh H. Deep learning for acute myeloid leukemia diagnosis. J. Med. Life. 2020;13(3):382–387. doi: 10.25122/jml-2019-0090. [DOI] [PMC free article] [PubMed] [Google Scholar]
- 15.Kazemi F., Najafabadi T.A., Araabi B.N. Automatic recognition of acute myelogenous leukemia in blood microscopic images using k-means clustering and support vector machine. J. Med. Signals Sens. 2016;6(3):183–193. [PMC free article] [PubMed] [Google Scholar]
- 16.Awada H., Durmaz A., Gurnari C., et al. Machine learning integrates genomic signatures for subclassification beyond primary and secondary acute myeloid leukemia. Blood. 2021 doi: 10.1182/blood.2020010603. [DOI] [PMC free article] [PubMed] [Google Scholar]
- 17.Zhao S., Dong X., Shen W., et al. Machine learning-based classification of diffuse large B-cell lymphoma patients by eight gene expression profiles. Cancer Med. 2016;5(5):837–852. doi: 10.1002/cam4.650. [DOI] [PMC free article] [PubMed] [Google Scholar]
- 18.Castillo D., Galvez J.M., Herrera L.J., et al. Leukemia multiclass assessment and classification from Microarray and RNA-seq technologies integration at gene expression level. PLoS ONE. 2019;14(2) doi: 10.1371/journal.pone.0212127. [DOI] [PMC free article] [PubMed] [Google Scholar]
- 19.Zatkova A., Merk S., Wendehack M., et al. AML/MDS with 11q/MLL amplification show characteristic gene expression signature and interplay of DNA copy number changes. Genes Chromosomes Cancer. 2009;48(6):510–520. doi: 10.1002/gcc.20658. [DOI] [PubMed] [Google Scholar]
- 20.Tomasson M.H., Xiang Z., Walgren R., et al. Somatic mutations and germline sequence variants in the expressed tyrosine kinase genes of patients with de novo acute myeloid leukemia. Blood. 2008;111(9):4797–4808. doi: 10.1182/blood-2007-09-113027. [DOI] [PMC free article] [PubMed] [Google Scholar]
- 21.Walter M.J., Payton J.E., Ries R.E., et al. Acquired copy number alterations in adult acute myeloid leukemia genomes. Proc. Natl. Acad. Sci. USA. 2009;106(31):12950–12955. doi: 10.1073/pnas.0903091106. [DOI] [PMC free article] [PubMed] [Google Scholar]
- 22.Warren H.S., Elson C.M., Hayden D.L., et al. A genomic score prognostic of outcome in trauma patients. Mol. Med. 2009;15(7–8):220–227. doi: 10.2119/molmed.2009.00027. [DOI] [PMC free article] [PubMed] [Google Scholar]
- 23.Metzeler K.H., Hummel M., Bloomfield C.D., et al. An 86-probe-set gene-expression signature predicts survival in cytogenetically normal acute myeloid leukemia. Blood. 2008;112(10):4193–4201. doi: 10.1182/blood-2008-02-134411. [DOI] [PMC free article] [PubMed] [Google Scholar]
- 24.Wang Y.H., Lin C.C., Hsu C.L., et al. Distinct clinical and biological characteristics of acute myeloid leukemia with higher expression of long noncoding RNA KIAA0125. Ann. Hematol. 2021;100(2):487–498. doi: 10.1007/s00277-020-04358-y. [DOI] [PMC free article] [PubMed] [Google Scholar]
- 25.Wouters B.J., Löwenberg B., Erpelinck-Verschueren C.A.J., et al. Double CEBPA mutations, but not single CEBPA mutations, define a subgroup of acute myeloid leukemia with a distinctive gene expression profile that is uniquely associated with a favorable outcome. Blood. 2009 doi: 10.1182/blood-2008-09-179895. [DOI] [PMC free article] [PubMed] [Google Scholar]
- 26.Taskesen E., Bullinger L., Corbacioglu A., et al. Prognostic impact, concurrent genetic mutations, and gene expression features of AML with CEBPA mutations in a cohort of 1182 cytogenetically normal AML patients: further evidence for CEBPA double mutant AML as a distinctive disease entity. Blood. 2011;117(8):2469–2475. doi: 10.1182/blood-2010-09-307280. [DOI] [PubMed] [Google Scholar]
- 27.Taskesen E., Babaei S., Reinders M.M.J., de Ridder J. Integration of gene expression and DNA-methylation profiles improves molecular subtype classification in acute myeloid leukemia. BMC Bioinform. 2015;16(4):1–8. doi: 10.1186/1471-2105-16-S4-S5. [DOI] [PMC free article] [PubMed] [Google Scholar]
- 28.Figueroa M.E., Wouters B.J., Skrabanek L., et al. Genome-wide epigenetic analysis delineates a biologically distinct immature acute leukemia with myeloid/T-lymphoid features. Blood. 2009;113(12):2795–2804. doi: 10.1182/blood-2008-08-172387. [DOI] [PMC free article] [PubMed] [Google Scholar]
- 29.Klein H.U., Ruckert C., Kohlmann A., et al. Quantitative comparison of microarray experiments with published leukemia related gene expression signatures. BMC Bioinform. 2009;10:1–11. doi: 10.1186/1471-2105-10-422. [DOI] [PMC free article] [PubMed] [Google Scholar]
- 30.Karlovich C., Duchateau-Nguyen G., Johnson A., et al. A longitudinal study of gene expression in healthy individuals. BMC Med. Genom. 2009;2:1–16. doi: 10.1186/1755-8794-2-33. [DOI] [PMC free article] [PubMed] [Google Scholar]
- 31.Kong S.W., Collins C.D., Shimizu-Motohashi Y., et al. Characteristics and predictive value of blood transcriptome signature in males with autism spectrum disorders. PLoS ONE. 2012;7(12) doi: 10.1371/journal.pone.0049475. [DOI] [PMC free article] [PubMed] [Google Scholar]
- 32.Sharma S.M., Choi D., Planck S.R., et al. Insights in to the pathogenesis of axial spondyloarthropathy based on gene expression profiles. Arthritis Res. Ther. 2009;11(6):1–9. doi: 10.1186/ar2855. [DOI] [PMC free article] [PubMed] [Google Scholar]
- 33.Zhou B., Xu W., Herndon D., et al. Analysis of factorial time-course microarrays with application to a clinical study of burn injury. Proc. Natl. Acad. Sci. USA. 2010;107(22):9923–9928. doi: 10.1073/pnas.1002757107. [DOI] [PMC free article] [PubMed] [Google Scholar]
- 34.Li L., Li M., Sun C., et al. Altered hematopoietic cell gene expression precedes development of therapy-related myelodysplasia/acute myeloid leukemia and identifies patients at risk. Cancer Cell. 2011;20(5):591–605. doi: 10.1016/j.ccr.2011.09.011. [DOI] [PMC free article] [PubMed] [Google Scholar]
- 35.Rosell A., Vilalta A., García-Berrocoso T., et al. Brain perihematoma genomic profile following spontaneous human intracerebral hemorrhage. PLoS ONE. 2011;6(2) doi: 10.1371/journal.pone.0016750. [DOI] [PMC free article] [PubMed] [Google Scholar]
- 36.Schmidt S., Rainer J., Riml S., et al. Identification of glucocorticoid-response genes in children with acute lymphoblastic leukemia. Blood. 2006;107(5):2061–2069. doi: 10.1182/blood-2005-07-2853. [DOI] [PubMed] [Google Scholar]
- 37.Lück S.C., Russ A.C., Botzenhardt U., et al. Deregulated apoptosis signaling in core-binding factor leukemia differentiates clinically relevant, molecular marker-independent subgroups. Leukemia. 2011;25(11):1728–1738. doi: 10.1038/leu.2011.154. [DOI] [PubMed] [Google Scholar]
- 38.Xiao W., Mindrinos M.N., Seok J., et al. A genomic storm in critically injured humans. J. Exp. Med. 2011;208(13):2581–2590. doi: 10.1084/jem.20111354. [DOI] [PMC free article] [PubMed] [Google Scholar]
- 39.Li Z., Herold T., He C., et al. Identification of a 24-gene prognostic signature that improves the European LeukemiaNet risk classification of acute myeloid leukemia: an international collaborative study. J. Clin. Oncol. 2013;31(9):1172–1181. doi: 10.1200/JCO.2012.44.3184. [DOI] [PMC free article] [PubMed] [Google Scholar]
- 40.Herold T., Metzeler K.H., Vosberg S., et al. Isolated trisomy 13 defines a homogeneous AML subgroup with high frequency of mutations in spliceosome genes and poor prognosis. Blood. 2014;124(8):1304–1311. doi: 10.1182/blood-2013-12-540716. [DOI] [PubMed] [Google Scholar]
- 41.Kuett A., Rieger C., Perathoner D., et al. IL-8 as mediator in the microenvironment-leukaemia network in acute myeloid leukaemia. Sci. Rep. 2015:1–11. doi: 10.1038/srep18411. [DOI] [PMC free article] [PubMed] [Google Scholar]
- 42.Herold T., Jurinovic V., Batcha A.M.N., et al. A 29-gene and cytogenetic score for the prediction of resistance to induction treatment in acute myeloid leukemia. Haematologica. 2018;103(3):456–465. doi: 10.3324/haematol.2017.178442. [DOI] [PMC free article] [PubMed] [Google Scholar]
- 43.Lauwerys B.R., Hachulla E., Spertini F., et al. Down-regulation of interferon signature in systemic lupus erythematosus patients by active immunization with interferon α-kinoid. Arthritis Rheum. 2013;65(2):447–456. doi: 10.1002/art.37785. [DOI] [PubMed] [Google Scholar]
- 44.Ducreux J., Houssiau F.A., Vandepapelière P., et al. Interferon α-kinoid induces neutralizing anti-interferon α antibodies that decrease the expression of interferon-induced and B cell activation associated transcripts: analysis of extended follow-up data from the interferon α kinoid phase I/II study. Rheumatology. 2016;55(10):1901–1905. doi: 10.1093/rheumatology/kew262. [DOI] [PMC free article] [PubMed] [Google Scholar]
- 45.Clelland C.L., Read L.L., Panek L.J., Nadrich R.H., Bancroft C., Clelland J.D. Utilization of never-medicated bipolar disorder patients towards development and validation of a peripheral biomarker profile. PLoS ONE. 2013;8(6):1–11. doi: 10.1371/journal.pone.0069082. [DOI] [PMC free article] [PubMed] [Google Scholar]
- 46.Opel D., Schnaiter A., Dodier D., et al. Targeting inhibitor of apoptosis proteins by Smac mimetic elicits cell death in poor prognostic subgroups of chronic lymphocytic leukemia. Int. J. Cancer. 2015;137(12):2959–2970. doi: 10.1002/ijc.29650. [DOI] [PubMed] [Google Scholar]
- 47.Lueck S.C., Russ A.C., Botzenhardt U., et al. Smac mimetic induces cell death in a large proportion of primary acute myeloid leukemia samples, which correlates with defined molecular markers. Oncotarget. 2016 doi: 10.18632/oncotarget.10390. [DOI] [PMC free article] [PubMed] [Google Scholar]
- 48.Cao Q., Gearhart M.D., Gery S., et al. BCOR regulates myeloid cell proliferation and differentiation. Leukemia. 2016;30(5):1155–1165. doi: 10.1038/leu.2016.2. [DOI] [PMC free article] [PubMed] [Google Scholar]
- 49.Tasaki S., Suzuki K., Nishikawa A., et al. Multiomic disease signatures converge to cytotoxic CD8 T cells in primary Sjögren's syndrome. Ann. Rheum. Dis. 2017;76(8):1458–1466. doi: 10.1136/annrheumdis-2016-210788. [DOI] [PMC free article] [PubMed] [Google Scholar]
- 50.Tasaki S., Suzuki K., Kassai Y., et al. Multi-omics monitoring of drug response in rheumatoid arthritis in pursuit of molecular remission. Nat. Commun. 2018 doi: 10.1038/s41467-018-05044-4. [DOI] [PMC free article] [PubMed] [Google Scholar]
- 51.Leday G.G.R., Vértes P.E., Richardson S., et al. Replicable and coupled changes in innate and adaptive immune gene expression in two case-control studies of blood microarrays in major depressive disorder. Biol. Psychiatry. 2018;83(1):70–80. doi: 10.1016/j.biopsych.2017.01.021. [DOI] [PMC free article] [PubMed] [Google Scholar]
- 52.Shamir R., Klein C., Amar D., et al. Analysis of blood-based gene expression in idiopathic Parkinson disease. Neurology. 2017;89(16):1676–1683. doi: 10.1212/WNL.0000000000004516. [DOI] [PMC free article] [PubMed] [Google Scholar]
- 53.NCBI Resource Coordinators Database resources of the national center for biotechnology information. Nucleic Acids Res. 2016;44(D1):D7–D19. doi: 10.1093/nar/gkv1290. [DOI] [PMC free article] [PubMed] [Google Scholar]
- 54.Hou Q., Liao F., Zhang S., et al. Regulatory network of GATA3 in pediatric acute lymphoblastic leukemia. Oncotarget. 2017;8(22):36040–36053. doi: 10.18632/oncotarget.16424. [DOI] [PMC free article] [PubMed] [Google Scholar]
- 55.Mehra R., Varambally S., Ding L., et al. Identification of GATA3 as a breast cancer prognostic marker by global gene expression meta-analysis. Cancer Res. 2005;65(24):11259–11264. doi: 10.1158/0008-5472.CAN-05-2495. [DOI] [PubMed] [Google Scholar]
- 56.Li Y., Ishiguro H., Kawahara T., et al. Loss of GATA3 in bladder cancer promotes cell migration and invasion. Cancer Biol. Ther. 2014;15(4):428–435. doi: 10.4161/cbt.27631. [DOI] [PMC free article] [PubMed] [Google Scholar]
- 57.Kazi J.U., Kabir N.N., Rönnstrand L. Brain-expressed X-linked (BEX) proteins in human cancers. Biochim. Biophys. Acta - Rev. Cancer. 2015;1856(2):226–233. doi: 10.1016/j.bbcan.2015.09.001. [DOI] [PubMed] [Google Scholar]
- 58.Qin S., Liao Y., Du Q., et al. DSG2 expression is correlated with poor prognosis and promotes early-stage cervical cancer. Cancer Cell Int. 2020;20(1):1–13. doi: 10.1186/s12935-020-01292-x. [DOI] [PMC free article] [PubMed] [Google Scholar]
- 59.Brennan D., Mahoney M.G. Increased expression of Dsg2 in malignant skin carcinomas: a tissue-microarray based study. Cell Adhes. Migr. 2009;3(2):148–154. doi: 10.4161/cam.3.2.7539. [DOI] [PMC free article] [PubMed] [Google Scholar]
- 60.Hütz K., Zeiler J., Sachs L., et al. Loss of desmoglein 2 promotes tumorigenic behavior in pancreatic cancer cells. Mol. Carcinog. 2017;56(8):1884–1895. doi: 10.1002/mc.22644. [DOI] [PubMed] [Google Scholar]
- 61.Davies E.L., Cochrane R.A., Hiscox S., et al. The role of desmoglein 2 and E-cadherin in the invasion and motility of human breast cancer cells. Int. J. Oncol. 1997;11(2):415–419. doi: 10.3892/ijo.11.2.415. [DOI] [PubMed] [Google Scholar]
- 62.Yang T., Gu X., Jia L., et al. DSG2 expression is low in colon cancer and correlates with poor survival. BMC Gastroenterol. 2021;21(1):1–10. doi: 10.1186/s12876-020-01588-2. [DOI] [PMC free article] [PubMed] [Google Scholar]
- 63.Cai F., Zhu Q., Miao Y., et al. Desmoglein-2 is overexpressed in non-small cell lung cancer tissues and its knockdown suppresses NSCLC growth by regulation of p27 and CDK2. J. Cancer Res. Clin. Oncol. 2017;143(1):59–69. doi: 10.1007/s00432-016-2250-0. [DOI] [PMC free article] [PubMed] [Google Scholar]
- 64.Saaber F., Chen Y., Cui T., et al. Expression of desmogleins 1-3 and their clinical impacts on human lung cancer. Pathol. Res. Pract. 2015;211(3):208–213. doi: 10.1016/j.prp.2014.10.008. [DOI] [PubMed] [Google Scholar]
- 65.Yashiro M., Nishioka N., Hirakawa K. Decreased expression of the adhesion molecule desmoglein-2 is associated with diffuse-type gastric carcinoma. Eur. J. Cancer. 2006;42(14):2397–2403. doi: 10.1016/j.ejca.2006.03.024. [DOI] [PubMed] [Google Scholar]
- 66.Biedermann K., Vogelsang H., Becker I., et al. Desmoglein 2 is expressed abnormally rather than mutated in familial and sporadic gastric cancer. J. Pathol. 2005;207(2):199–206. doi: 10.1002/path.1821. [DOI] [PubMed] [Google Scholar]
- 67.Kim J., Beidler P., Wang H., et al. Desmoglein-2 as a prognostic and biomarker in ovarian cancer. Cancer Biol. Ther. 2020;21(12):1154–1162. doi: 10.1080/15384047.2020.1843323. [DOI] [PMC free article] [PubMed] [Google Scholar]
- 68.Cury S.S., Lapa R.M.L., de Mello J.B.H., et al. Increased DSG2 plasmatic levels identified by transcriptomic-based secretome analysis is a potential prognostic biomarker in laryngeal carcinoma. Oral Oncol. 2020;103 doi: 10.1016/j.oraloncology.2020.104592. [DOI] [PubMed] [Google Scholar]
- 69.Han C.P., Yu Y.H., Wang A.G., et al. Desmoglein-2 overexpression predicts poor prognosis in hepatocellular carcinoma patients. Eur. Rev. Med. Pharmacol. Sci. 2018;22(17):5481–5489. doi: 10.26355/eurrev_201809_15808. [DOI] [PubMed] [Google Scholar]
- 70.Zhao Q., Zheng B., Meng S., et al. Increased expression of SLC46A3 to oppose the progression of hepatocellular carcinoma and its effect on sorafenib therapy. Biomed. Pharmacother. 2019;114 doi: 10.1016/j.biopha.2019.108864. [DOI] [PubMed] [Google Scholar]
- 71.Bateman A., Martin M.J., Orchard S., et al. UniProt: the universal protein knowledgebase in 2021. Nucleic Acids Res. 2021 doi: 10.1093/nar/gkaa1100. Published online. [DOI] [PMC free article] [PubMed] [Google Scholar]
- 72.Buffart T.E., Overmeer R.M., Steenbergen R.D.M., et al. MAL promoter hypermethylation as a novel prognostic marker in gastric cancer. Br. J. Cancer. 2008;99(11):1802–1807. doi: 10.1038/sj.bjc.6604777. [DOI] [PMC free article] [PubMed] [Google Scholar]
- 73.Horne H.N., Lee P.S., Murphy S.K., et al. Inactivation of the MAL gene in breast cancer is a common event that predicts benefit from adjuvant chemotherapy. Mol. Cancer Res. 2009;7(2):199–209. doi: 10.1158/1541-7786.MCR-08-0314. [DOI] [PMC free article] [PubMed] [Google Scholar]
- 74.Lee P.S., Teaberry V.S., Bland A.E., et al. Elevated MAL expression is accompanied by promoter hypomethylation and platinum resistance in epithelial ovarian cancer. Int. J. Cancer. 2010;126(6):1378–1389. doi: 10.1002/ijc.24797. [DOI] [PubMed] [Google Scholar]
- 75.Kalmár A., Péterfia B., Hollósi P., et al. DNA hypermethylation and decreased mRNA expression of MAL, PRIMA1, PTGDR and SFRP1 in colorectal adenoma and cancer. BMC Cancer. 2015;15(1):1–14. doi: 10.1186/s12885-015-1687-x. [DOI] [PMC free article] [PubMed] [Google Scholar]
- 76.Cao Q., Zhao C., Wang C., et al. The recurrent mutation in PATL2 inhibits its degradation thus causing female infertility characterized by oocyte maturation defect through regulation of the Mos-MAPK pathway. Front. Cell Dev. Biol. 2021 doi: 10.3389/fcell.2021.628649. [DOI] [PMC free article] [PubMed] [Google Scholar]
- 77.Peng X., Wen Y., Zha L., et al. TRIM45 suppresses the development of non-small cell lung cancer. Curr. Mol. Med. 2019 doi: 10.2174/1566524019666191017143833. [DOI] [PubMed] [Google Scholar]
- 78.Zhang J., Zhang C., Cui J., et al. Trim45 functions as a tumor suppressor in the brain via its e3 ligase activity by stabilizing p53 through k63-linked ubiquitination. Cell Death Dis. 2017;8(5):1–11. doi: 10.1038/cddis.2017.149. [DOI] [PMC free article] [PubMed] [Google Scholar]
- 79.Raiser D.M., Narla A., Ebert B.L. The emerging importance of ribosomal dysfunction in the pathogenesis of hematologic disorders. Leuk. Lymphoma. 2014;55(3):491–500. doi: 10.3109/10428194.2013.812786. [DOI] [PubMed] [Google Scholar]
- 80.De Keersmaecker K., Atak Z.K., Li N., et al. Exome sequencing identifies mutation in CNOT3 and ribosomal genes RPL5 and RPL10 in T-cell acute lymphoblastic leukemia. Nat. Genet. 2013;45(2):186–190. doi: 10.1038/ng.2508. [DOI] [PMC free article] [PubMed] [Google Scholar]
- 81.Shi J., Zhang L., Zhou D., et al. Biological function of ribosomal protein L10 on cell behavior in human epithelial ovarian cancer. J. Cancer. 2018;9(4):745–756. doi: 10.7150/jca.21614. [DOI] [PMC free article] [PubMed] [Google Scholar]
- 82.Yang J., Chen Z., Liu N., et al. Ribosomal protein L10 in mitochondria serves as a regulator for ROS level in pancreatic cancer cells. Redox Biol. 2018;19:158–165. doi: 10.1016/j.redox.2018.08.016. [DOI] [PMC free article] [PubMed] [Google Scholar]
- 83.Manfrini N., Mancino M., Miluzio A., et al. FAM46C and FNDC3A are multiple myeloma tumor suppressors that act in concert to impair clearing of protein aggregates and autophagy. Cancer Res. 2020;80(21):4693–4706. doi: 10.1158/0008-5472.CAN-20-1357. [DOI] [PubMed] [Google Scholar]
- 84.Obholz K.L., Akopyan A., Waymire K.G., et al. FNDC3A is required for adhesion between spermatids and Sertoli cells. Dev. Biol. 2006;298(2):498–513. doi: 10.1016/j.ydbio.2006.06.054. [DOI] [PMC free article] [PubMed] [Google Scholar]
- 85.Farfsing A., Engel F., Seiffert M., et al. Gene knockdown studies revealed CCDC50 as a candidate gene in mantle cell lymphoma and chronic lymphocytic leukemia. Leukemia. 2009;23(11):2018–2026. doi: 10.1038/leu.2009.144. [DOI] [PubMed] [Google Scholar]
- 86.Ozaki K., Nagata M., Suzuki M., et al. Isolation and characterization of a novel human pancreas-specific gene, pancpin, that is down-regulated in pancreatic cancer cells. Genes Chromosomes Cancer. 1998;22(3):179–185. doi: 10.1002/(SICI)1098-2264(199807)22:3%3C179::AID-GCC3%3E3.0.CO;2-T. [DOI] [PubMed] [Google Scholar]
- 87.Tota G., Coccaro N., Zagaria A., et al. ADAMTS2 gene dysregulation in T/myeloid mixed phenotype acute leukemia. BMC Cancer. 2014;14(1):1–6. doi: 10.1186/1471-2407-14-963. [DOI] [PMC free article] [PubMed] [Google Scholar]
- 88.Jiang C., Zhou Y., Huang Y., et al. Overexpression of ADAMTS-2 in tumor cells and stroma is predictive of poor clinical prognosis in gastric cancer. Hum. Pathol. 2019;84:44–51. doi: 10.1016/j.humpath.2018.08.030. [DOI] [PubMed] [Google Scholar]
- 89.Roemer A., Schwettmann L., Jung M., et al. The membrane proteases ADAMs and hepsin are differentially expressed in renal cell carcinoma. Are they potential tumor markers? J. Urol. 2004;172(6 I):2162–2166. doi: 10.1097/01.ju.0000144602.01322.49. [DOI] [PubMed] [Google Scholar]
- 90.Laukkanen S., Liuksiala T., Nykter M., et al. Identification of novel drug targets in T-cell acute lymphoblastic leukemia. Blood. 2015;126(23):3646. doi: 10.1182/blood.v126.23.3646.3646. [DOI] [Google Scholar]
- 91.Wassenaar C.A., Dong Q., Wei Q., et al. Relationship between CYP2A6 and CHRNA5-CHRNA3-CHRNB4 variation and smoking behaviors and lung cancer risk. J. Natl. Cancer Inst. 2011;103(17):1342–1346. doi: 10.1093/jnci/djr237. [DOI] [PMC free article] [PubMed] [Google Scholar]
Associated Data
This section collects any data citations, data availability statements, or supplementary materials included in this article.
Data Availability Statement
Data associated with this study has been deposited at https://doi.org/10.5281/zenodo.3257786.