

Abstract
The oral tyramine challenge evaluates the safety of novel monoamine oxidase (MAO) inhibitors when taken with tyramine‐containing food or drinks. In its current design, it comprises an extensive series of tyramine escalation steps until a blood pressure threshold is met. Due to the high variation in tyramine bioavailability, and thereby in blood pressure effect, this classical design has various limitations, including safety concerns. Based on data from a previously performed tyramine challenge study, the present study explored a reduced new design that escalates up to 400 mg, and evaluates the dose to a tyramine peak plasma concentration of ≥10 ng/mL, instead of a dose up to 800 mg, and to a blood pressure change of ≥30 mm Hg. Tested by trial simulation, the new design proves more efficient than the classical design in terms of better identifying tyramine sensitivity of test and reference treatments and reducing false‐positive and false‐negative rates in estimating tyramine sensitivity by more than 10‐fold. Since it escalates over a lower tyramine dose range, the new design reduces risk to subjects associated with tyramine‐induced blood pressure excursions, is less demanding for study participants, and is more efficient. By its focus on tyramine bioavailability as the primary concern for novel MAO inhibitors, the new tyramine challenge study provides better answers in a simplified and safer design compared with the classical design in trial simulation, warranting its use in future clinical studies.
Abbreviations
- AUC
area under the concentration‐time curve
- CFB SBP
change in systolic blood pressure from baseline (pre‐dose)
- CI
confidence interval
- C max
tyramine peak plasma concentration
- CVinter
between‐subject coefficient of variation
- gmean
geometric mean
- Hg
mercury
- ICH
International Council for Harmonisation of Technical Requirements for Pharmaceuticals for Human Use (ICH)
- MAO
monoamine oxidase
- max
maximum value
- min
minimum value
- Q1–3
quadrupole filter 1, 2, or 3
- SBP
systolic blood pressure
- TSF
tyramine sensitivity factor
- TSF30
tyramine sensitivity factor, defined as the ratio of TYR30 at baseline (Period 1) over TYR30 during treatment (Period 3)
- TSFC10
tyramine sensitivity factor, defined as the ratio of TYRC10 at baseline (Period 1) over TYRC10 during treatment (Period 3)
- TSFCx
tyramine sensitivity factor, defined as the ratio of TYRCx at baseline (Period 1) over TYRCx during treatment (Period 3)
- TYR30
oral tyramine dose leading to an increase of systolic blood pressure of at least 30 mm Hg compared with baseline
- TYRC10
oral tyramine dose leading to a tyramine peak plasma concentration of 10 ng/mL
- TYRCx
oral tyramine dose leading to a tyramine peak plasma concentration of × ng/mL
STUDY HIGHLIGHTS.
WHAT IS THE CURRENT KNOWLEDGE ON THE TOPIC?
The classical oral tyramine challenge of novel monoamine oxidase (MAO) inhibitors comprises an extensive series of tyramine escalation steps, with and without the experimental therapy, until a blood pressure threshold is met. Due to high variation in tyramine bioavailability and effect, this design has various limitations.
WHAT QUESTION DID THIS STUDY ADDRESS?
This study tested a new tyramine challenge design that escalates over a lower tyramine range, and evaluates the dose to a tyramine peak concentration, instead of a dose to a blood pressure threshold change.
WHAT DOES THIS STUDY ADD TO OUR KNOWLEDGE?
Compared with the classical design, the new design is more accurate in the cases studied, with over 10‐fold reduced false‐positive and false‐negative rates in estimating tyramine sensitivity. It reduces risk of tyramine‐induced blood pressure excursions, and requires fewer escalations.
HOW MIGHT THIS CHANGE CLINICAL PHARMACOLOGY OR TRANSLATIONAL SCIENCE?
By focusing on oral tyramine bioavailability as the primary concern for novel MAO inhibitors, the new tyramine challenge study design provides better answers in a simplified, more efficient, and safer design. Results warrant its consideration for future tyramine challenges.
INTRODUCTION
Monoamine oxidases (MAOs) are enzyme family members catalyzing the oxidation of monoamines, with two isoforms identified to date, being MAO‐A and MAO‐B. 1 , 2 , 3 MAO inhibition is an established mechanism of action in the treatment of depression and Parkinson's disease, with potential in further neurodegenerative and neuropsychiatric indications, as in other therapeutic areas like prevention of cardiac ageing. 3 , 4
The biogenic amine tyramine is a constituent of various foods; if systemically present, it may increase blood pressure substantially. Under normal physiological conditions, humans are protected against tyramine from food due to highly effective pre‐systemic first‐pass metabolism of tyramine. The oral bioavailability of tyramine has been estimated at less than 1%, with large between‐subject variability in tyramine exposure and in blood pressure response. 5 , 6 Since tyramine is a substrate both for MAO‐A and MAO‐B, MAO inhibitors may reduce intestinal and/or hepatic first‐pass metabolism of tyramine, causing potentially harmful increases in blood pressure. 7 , 8 To address that risk, the downstream effect of oral tyramine in combination with a MAO inhibitor on blood pressure (‘tyramine challenge’) has been, or is being, evaluated for various investigational drugs (e.g., for rasagiline, tedizolid, safinamide, and ozanimod). 9 , 10 , 11 , 12 This is despite the fact that today's validity of the concern may be challenged, given the steady decline in tyramine content in food with the improvement of production methodologies in recent years, as pointed out by Gillman. 8
The oral tyramine challenge essentially differs from any standard drug–drug interaction study in terms of its endpoint being a tyramine dose leading to a predefined blood pressure change; the blood pressure change itself is not a study end point. The typical challenge design comprises a baseline period in which every subject receives escalating single oral doses of tyramine until a threshold systolic blood pressure (SBP) change versus baseline of 30 mmHg or more is hit; the tyramine dose at that threshold is called the TYR30 (Figure 1a). After this baseline assessment, test, positive control, or placebo treatment is initiated with randomization, and the TYR30 assessment is repeated when the test and reference treatments are expected to have reached pharmacokinetic steady state. If test or reference treatment increases tyramine bioavailability compared with baseline in the same subject, the TYR30 on treatment is a lower dose than the TYR30 at baseline. The ratio of TYR30 at baseline over TYR30 at treatment is called the tyramine sensitivity factor (TSF). When theoretically assuming negligible within‐subject variation between periods, a TSF of 2 implies that tyramine bioavailability in that subject has doubled on treatment compared with baseline. In each randomized treatment group the TSF is calculated for all available patients and the distributions are compared across treatments. The primary objective of the classical tyramine challenge study is to estimate the average TSF for the test treatment in comparison with that for the reference and the active and placebo controls in order to assess possible risks of tyramine interaction for the novel test treatment. This is done by assessing the TSF distribution across subjects and presenting it per treatment, with summary descriptive statistics (e.g., average TSF, median, quartiles, etc.). Formal statistical hypothesis tests for interaction or for direct comparison with the reference treatment or controls are not typically used in the classical challenge study, as the estimation objective is prioritized.
FIGURE 1.
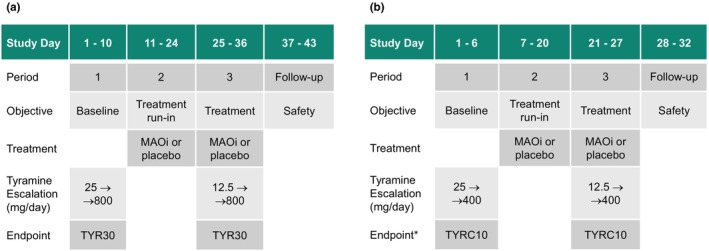
Schematic of a typical example of a classical tyramine challenge study for a monoamine oxidase inhibitor (MAOi) or placebo with tyramine escalation to a dose with a change in systolic blood pressure from baseline (CFB SBP) ≥30 mm Hg (TYRC30) or to 800 mg of tyramine (a), and the new design with escalation to 400 mg of tyramine, to estimate the dose with tyramine peak plasma concentration (C max) ≥10 ng/mL (TYRC10) off‐line after completing escalation (b). *Also in the new design, escalation will be stopped when a subject meets a predefined CFB SBP criterion to mitigate risk. Sample sizes of 12–18 subjects per treatment are typically used in the classical design (a); a sample of 16 subjects per treatment is proposed for the new design (b).
One key characteristic of the oral tyramine challenge is that it estimates a tyramine dose that meets a SBP criterion. It does not attempt to estimate any pharmacodynamic or pharmacokinetics end points like SBP, tyramine area under the concentration–time curve (AUC), or tyramine peak plasma concentration (C max), as that would require unrealistic study sample sizes due to very high between‐ and within‐subject variability in these end points. One downside of the oral tyramine challenge is the poor predictability of the extent of SBP change, since minor variations in tyramine first‐pass clearance can cause major changes in systemic tyramine levels and in downstream pressor response. As a consequence, SBP excursions very much above 30 mm Hg may occur in an uncontrolled manner, exposing study participants to a potential risk. A case report referred to hypertensive episodes of more than 60 mm Hg over baseline in 35 of 179 participants (20%) in an oral tyramine challenge study, observed after oral tyramine doses in the range of 100–500 mg. 13 In 5 of these 35 subjects, subendocardial ischemia was reported, presenting as tall, hyper‐acute symmetrical T‐waves, with or without other electrocardiograph abnormalities or angina symptoms, with prolonged PR interval and a 20‐fold increase of troponin T level over the normal reference level in one subject. Cantarini et al. reported sinus bradycardia and a third‐degree heart block in one subject out of a group of 12 study participants receiving systemically delivered tyramine. 14 To mitigate safety risk during tyramine dose escalation when done in combination with active treatment, tyramine escalations typically start at lower tyramine dose levels, compared with the baseline escalation. Alongside the safety aspect, a further downside of the current oral tyramine challenge is that it addresses impact on tyramine bioavailability not by measuring tyramine bioavailability itself, but by evaluating a downstream effect of tyramine (i.e., change in SBP). By using this indicator of tyramine bioavailability, the current oral tyramine challenge adds variation in pharmacodynamic response on top of pharmacokinetic variability. Also, any pharmacodynamic effect of the test treatment itself may – in theory – counteract or enhance the effect of tyramine on blood pressure, thereby obscuring the interpretation of the TSF.
Based on the considerations above, the present work explores a reduced and refined oral tyramine challenge design that focuses on the point of primary concern, that is, the increase of tyramine bioavailability due to MAO inhibition, operating at lower tyramine dose levels to reduce safety risk. This alternative design replaces, with a C max target, the SBP target that is secondary to tyramine exposure and subject to confounding factors like stress, and that adds pharmacodynamic variation which may lead to overshooting the SBP target with potential risk to the study participant.
METHODS
General approach
The present study explored a reduced new challenge study design that escalates up to 400 mg of oral tyramine, instead of a dose up to 800 mg as in the classical design. It evaluates the dose to a tyramine peak plasma concentration threshold, assessed off‐line after completing escalation, as an alternative to the dose to a blood pressure change of ≥30 mm Hg in the classical design (Figure 1b). Also in the new design, escalation in the individual subject is stopped when a blood pressure limit is reached, to mitigate risk.
The development of the new challenge study design focused on tyramine exposure consisting of two sequential steps, namely (1) the retrospective analysis of an earlier performed TYR30‐focused classical oral tyramine challenge study that included extensive blood sampling for the assessment of tyramine, and (2) trial simulation to test the tyramine C max criterion retrospectively identified in step, (1) in comparison to the conventional SBP change from baseline (CFB SBP) criterion.
Retrospective evaluation of active‐ and placebo‐controlled oral tyramine challenge with TYR30 target
A retrospective analysis of pressor response and tyramine exposure in relation to oral tyramine dosing was performed on an earlier executed classical double‐blind, placebo‐ and active‐controlled, randomized, oral tyramine challenge study in seven groups of healthy male or female study participants (Figure 1a). The active control group consisted of 16 participants, receiving phenelzine (15 mg three times daily for 14 days) as open‐label treatment. The remaining six blinded groups consisted of 24 participants each, 16 on active drug treatment and 8 on placebo in each group. Active treatment in the respective blinded groups consisted of selegiline comparator treatment (5 mg twice daily for 14 days) in one group, and an experimental MAO inhibitor at different dosing regimens dosed up to 30 days in the remaining five groups. Prior to each tyramine dosing, a stable SBP reading (mean of three consecutive values over 5‐min intervals) was obtained in a 35‐min period. As from 5 min after tyramine administration, supine blood pressure was measured approximately every 5 min for at least 2 h and then approximately every 15 min for an additional 2 h. The primary outcome measure of the study was the TYR30, defined as the tyramine dose associated with an increase in SBP of ≥30 mm Hg maintained for at least three consecutive measurements in a period of 10 min or more, assessed relative to the mean value of repeated, stable SBP readings pre‐dose.
The clinical study protocol, protocol amendments, and the informed consent forms were reviewed and approved by an independent ethics committee (the Stichting Beoordeling Ethiek Bio‐Medisch Onderzoek, Assen, The Netherlands). The study was conducted in accordance with the principles of the Declaration of Helsinki including amendments, and with the International Council on Harmonisation (ICH) E6 Guideline for Good Clinical Practice (GCP) (Committee for Proprietary Medicinal Products [CPMP] guideline CPMP/ICH/135/95), and was compliant with the European Union Clinical Trial Directive (EU CTD): Directive 2001/20/EC. Further details on the execution of the previously performed challenge study are provided in Appendices S3 and S4.
Simulation study of oral tyramine challenge study with CFB SBP and C max targets
A simulation study was designed and executed to determine whether the tyramine dose at which C max is ≥ x ng/mL (TYRCx) can be used as an alternative to TYR30 in estimating the impact of MAO inhibitors on the oral bioavailability of tyramine. A number of values of TSF were assumed to evaluate the performance of the proposed design under a range of possible scenarios for the impact of test treatment on tyramine availability; TSF = 1 for placebo, TSF = 2 for selegiline, and five test treatments with theoretical ‘true’ TSF values of 1, 1.5, 2, 4, and 5, in which the test treatment with TSF = 1 represents a treatment not affecting tyramine availability.
The specific objectives of this simulation study were to compare new and classical designs, and to explore the following for a range of values of x (C max cutoff) and n (sample size per cohort), for each assumed true value of TSF:
Estimates of simulated TSF30 (classical design result), that is, the ratio of TYR30 in Period 1 over Period 3, and of TSFC10 (new design result), determined by ratios of doses with C max ≥10 ng/mL (TYRC10) over both periods (Figure 1);
The proportion of confidence intervals for the estimates of TSF30 and TSFCx that contain 1, the proportion that contain 2, and the proportion wholly above 2, the latter indicating an unacceptable increase of tyramine sensitivity;
The number of tyramine doses required, and study duration, for each of simulated TSFCx and TSF30; and
The number of subjects excluded from the estimation of TSF because they did not experience a C max of x ng/mL during Period 1 in the new design with a reduced maximum tyramine dose.
To achieve these objectives, this work comprised the following sequential steps:
Step 1: Evaluation of the statistical distributions of CFB SBP and C max in subjects receiving oral tyramine at each dose of 50–800 mg in the completed clinical study above, for use in simulating data;
Step 2: Simulation of a single dataset with 1000 subjects per treatment group to evaluate the statistical distributions of TSF30 and TSFC10; and
Step 3: Simulations of TSF30 and TSFCx based on Step 2, (1) per current (classical) design with tyramine escalation from 25 to 800 mg as above, with the CFB SBP criteria (and separately with the C max criteria) and (2) with the proposed new design with the C max criteria, escalating to 400 mg (Figure 1b), with further assumptions as per Table S1.
We note that the classical design with the C max criteria in Step 3 (1) is not an approach that could be taken in practice. Stopping tyramine dose escalation based on C max would require real‐time assessment of tyramine plasma levels, which is not feasible. The inclusion of these simulations is for illustration only, and it is the new design in Step 3 (2) that is of primary interest.
In Step 3, multivariate data were simulated, allowing for correlation between C max and CFB SBP, correlation between CFB SBP in Periods 1 and 3, and correlation between C max in Periods 1 and 3. Based on Step 1 above, C max was assumed to be log‐normally distributed; CFB SBP was assumed to be normally distributed. Mean and variance estimates were obtained from the retrospective analysis of the completed study reviewed above. Simulations were performed in R 4.1.1 using RStudio; for each scenario, 10,000 simulations were run. The in‐built random number generator was used, with starting seed of 150,822. Full details on the simulation methods are provided elsewhere (Simulation Report, section 4, available on request).
RESULTS
Retrospective evaluation of active‐ and placebo‐controlled oral tyramine challenge with TYR30 target
In the retrospectively evaluated, completed challenge study of classical design, median C max values of orally dosed tyramine, administered in baseline Period 1, or on placebo treatment in Period 3, appeared to increase in relation to the dose, with the note that between‐subject variation proved very substantial; at each tyramine dose level up to 800 mg, values below quantification level were observed, and the between‐subject coefficient of variation (CVinter) in C max was at least 67%, up to above 200% (Table S2).
Subjects receiving placebo in Period 3 provided the opportunity to assess within‐subject variation in C max, when comparing data with the same subject receiving the same tyramine dose in baseline Period 1. Within‐subject variation in C max was very substantial again, and C max values differed 10‐fold or more between two periods within the same subject (Figure 2a). Within‐subject variation in CFB SBP was also substantial; the median differences in maximum CFB SBP between periods were 0–10 mm Hg over the full tyramine dose range, but within‐subject differences in SBP of up to 68 mm Hg were observed (Figure 2b).
FIGURE 2.
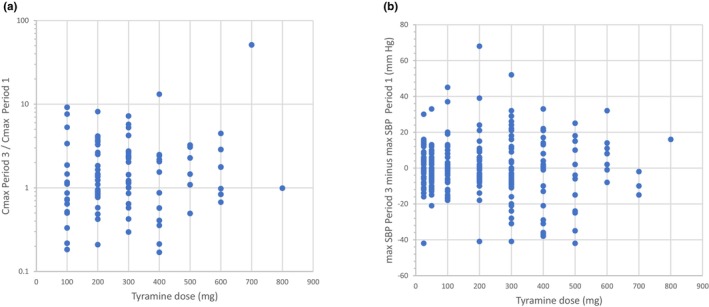
Within‐subject variation in oral tyramine exposure and response; ratio of tyramine peak plasma concentration (C max) on placebo treatment (Period 3) over C max during baseline (Period 1) (a), and difference in maximum change in systolic blood pressure (SBP) from baseline between both periods (b), in individual subjects receiving oral tyramine doses escalating from 100 mg to 800 mg. Samples sizes vary from n = 1 (800 mg) to n = 45 (200 mg).
The blood pressure response at baseline Period 1 showed a sigmoidal dose–response relation when expressed as median CFB SBP from baseline. Between‐subject variation in CFB SBP versus baseline was substantial however, varying from negligible up to beyond 100 mm Hg between subjects, without any obvious relation with the dose (Table S3; Figure S1).
Integrating pharmacokinetics and pharmacodynamics by analyzing CFB SBP in relation to tyramine C max for all subjects with available datapoints (i.e., subjects at baseline, and on placebo or active treatment) showed that the likelihood of a CFB SBP greater than or equal to 30 mm Hg increased with C max (Figure 3). It is noted that CFB SBP ≥30 mm Hg were observed even in the lowest peak concentration ranges, that is, in 18% of subjects with C max up to 10 ng/mL, and rates increase with C max (Figure 3). When separating the data at baseline (Period 1) and placebo treatment (Period 3) from active reference treatments with phenelzine and selegiline in Period 3, the fraction of subjects with a ≥30 mm Hg CFB SBP showed a steeper increase on active treatment, compared with tyramine challenge without active treatment (Figure 3).
FIGURE 3.
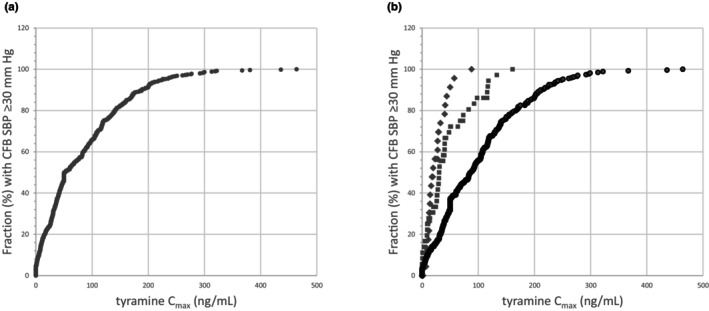
(a) Cumulative plot of fraction of subjects showing a ≥30 mm Hg change in systolic blood pressure from baseline (CFB SBP) versus the tyramine peak plasma concentration (C max) in these subjects, after oral tyramine challenge at baseline (Period 1) and during treatment with active or placebo treatment (Period 3); datapoints decline from n = 437 in the lowest 0–5 ng/mL range, to n = 8 in the range of 300–500 ng/mL. (b) Cumulative plot as per (a), separating active treatment with selegiline (squares) and phenelzine (diamonds) in Period 3 from baseline Period 1 and placebo treatment in Period 3 (dots).
Given the high within‐subject variation in C max (Figure 2a), we explored whether the dose to a predefined C max would be an informative alternative to measuring exposure itself. Since a tyramine C max of 10 ng/mL is at least 20‐fold above the baseline level in humans, 5 only reached with an oral tyramine dose exceeding 25 mg (Table S2), it was considered a suitable exposure criterion, well‐separated from background levels, carrying a low risk of an exaggerated blood pressure response (Figure 3). Retrospectively applying the ‘dose to C max ≥10 ng/mL’ as the tyramine sensitivity criterion resulted in a consistent median dose level of 200 mg at baseline, which was reduced two‐ to eight‐fold on active reference or test treatment (Table S4). Median TSF30 values and ratios of doses to C max ≥10 ng/mL in Period 1 over Period 3 (TSFC10) were mutually consistent within a factor of 2, with the exception of phenelzine that showed a larger TSF30 than reflected by the doses required to produce a C max ≥10 ng/mL on that active treatment (Table S4). The data illustrate the conceptual difference between C max as a conventional pharmacokinetic end point by itself, versus the concept of the dose (that produces a prespecified C max) as end point in the proposed new challenge model. The tyramine challenge escalates over a tyramine dose range, and in that range the median dose with a C max ≥10 ng/mL is 200 mg in the baseline period (Table S4). At an isolated 200 mg dose, however, the average and median C max values are 32.7 and 24.7 ng/mL, whilst individual values range from undetectable to 211 ng/mL (Table S2).
Simulation study of oral tyramine challenge study with CFB SBP and tyramine C max targets
Simulated data in 1000 subjects per treatment in Step 1 showed a right‐skewed distribution both for TSF30 and TSFC10 (Simulation Report, section 3, available on request). Kurtosis skewness plots and goodness‐of‐fit statistics supported the assumption of log‐normal distribution of TSF30 and TSFC10, implying that the relevant summary statistic for reporting these tyramine challenge effect parameters is the geometric mean rather than the arithmetic mean.
The CFB SBP ≥30 mm Hg criterion and the C max ≥10 ng/mL criterion were compared in the classical design with escalation up to 800 mg of tyramine by running 10,000 simulations for each criterion in a sample of n = 12 subjects per treatment group. Focusing on the intention to detect a 100% increase of the TSF for a test treatment in comparison with placebo (TSF = 1), a TSF ≥2 was considered of relevance. Since the purpose of the tyramine challenge study is to estimate TSF, the confidence intervals for the estimate of geometric mean TSF were calculated; confidence intervals that contain 1 indicate that a ‘true’ TSF of 1 cannot be ruled out, those that contain 2 indicate that a ‘true’ TSF of 2 cannot be ruled out, and any wholly above 2 suggest that the ‘true’ TSF is above 2. The percentage of confidence intervals meeting each of these criteria, along with the geometric means of the TSFs estimated for all treatments by both criteria, are given in Table 1.
TABLE 1.
Simulation results (10,000 simulations, with n = 12 per treatment) for TSF30 and for TSFC10 in the classical tyramine challenge escalating to 800 mg of tyramine, applied to placebo treatment and different active treatments with their indicated ‘true’ tyramine sensitivity factor (TSF).
| Treatment | TSF | Mean (gmean) | 95% CIs incl. 1 (%) | 95% CIs incl. 2 (%) | 95% CIs >2 (%) | 95% CIs ≥2 (%) | |||||
|---|---|---|---|---|---|---|---|---|---|---|---|
| TSF30 | TSFC10 | TSF30 | TSFC10 | TSF30 | TSFC10 | TSF30 | TSFC10 | TSF30 | TSFC10 | ||
| Placebo | 1 | 1.04 | 1.01 | 94.97 | 94.75 | 37.36 | 0.51 | 0 | 0 | 37.36 | 0.51 |
| Selegiline | 2 | 1.86 | 1.96 | 52.55 | 2.01 | 91.69 | 94.87 | 0.72 | 1.79 | 92.41 | 96.66 |
| Test 1 | 1 | 1.04 | 1.01 | 94.81 | 94.47 | 37.83 | 0.52 | 0 | 0 | 37.83 | 0.52 |
| Test 2 | 1.5 | 1.32 | 1.04 | 80.48 | 93.89 | 62.07 | 0.62 | 0 | 0 | 62.07 | 0.62 |
| Test 3 | 2 | 1.87 | 1.96 | 51.54 | 2.13 | 92.38 | 94.26 | 0.67 | 1.91 | 93.05 | 96.17 |
| Test 4 | 4 | 3.45 | 3.92 | 4.09 | 0 | 57.79 | 2.13 | 42.20 | 97.87 | 99.99 | 100 |
| Test 5 | 5 | 3.70 | 3.92 | 1.85 | 0 | 48.04 | 2.13 | 51.96 | 97.87 | 100 | 100 |
Note: For the estimated TSFs, geometric means are presented, as well as proportions of 95% confidence intervals including 1, including 2, wholly excluding 2, and including or greater than 2, respectively.
Abbreviations: CI, confidence interval; gmean, geometric mean; TSF, tyramine sensitivity factor; TSF10, tyramine sensitivity factor, defined as the ratio of TYRC10 at baseline (Period 1) over TYRC10 during treatment (Period 3); TSF30, tyramine sensitivity factor, defined as the ratio of TYR30 at baseline (Period 1) over TYR30 during treatment (Period 3).
When applied to the classical design escalating up to 800 mg, the TSF30 and TSFC10 performed similarly in estimating the true TSF in terms of the geometric means for placebo and test treatment 1 (both TSF = 1), and for selegiline and test treatment 3 (both TSF = 2), with the note that TSFC10 approached the true TSF closer than TSF30 (Table 1), and that variability was less in terms of more narrow ranges of simulated values for TSFC10 compared with TSF30 (Simulation Report, sections 5.2, and 6.2–6.5, available on request). TSFC10 was more successful in estimating the true TSF for test treatment 4 (TSF = 4) than TSF30; beyond TSF = 4, however, both methods performed poorly (Table 1). For the test treatment with a more subtle effect (TSF = 1.5), TSF30 somewhat approached the true TSF whilst TSFC10 did not discriminate from TSF = 1. The observation that TSFC10 and TSF30 are unable to accurately identify a treatment effect of 1.5 or 5 is a consequence of the choice of dose levels for the given TSF values used in the simulations. Performance of both TSFC10 and TSF30 can be improved by adding intermediate dose levels in the tyramine escalation scheme (Simulation Report, section 5.3, available on request). This avenue was not further pursued, because detecting TSF changes less than unity, or discriminating test treatments with TSF above 4, was not considered a major objective of the tyramine challenge applied in clinical drug development.
In terms of false‐positive or false‐negative conclusions based on TSF30 and TSFC10, the performance of TSFC10 showed an improvement over TSF30, with a reduced number of occurrences of falsely concluding that the TSF is 2 or greater when the ‘true’ value is 1 or 1.5, and of falsely concluding that TSF is 1 when the ‘true’ value is 2 (Table 1). For example, when the ‘true’ TSF is 1, the CI for TSF30 included 2 in approximately 37% of simulated trials (indicating that a true value of 2 cannot be ruled out), but only in 0.5% of simulated trials for TSFC10. Also, compared with TSF30, the TSFC10 was more successful in excluding TSF estimates of 2 or lower for test treatments with a TSF of 4 or 5 (Table 1).
Based on the basic premise that a C max ≥10 ng/mL is typically reached at lower doses than an increase of SBP ≥30 mm Hg (Tables S2 and S3), the TYRC10 criterion is expected to require fewer dose escalation days compared with the TYR30 criterion. This is confirmed by the simulations in the classical design, showing an average of 3.70 escalation days for the TYRC10 criterion and 5.04 days for the TYR30 stop criterion (Simulation Report, sections 5.2 and 6.2, available on request). Similarly, when using TYRC10, 0% of the simulated subjects required escalation to the 500 mg tyramine dose level, whilst the TYR30 criterion tested 16% of subjects at that dose level, and 0.67% of subjects continued to the 800 mg top dose level. In terms of subjects failing to meet the stopping criterion in the classical design up to 800 mg tyramine, 0% of the simulated subjects failed to reach the TYRC10 criterion, whilst 0.24% and 0.22% of subjects failed to reach the TYR30 criterion in Periods 1 and 3, respectively (Simulation Report, section 5.2, available on request). These findings confirm that the design with the TYRC10 criterion produces more evaluable subjects than the classical design and allows for a shorter study duration with fewer escalation steps.
The effect of different cutoff values for C max was explored in the classical design escalating up to 800 mg, and the simulations do not reveal any major differences in performance in the range of 2.5–10 ng/mL as cutoff value (Table 2). Intrinsic to the approach, the higher the C max cutoff, the higher the number of tyramine escalation days. In the evaluated range of cutoff values for C max, the 10 ng/mL cutoff appeared to have the lowest likelihood of wrongly concluding an effect of placebo, although this likelihood remains low for all tested cutoff values (Table 2). At the lowest cutoff of 2.5 ng/mL, cases of an incorrect conclusion on placebo (TSF = 1), selegiline (TSF = 2), and test product 4 (TSF = 4) increased slightly. Based on the above, it was concluded that the 10 ng/mL cutoff with its wide separation from tyramine baseline levels appeared to perform well, and was appropriate for further exploration.
TABLE 2.
Simulation results (10,000 simulations, with n = 12 per treatment) for TSF30 and TSFCx in the classical tyramine challenge escalating up to 800 mg of tyramine, applied to placebo treatment (TSF = 1) and active treatments (TSF 2 and 4); TSFCx values were simulated for different tyramine C max cutoff values as indicated.
| Criterion | Based on TSF30 | Based on TSFCx with C max (ng/mL): | |||
|---|---|---|---|---|---|
| ≥10 | ≥7.5 | ≥5 | ≥2.5 | ||
| Estimated TSF for placebo (TSF = 1) | 1.04 | 1.01 | 1.01 | 1.01 | 1.01 |
| Estimated TSF for selegiline (TSF = 2) | 1.86 | 1.97 | 2.00 | 2.02 | 2.03 |
| Estimated TSF for test 4 (TSF = 4) | 3.46 | 3.93 | 4.00 | 4.03 | 3.97 |
| 95% CIs including 1 for placebo (TSF = 1) (%) | 95.0 | 94.8 | 94.9 | 95.4 | 95.4 |
| 95% CIs including 2 for placebo (TSF = 1) (%) | 37 | 0.51 | 0.81 | 1.7 | 2.7 |
| 95% CIs including 2 for selegiline (TSF = 2) (%) | 91.7 | 94.9 | 95.3 | 95.4 | 95.4 |
| 95% CIs including 1 for selegiline (TSF = 2) (%) | 53 | 2.0 | 1.9 | 2.1 | 2.8 |
| 95% CIs including 2 for test 4 (TSF = 4) (%) | 58 | 2.1 | 1.9 | 2.0 | 2.6 |
| Percentage of subjects reaching dose ≥400 mg (%) | 39 | 0.08 | 0.006 | 0 | 0 |
| Average number of escalation days | 5.04 | 3.70 | 3.48 | 3.16 | 2.62 |
Note: For the estimated TSFs, geometric means are presented, as well as proportions of 95% confidence intervals including 1 or including 2 for placebo and active treatments. For the simulated designs, fraction of subjects reaching a tyramine dose of at least 400 mg are indicated, and the average number of tyramine escalation days.
Abbreviations: CI, confidence interval; C max, tyramine peak plasma concentration; gmean, geometric mean; TSF, tyramine sensitivity factor; TSF30, tyramine sensitivity factor, defined as the ratio of TYR30 at baseline (Period 1) over TYR30 during treatment (Period 3); TSFCx, tyramine sensitivity factor, defined as the ratio of TYRCx at baseline (Period 1) over TYRCx during treatment (Period 3).
The above simulations of the C max cutoff criterion applied to the classical design did not fully reflect the proposed new design, because subjects meeting the CFB SBP criterion before the C max cutoff criterion is met (e.g., due to stress‐related SBP increases) are subsequently lost from the dataset (Figure 1b). To compensate for that, the sample size per treatment may be increased, which was evaluated by trial simulation applied to the new design escalating to 400 mg only. In both the classical and new designs, with escalation to 800 or 400 mg, respectively, the performance of the C max‐based criterion exceeded that of the CFB SBP criterion in terms of estimating the ‘true’ TSF, and in terms of rates of true‐positives and false‐negatives based on 95% confidence intervals (Table 3). As anticipated, at n = 12, the new design lost performance compared with the classical design, due to loss of subjects meeting the CFB SBP criterion early, before reaching the C max cutoff. Increasing the sample size from n = 12 to n = 16 or n = 20 improved the performance of the new design, with n = 16 approaching the performance of the C max criterion applied to the classical design with n = 12 per treatment arm (Table 3). This improvement of performance by adding at least four subjects (33%) per treatment is consistent with the simulation of fraction of subjects lost from meeting the C max ≥ 10 ng/mL criterion in Periods 1 or 3 of the new design (i.e., 29%) (Simulation Report, section 6.5, available on request).
TABLE 3.
Simulation results (10,000 simulations) for TSF30 and TSFC10 in the classical tyramine challenge escalating to 800 mg of tyramine (n = 12 per treatment), and TSFC10 in the new design at different sample sizes per treatment, applied to placebo treatment (TSF = 1) and active treatments (TSF 2 and 4).
| Criterion | Classical design (n = 12) | New design (C max ≥ 10 ng/mL) | |||
|---|---|---|---|---|---|
| CFB BPP ≥30 mm Hg | C max ≥ 10 ng/mL | n = 12 | n = 16 | n = 20 | |
| Estimated TSF for placebo (TSF = 1) | 0.61 | 1.01 | 1.02 | 1.01 | 1.01 |
| Estimated TSF for selegiline (TSF = 2) | 1.88 | 1.97 | 1.98 | 1.98 | 1.97 |
| Estimated TSF for test 4 (TSF = 4) | 3.45 | 3.94 | 3.97 | 3.95 | 3.96 |
| 95% CIs including 1 for placebo (TSF = 1) (%) | 87 | 95 | 92 | 94 | 94 |
| 95% CIs including 2 for placebo (TSF = 1) (%) | 83 | 0.44 | 7.0 | 2.5 | 0.9 |
| 95% CIs including 2 for selegiline (TSF = 2) (%) | 92 | 95 | 93 | 94 | 94 |
| 95% CIs including 1 for selegiline (TSF = 2) (%) | 51 | 2.2 | 8.2 | 3.0 | 0.9 |
| 95% CIs including 2 for test 4 (TSF = 4) (%) | 58 | 2.1 | 8.0 | 2.9 | 0.9 |
| Mean number of doses in Period 3 | 3.5–5.4 | 2.7–4.7 | 3.0–4.4 | ||
Note: For the estimated TSFs, geometric means are presented, as well as proportions of 95% confidence intervals including 1 or including 2 for placebo and active treatments. For the simulated designs, mean number of doses per treatment in Period 3 are presented. All simulations assumed that 13% of the subjects receiving 12.5 mg of tyramine in Period 3 meet the CFB SBP stopping criterion.
Abbreviations: CFB SBP, change in systolic blood pressure from baseline; CI, confidence interval; C max, tyramine peak plasma concentration; gmean, geometric mean; TSF, tyramine sensitivity factor; TSF30, tyramine sensitivity factor, defined as the ratio of TYR30 at baseline (Period 1) over TYR30 during treatment (Period 3); TSFCx, tyramine sensitivity factor, defined as the ratio of TYRCx at baseline (Period 1) over TYRCx during treatment (Period 3).
It is noted that the simulations detailed above were performed with the cautious assumption that already 13% of the subjects receiving the lowest tyramine dose of 12.5 mg in Period 3 will hit the CFB BSP stopping criterion. This assumption was based on limited data from the completed study of classical design reviewed earlier, and may be argued to be pessimistic; simulations with lower rates of loss of subjects showed, as to be expected, slight improvements in the performance of the new design with lower proportions of subjects meeting the CFB SBP stopping criterion at 12.5 mg tyramine (Simulation Report, sections 6.2–6.4, available on request).
DISCUSSION
The retrospective analysis of a completed, conventional oral tyramine challenge study showed an approximate dose‐linear increase of median tyramine C max for oral tyramine doses up to 800 mg, but with major between‐ and within‐subject variation, with 10‐fold or larger differences in C max values at the same dose repeated in the same subject (Table S2; Figure 2a). Tyramine C max values at the 400 mg dose were consistent with data reported previously by Rafehi et al., and the very large within‐subject variation in tyramine C max was consistent with its very high oral first pass. 5 , 6 The high variation in tyramine exposure underscores that a conventional drug–drug interaction study design with tyramine as victim drug and tyramine C max and AUC as primary end points would not be appropriate. Whilst the tyramine challenge study with tyramine doses escalating to a specific CFB SBP as end point was developed as an alternative, the large variation in tyramine exposure and in blood pressure response (Figure 2) are important limitations to the approach, with substantial risk of uncontrolled excursions of the blood pressure beyond the predefined 30 mm Hg target of interest (Table S3; Figure S1).
To steer away from major SBP changes at the higher tyramine doses, we propose replacing the ‘dose to a SBP change’ with a ‘dose to a tyramine C max’ as a tyramine sensitivity criterion, estimated off‐line after dose escalation has been completed (Figure 1b). When using the 10 ng/mL cutoff for the latter, any interference of background tyramine is limited to 5% or less, and it will require oral tyramine doses beyond 25 mg before that peak level is reached in humans (Table S2). Retrospectively applied to our dataset, the likelihood of a major SBP change at the proposed C max ≥10 ng/mL cutoff is less than 20% (Figure 3). Furthermore, the primary focus on C max ≥ 10 ng/mL would allow terminating tyramine escalation sooner (e.g., at 400 mg) (Table S2), thereby taking out the risk of SBP spikes associated with higher tyramine doses (Table S3), and reducing the study duration. In our retrospective analysis, the dose to C max ≥ 10 ng/mL approach performs within a two‐fold margin similarly to the classical TSF30 criterion, with the exception of reference treatment phenelzine where TSF30 overestimates change in C max (Table S4).
Simulating the dose to 10 ng/mL approach in the classical tyramine challenge with escalation up to 800 mg demonstrated that TSFC10 approached the true TSF of placebo and active treatments with TSFs up to 4 closer than TSF30, with less variation (Table 1; Simulation Report, sections 5.2 and 6.2–6.5, available on request). Notably, the TSFC10 approach had lower false‐positive and false‐negative rates in estimating TSFs (Table 1). Regarding the choice of the cutoff values from the range of 2.5–10 ng/mL, simulation results indicated that the 10 ng/mL value was a reasonable compromise between performance of the TSFC10 method, and number of tyramine dose escalations required (Table 2). Based on these initial simulation findings, the proposed new design planned for tyramine escalation up to 400 mg, unless the conventional CFB SBP criterion of ≥30 mm Hg would be met, with assessment of TSFC10 as primary end point (Table S1; Figure 1b). Simulations of this new design demonstrated that performance of the C max‐based criterion exceeded that of the CFB SBP criterion in terms of increased cases estimating the ‘true’ TSF, and a major (>10‐fold) reduction of false‐positive and false‐negatives rates, based on 95% confidence intervals (Table 3). As expected, loss of subjects hitting the CFB SBP criterion at low tyramine doses impacts the performance of the TSFC10 approach, requiring a sample size adjustment from n = 12 to n = 16 per treatment (Table 3). With that adjustment, the new design with escalation to 400 mg of tyramine and using C max ≥ 10 ng/mL as the criterion to estimate TSF exceeded the performance of the CFB SBP‐based classical design in terms of (1) improved identification of treatments with TSF of 1 or 2 as a proportion of confidence intervals including the ‘true’ TSF, (2) a major (at least 10‐fold) reduction in cases wrongly concluding a TSF = 2 for placebo (TSF = 1) or concluding TSF = 1 for selegiline treatment (TSF = 2), and (3) reducing the mean number of doses required for a decision by at least 1 day, increasing study efficiency (Table 3). Implicit in the new approach, and not further demonstrated by simulation, is its safety advantage of not exceeding the 400 mg tyramine dose, thereby avoiding SBP spikes beyond 30 mm Hg associated with the tyramine doses from 500 mg up to 800 mg in the classical design (Table S3).
The strength of our retrospective analysis of the previously completed oral tyramine challenge is its use of an extensive set of tyramine plasma concentration data, collected concurrently with the blood pressure data. To the best of our knowledge, a tyramine exposure dataset of similar size has not been published to date for a tyramine challenge study of classical design. One important limitation is in the retrospective nature of the work that builds on tyramine C max data that were not intended as primary or secondary study end points. Related to that, blood sampling for capturing C max was not continued beyond 60 or 90 min post‐dosing, and was not applied consistently throughout both study periods in all study participants. Inconsistent sampling up to 30 min may have underestimated C max in subjects with a peak before the reported tyramine median t max of 46 min. 5 As a consequence, the actual C max in individual subjects may have been inaccurately estimated, and thereby within‐ and between‐subject variation in C max may have been overestimated in our retrospective evaluation. Therefore, the actual performance of the proposed new design with TSFC10 with frequent (e.g., every 15 min) blood sampling for 2 h to accurately capture C max in future studies may exceed its performance estimated by simulation in the present study. This frequent sampling schedule captured individual t max values ranging from about 0.25–2 h, and proved adequate for describing tyramine exposure. 5 Further evaluation or optimization of the blood sampling schedule by trial simulation was therefore not pursued for the present study.
It is further noted that neither TSF30 nor TSFC10 were suitable for correctly identifying treatments with TSF values of 1.5 or exceeding 4 (Table 1), which was a consequence of the current choice of tyramine dose levels for simulation. It is expected that escalation designs starting at lower tyramine doses and with smaller escalation steps will fully remedy this aspect. Since TSF increments of less than unity have not been an area of focus in tyramine challenge studies to date, and anticipating that a TSF spectrum of 1 to 4 will address most needs in the clinical evaluation of novel MAO inhibitors, optimization of the design in this regard was not pursued further in the present study.
A further point, not explored in the present evaluation, is the opportunity to further simplify the design by omitting reference and active control treatments, similar to regular pharmacokinetic drug–drug interaction studies that typically only evaluate one perpetrator test drug, without comparison to reference and active control treatments.
An unexpected finding in the retrospective evaluation of the completed tyramine challenge was the increased likelihood of an SBP increase in subjects also receiving phenelzine, compared with placebo treatment or at baseline in the same tyramine exposure range up to 150 ng/mL (Figure 3). This observation, which was also noted for selegiline but to a smaller extent, translated to an estimated TSF30 for phenelzine that importantly exceeded the TSFC10 (Table S4). Since systemic tyramine levels did not explain this ‘excess of effect on SBP’, we speculate that this finding is likely due to a direct or indirect sympathicomimetic effect of phenelzine or active metabolite in the complex pharmacology of MAO inhibitors. 15 , 16 This observation underscores that for future tyramine drug interaction testing of novel MAO inhibitors it will be essential to articulate the primary question at hand, namely whether the test treatment reduces the first pass of oral tyramine, or affects blood pressure indirectly in the presence of systemic tyramine. We recommend addressing the first question in the new design with TSFC10 as the primary end point, with the note that CFB SBP assessment for safety in the new design will provide pointers for a pharmacodynamic contribution as well. When pharmacodynamics would be the primary question to address, rather than systemic tyramine exposure, a dedicated study design will be required, for example, a pharmacodynamic drug–drug interaction study with a crossover design, in which the effect of the experimental drug on SBP is evaluated stand‐alone, and on top of intravenously infused tyramine at systemic steady state.
CONCLUSIONS
The presented new tyramine challenge study design evaluates the tyramine dose to C max of ≥10 ng/mL as primary end point, measured off‐line after escalation. In terms of subject safety, study duration, costs, and interpretability for trial objectives, it outperforms the classical tyramine challenge design that focuses on SBP changes and escalates to higher tyramine doses. In trial simulations, the new design has an improved performance in terms of identifying the correct TSF, with more than 10‐fold reduced false‐positive and false‐negative rates in some cases in estimating TSFs. By escalating to tyramine doses not exceeding 400 mg, the new design reduces risk to subjects associated with tyramine‐induced SBP excursions. Also, it spends less time on escalating, and is thereby less demanding for study participants, and more efficient with shorter overall duration of the trial. Results warrant the further consideration and application of this new design for the clinical evaluation of novel MAO inhibitors for which there would be a concern about their safety when dosed in combination with tyramine‐containing foods or liquids.
AUTHOR CONTRIBUTIONS
E.‐J.v.H., J.C., and K.L.S. designed the research. E.‐J.v.H., K.L.S., and J.H. performed the research. E.‐J.v.H., K.L.S., and J.C. analyzed the data. E.‐J.v.H., K.L.S., J.H., and J.C. wrote the manuscript.
FUNDING INFORMATION
This work was funded by ICON.
CONFLICT OF INTEREST STATEMENT
The authors declared no competing interests for this work.
Supporting information
Appendix S1
Appendix S2
Appendix S3
Appendix S4
van Hoogdalem E‐J, Smith KL, Hartstra J, Constant J. Rethinking, reducing, and refining the classical oral tyramine challenge test of monoamine oxidase (MAO) inhibitors. Clin Transl Sci. 2023;16:2058‐2069. doi: 10.1111/cts.13612
REFERENCES
- 1. Ostadkarampour M, Putnins EE. Monoamine oxidase inhibitors: a review of their anti‐inflammatory therapeutic potential and mechanisms of action. Front Pharmacol. 2021;12:676239. [DOI] [PMC free article] [PubMed] [Google Scholar]
- 2. Finberg JPM, Rabey JM. Inhibitors of MAO‐A and MAO‐B in psychiatry and neurology. Front Pharmacol. 2016;7:340. [DOI] [PMC free article] [PubMed] [Google Scholar]
- 3. Duarte P, Cuadrado A, León R. Monoamine oxidase inhibitors: from classic to new clinical approaches. Handb Exp Pharmacol. 2021;264:229‐259. [DOI] [PubMed] [Google Scholar]
- 4. Iacovino LG, Manzella N, Resta J, et al. Rational redesign of monoamine oxidase A into a dehydrogenase to probe ROS in cardiac aging. ACS Chem Biol. 2020;15:1795‐1800. [DOI] [PMC free article] [PubMed] [Google Scholar]
- 5. Rafehi M, Faltraco F, Matthaei J, et al. Highly variable pharmacokinetics of tyramine in humans and polymorphisms in OCT1, CYP2D6, and MAO‐A. Front Pharmacol. 2019;10:1297. [DOI] [PMC free article] [PubMed] [Google Scholar]
- 6. VanDenBerg CM, Blob LF, Kemper EM, Azzaro AJ. Tyramine pharmacokinetics and reduced bioavailability with food. J Clin Pharmacol. 2003;43:604‐649. [PubMed] [Google Scholar]
- 7. Calvi A, Fischetti I, Verzicco I, et al. Antidepressant drugs effects on blood pressure. Front Cardiovasc Med. 2021;8:704281. [DOI] [PMC free article] [PubMed] [Google Scholar]
- 8. Gillman PK. A reassessment of the safety profile of monoamine oxidase inhibitors: elucidating tired old tyramine myths. J Neural Transm (Vienna). 2018;125:1707‐1717. [DOI] [PubMed] [Google Scholar]
- 9. Goren T, Adar L, Sasson N, Weiss YM. Clinical pharmacology tyramine challenge study to determine the selectivity of the monoamine oxidase type B (MAO‐B) inhibitor rasagiline. J Clin Pharmacol. 2010;50:1420‐1428. [DOI] [PubMed] [Google Scholar]
- 10. Flanagan S, Bartizal K, Minassian SL, Fang E, Prokocimer P. In vitro, in vivo, and clinical studies of tedizolid to assess the potential for peripheral or central monoamine oxidase interactions. Antimicrob Agents Chemother. 2013;57:3060‐3066. [DOI] [PMC free article] [PubMed] [Google Scholar]
- 11. Marquet A, Kupas K, Johne A, et al. The effect of safinamide, a novel drug for Parkinson's disease, on pressor response to oral tyramine: a randomized, double‐blind, clinical trial. Clin Pharmacol Ther. 2012;92:450‐457. [DOI] [PubMed] [Google Scholar]
- 12. ClinicalTrials.gov . Study to evaluate the pressor effect of oral tyramine during ozanimod treatment in healthy adult participants; NCT04978298. 2023. https://www.clinicaltrials.gov/ct2/show/NCT04978298. Accessed May 26, 2023.
- 13. Farha KA, van Vliet A, van Marle S, Vrijlandt P, Westenbrink D. Hypertensive crisis‐induced electrocardiographic changes: a case series. J Med Case Reports. 2009;20:7283. [DOI] [PMC free article] [PubMed] [Google Scholar]
- 14. Cantarini MV, Painter CJ, Gilmore EM, Bolger C, Watkins CL, Hughes AM. Effect of oral linezolid on the pressor response to intravenous tyramine. Br J Clin Pharmacol. 2004;58:470‐475. [DOI] [PMC free article] [PubMed] [Google Scholar]
- 15. Baker GB, Coutts RT, McKenna KF, Sherry‐McKenna RL. Insights into the mechanisms of action of the MAO inhibitors phenelzine and tranylcypromine: a review. J Psychiatry Neurosci. 1992;17:206‐214. [PMC free article] [PubMed] [Google Scholar]
- 16. Keck PE Jr, Vuckovic A, Pope HG Jr, Nierenberg AA, Gribble GW, White K. Acute cardiovascular response to monoamine oxidase inhibitors: a prospective assessment. J Clin Psychopharmacol. 1989;9:203‐206. [PubMed] [Google Scholar]
Associated Data
This section collects any data citations, data availability statements, or supplementary materials included in this article.
Supplementary Materials
Appendix S1
Appendix S2
Appendix S3
Appendix S4