

Abstract
Receptor‐interacting protein 1 (RIP1) is a key regulator of multiple signaling pathways that mediate inflammatory responses and cell death. RIP1 kinase activity mediates apoptosis and necroptosis induced by tumor necrosis factor (TNF)‐α, Toll‐like receptors, and ischemic tissue damage. RIP1 has been implicated in several human pathologies and consequently, RIP1 inhibition may represent a therapeutic approach for diseases dependent on RIP1‐mediated inflammation and cell death. GDC‐8264 is a potent, selective, and reversible small molecule inhibitor of RIP1 kinase activity. This phase I, randomized, placebo‐controlled, double‐blinded trial examined safety, pharmacokinetics (PKs), and pharmacodynamics (PDs) of single‐ (5–225 mg) and multiple‐ (50 and 100 mg once daily, up to 14 days) ascending oral doses of GDC‐8264 in healthy volunteers, and also tested the effect of food on the PKs of GDC‐8264. All adverse events in GDC‐8264‐treated subjects in both stages were mild. GDC‐8264 exhibited dose‐proportional increases in systemic exposure; the mean terminal half‐life ranged from 10–13 h, with limited accumulation on multiple dosing (accumulation ratio [AR] ~ 1.4); GDC‐8264 had minimal renal excretion at all doses. A high‐fat meal had no significant effect on the PKs of GDC‐8264. In an ex vivo stimulation assay of whole blood, GDC‐8264 rapidly and completely inhibited release of CCL4, a downstream marker of RIP1 pathway activation, indicating a potent pharmacological effect. Based on PK‐PD modeling, the GDC‐8264 half‐maximal inhibitory concentration for the inhibition of CCL4 release was estimated to be 0.58 ng/mL. The favorable safety, PKs, and PDs of GDC‐8264 support its further development for treatment of RIP1‐driven diseases.
Study Highlights.
WHAT IS THE CURRENT KNOWLEDGE ON THE TOPIC?
Signaling through receptor‐interacting protein 1 (RIP1), an intracellular TNFR1‐associated kinase, can activate multiple inflammatory pathways that involve cell death. In RIP1‐driven diseases, RIP1 inhibition may reduce inflammation and tissue damage. GDC‐8264 potently and selectively inhibits RIP1 kinase activity, but not its scaffolding function.
WHAT QUESTION DID THIS STUDY ADDRESS?
This phase I trial investigated safety, pharmacokinetics (PKs; including the effect of food), and pharmacodynamics of GDC‐8264 in healthy volunteers.
WHAT DOES THIS STUDY ADD TO OUR KNOWLEDGE?
GDC‐8264 was well‐tolerated in healthy individuals and exhibited dose‐proportional increases in exposure. A high‐fat meal had minimal effect on GDC‐8264 PKs. Ex vivo stimulation of blood from study subjects demonstrated that GDC‐8264 rapidly and completely inhibited release of CCL4, a RIP1 pathway biomarker, indicating high potency.
HOW MIGHT THIS CHANGE CLINICAL PHARMACOLOGY OR TRANSLATIONAL SCIENCE?
GDC‐8264 has favorable safety and PKs, and notable potency that enables complete and lasting blockade of RIP1 activity in blood. These properties allow further investigation into the importance of the RIP1 pathway in multiple diseases and the development of more effective therapies.
INTRODUCTION
Regulated cell death is critical for development and homeostasis, but disruptions in that regulation can lead to disease. Among others, regulated cell death pathways include apoptosis, a caspase‐mediated and generally noninflammatory process, and necroptosis, a type of programmed necrosis that occurs during caspase inhibition or insufficient caspase activation, when cell damage leads to the release of intracellular contents, which induces inflammation. 1 Abnormalities in cell death pathways have been linked to a variety of immune disorders and neurodegenerative diseases, as well as to tissue damage. 2
Receptor‐interacting protein 1 (RIP1) is a broadly expressed serine–threonine kinase that can bind to the intracellular domain of the tumor necrosis factor (TNF)‐α receptor 1 (TNFR1) to contribute to TNF‐α signaling and regulation of inflammatory cell death through distinct scaffolding and kinase functions. 3 , 4 , 5 , 6 , 7 , 8 As part of its scaffolding function, ubiquitination of RIP1 by cellular inhibitor of apoptosis protein (c‐IAP) 1/2 leads to the activation of nuclear factor (NF)‐κB‐ and mitogen‐activated protein kinase (MAPK)‐dependent gene transcription and induction of proinflammatory cytokine production. 2 Over time, RIP1 can leave the TNFR1‐associated signaling complex and move into the cytoplasm to interact with caspase‐8 and mediate apoptosis, or autophosphorylated RIP1 can subsequently engage RIP3, causing autophosphorylation and activation of RIP3, which results in mixed lineage kinase domain‐like pseudokinase (MLKL) phosphorylation and eventual necroptosis. Unlike NF‐κB and MAPK activation, RIP1‐mediated cell death requires RIP1 kinase activity. Inhibition of RIP1 kinase activity reduces inflammation and tissue damage in several disease models, and may therefore be a therapeutic strategy, 6 , 9 , 10 , 11 especially for diseases where TNF‐α‐mediated cell death may be involved. 7 , 9 , 10 , 12 , 13 Such diseases include inflammatory bowel disease, a chronic inflammatory autoimmune condition of the gastrointestinal tract that is characterized by inflammation and tissue destruction, 9 , 10 , 14 , 15 and acute graft‐versus‐host disease (aGVHD), an immunologically mediated, life‐threatening disease that frequently involves the gastrointestinal tract and is seen in recipients of allogeneic hematopoietic stem cell transplantation. 16 RIP1 inhibition may also benefit those with renal ischemia–reperfusion injury that leads to acute kidney injury 9 , 17 or those with skin inflammation. 10 , 18 , 19 Recent work 16 and preclinical studies in mice and rats with a genetic inactivation of the RIP1 kinase show no evidence of immunosuppression, indicating that inhibition of RIP1 kinase activity may represent a nonimmunosuppressive therapy. 4 , 10 , 19 , 20
In healthy volunteers 21 , 22 and in patients with psoriasis, 23 rheumatoid arthritis, 24 and active ulcerative colitis, 25 RIP1 kinase inhibitors were generally well‐tolerated, and no clinically significant safety signals have emerged. Although trials of these investigational drugs as tested did not demonstrate efficacy, and some of the drugs exhibited significant off‐target effects, 22 , 26 new agents or clinical trials may elucidate the therapeutic potential of RIP1 kinase inhibition in other diseases. GDC‐8264 is a potent, selective, and orally available small molecule inhibitor of RIP1 that has shown activity in cellular assays and in animal models of intestinal and colonic inflammation without affecting the RIP1 scaffolding function (D. Vucic, unpublished data). GDC‐8264 is currently being developed as a potential novel therapeutic for aGVHD and other diseases involving cell death.
The primary objective of this first‐in‐human trial was to evaluate the safety and tolerability of single and multiple doses of GDC‐8264 compared with placebo in healthy subjects. Additionally, this study aimed to characterize the pharmacokinetics (PKs) of GDC‐8264, including renal excretion and the effect of food, and assess GDC‐8264 effects on pharmacodynamic (PD) biomarkers of RIP1 pathway activation.
METHODS
Study design
This first‐in‐human, randomized, double‐blind, placebo‐controlled study (EudraCT: 2019–002613‐19) evaluated the safety, tolerability, and PKs, and explored PD effects of oral GDC‐8264 in healthy, adult volunteers. The study was conducted at a single clinical research unit (CRU) in the Netherlands.
The study had two stages, a single ascending‐dose (SAD) stage and a multiple ascending‐dose (MAD) stage (Figure 1a). The MAD stage also had a cohort where the CYP3A induction effect of GDC‐8264 was evaluated; data from this cohort will be reported separately. The SAD stage included five cohorts that received oral GDC‐8264, in doses ranging from 5–225 mg, or placebo. Subjects were allocated to receive GDC‐8264 or placebo in a 6:2 ratio. Screening occurred within 28 days before dosing with admission to the CRU on day −2; on day 1, subjects were dosed after an 8 h fast and remained in the CRU for 72 h after dosing. Subjects returned for a follow‐up visit on day 7, with follow‐up lasting through day 14. On the first day of dosing for all SAD cohorts, two (sentinel) subjects (1 placebo and 1 GDC‐8264) were dosed, and the remainder of the cohort was dosed at least 24 h later if deemed safe by the investigator. The study also included a cohort to study the effect of food: after the 75‐mg cohort completed follow‐up, the same subjects underwent a study drug washout of at least five half‐lives, and were re‐dosed with 75 mg GDC‐8264 or placebo after a high‐fat meal. Subjects were monitored as described above.
FIGURE 1.
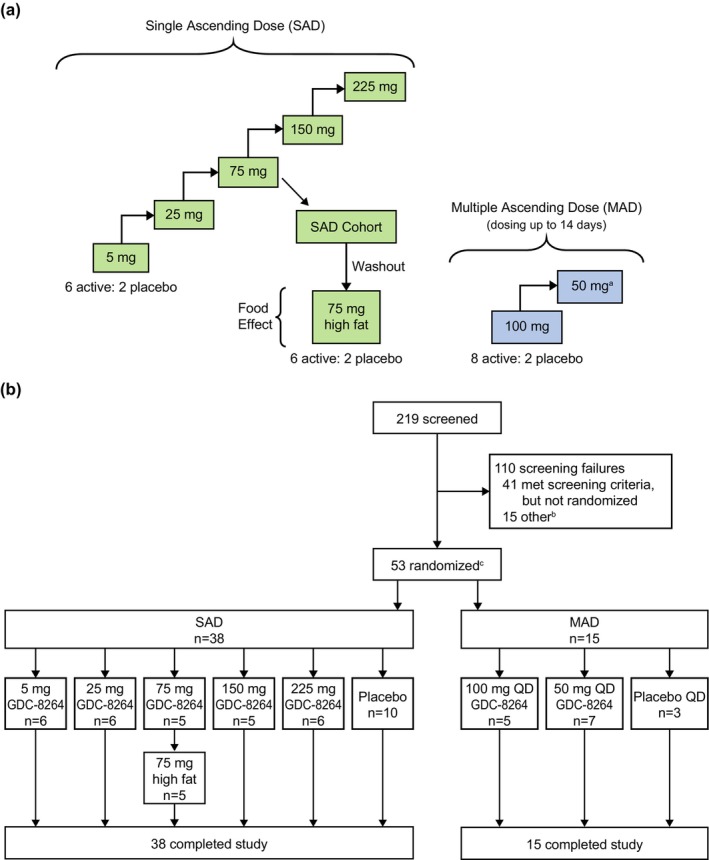
(a) Study design. After the 75‐mg SAD cohort was completed, the food‐effect cohort was initiated after a washout period. Subjects then received 75 mg GDC‐8264 after a high‐fat meal. The planned treatment allocation for each MAD cohort was to be eight active to two placebo, with dosing for up to 14 days. (b) Study flow diagram. (a) After the 100‐mg MAD cohort was completed, it was determined that no higher exposures would be required. A 50‐mg MAD cohort was thus dosed afterward to obtain a range of MAD doses. (b) Fifteen subjects were randomized to an additional cohort to study the drug–drug interaction potential of GDC‐8264, which will be described separately. (c) The number of randomized patients was lower than planned because of enrollment challenges. MAD, multiple ascending dose; SAD, single ascending dose.
The MAD stage was initiated after the highest SAD cohort completed, and safety and tolerability were determined to be acceptable. This stage included two cohorts, with subjects allocated to GDC‐8264 or placebo in a ratio of 8:2 (Figure 1a). Subjects received once‐daily (q.d.) oral doses of GDC‐8264 (50 mg and 100 mg) or placebo for up to 14 days. The screening period was 28 days, admission to the CRU occurred on day −2, dosing occurred on days 1–14, and subjects remained on site until 72 h after the last dose. Follow‐up visits occurred on days 21 and 42.
Subjects
Eligible subjects were male and female volunteers, from 18–55 years old, with a body mass index (BMI) of 18–30 kg/m2, and healthy, as determined by medical history, physical examination, clinical laboratory tests, vital signs, and 12‐lead electrocardiograms (ECGs). Female subjects were excluded if they were pregnant or breastfeeding. Additional exclusion criteria, and randomization and blinding procedures are described in the Appendix S1.
Safety outcomes and assessments
The primary outcomes were the incidence and nature of any treatment‐emergent adverse events (TEAEs) and serious adverse events (SAEs), ECG abnormalities, laboratory abnormalities, and vital signs. Adverse events (AEs) were assigned using the Medical Dictionary for Regulatory Activities (MedDRA version 23.1), and AE severity was assessed using the World Health Organization toxicity grading scale.
Pharmacokinetic outcomes and assessments
For the SAD and MAD stages, secondary outcomes were the plasma PK parameters following single and multiple oral doses of GDC‐8264, respectively, in the fasted state. For the food‐effect cohort, secondary outcomes were the plasma PKs and the relative bioavailability of a single dose of GDC‐8264 following a high‐fat breakfast compared with the fasted state based on area under the concentration‐time curve (AUC) and the observed maximum plasma concentration (C max). For the SAD and food‐effect stages, plasma PK samples were collected predose, at multiple timepoints through 72 h postdose, at the day 7 visit, and at any unplanned visits. For the MAD stage, plasma PK samples were collected predose and at multiple timepoints after the first dose through 16 h postdose; predose on days 2, 4, and 7; predose and at multiple timepoints through 72 h postdose on day 14, and at early withdrawal.
For both stages, GDC‐8264 concentrations in plasma were determined by high‐performance liquid chromatography with tandem mass spectroscopy performed on a Triple Quad 5500 instrument (Sciex; lower limit of quantification, 0.0500 ng/mL).
Exploratory outcomes and assessments
GDC‐8264 urine PKs
GDC‐8264 concentrations in urine were measured to assess renal excretion following oral administration of GDC‐8264 in the SAD and MAD stages. Urine PK sample collection, PK parameters assessed, and assays are described in the Supplementary Methods (Appendix S1).
Biomarker analyses: Ex vivo stimulation assay for CCL4 secretion
To investigate the pharmacological activity of GDC‐8264, levels of CCL4, a biomarker of RIP1 pathway activation, 21 were measured after ex vivo stimulation of the RIP1‐mediated necroptosis pathway in whole blood from volunteers in the SAD and MAD stages. Sample collection and assay details are provided in the Supplementary Methods (Appendix S1).
Pharmacokinetic‐pharmacodynamic modeling
To evaluate potential relationships between changes in CCL4 levels and drug exposure, PK‐PD modeling was performed, and the GDC‐8264 half‐maximal inhibitory concentration (IC50) of target inhibition/engagement was determined. See Supplementary Methods in Appendix S1 for details.
Study drug, dose selection, and dose administration
GDC‐8264 was supplied by Genentech, Inc. An oral suspension was used for the 5‐ and 25‐mg cohorts, and a tablet formulation was used for the 75–225‐mg doses. An oral suspension was used for the earlier 5‐ and 25‐mg cohorts to afford a greater degree of control over the administered doses and the titration of dose escalation. The starting dose of 5 mg in healthy subjects was associated with greater than 100‐fold safety margins based on the no‐observed‐adverse‐effect levels in cynomolgus monkeys (D. Vucic, M. Mitra, unpublished data). Doses in both stages were administered in the morning after an overnight fast of at least 8 h. In the SAD stage, subjects fasted for an additional 4 h after dosing; in the MAD stage, subjects fasted after dosing on days 1, 7, and 14, and on other days, ate breakfast 1 h after dosing. For the food‐effect cohort, subjects fasted for 8 h, ate a high‐fat breakfast (finished within 20 min), and were dosed 30 min after the start of breakfast.
Statistical analysis
No formal sample size or power calculations were performed for this study. A sample size of six subjects dosed with active drug in each SAD cohort and eight subjects dosed with active drug in each MAD cohort was deemed sufficient to characterize the safety and tolerability of GDC‐8264, and to conduct a preliminary PK evaluation. All statistical analyses were performed using SAS for Windows (version 9.4 or higher; SAS Institute, Inc.).
The safety analysis population included all subjects who received at least one dose of GDC‐8264 or placebo. TEAEs were coded according to the MedDRA version 23.1.
The PK analysis population included all subjects with sufficient data to enable parameter estimation. PK parameters were estimated from individual concentration‐time profiles using noncompartmental methods with Phoenix WinNonlin (version 8.1 or higher) software (Certara) and summarized using descriptive statistics.
Dose proportionality was evaluated using a regression (power) model relating log‐transformed C max and AUC parameters to the log‐transformed dose. Point estimates for the intercept, slope, and corresponding 95% confidence intervals for the slope were calculated using the SAS procedure for mixed‐effect models (PROC MIXED; SAS Institute). Details of statistical methods for assessing the effect of food, the development of the PK‐PD model, and the PD biomarker analyses are provided in the Supplementary Methods (Appendix S1).
Ethics statement
The clinical study protocol and associated documents were reviewed and approved by the Independent Ethics Committee of the Foundation Beoordeling Ethiek Biomedisch Onderzoek (Evaluation of Ethics in Biomedical Research), the Netherlands. The study was conducted in accordance with the principles of the Declaration of Helsinki and was compliant with the International Council for Harmonization (ICH) E6(R2) Guideline for Good Clinical Practice (European Medicines Agency/Committee for Medicinal Products for Human Use/ICH/135/1995) and the EU Clinical Trial Directive 2001/20/EC.3. All subjects provided written, informed consent.
RESULTS
Subject disposition and demographics
The study began with the first screening of subjects on January 3, 2020, and ended with the last follow‐up visit on October 13, 2021. On March 18, 2020, study enrollment was halted because of the developing coronavirus disease 2019 pandemic. After approval of an amended protocol, study enrollment resumed after a 5‐month pause, but the number of subjects randomized was less than planned because of enrollment challenges. Of 219 subjects screened, 53 were randomized to the SAD and MAD stages. All 53 subjects received either GDC‐8264 or placebo and completed the study (Figure 1b). All subjects were included in the safety analyses, and all subjects who received GDC‐8264 were included in the PK analysis.
In the SAD, 38 subjects ranged in age from 18–55 years and had a BMI range of 18.5–29.4 kg/m2. The mean age ranged from 23 ± 5 years in the 25‐mg cohort to 43 ± 13 years in the 75‐mg cohort (Table 1). The proportion of male subjects per cohort ranged from 33.3% to 90%. The majority of subjects were White (78.9%); three were Black/African American, two were Asian, one was American Indian/Alaska native, two were of multiple races, and three were Hispanic/Latino.
TABLE 1.
Subject demographics and baseline characteristics.
| SAD | MAD | ||||||||
|---|---|---|---|---|---|---|---|---|---|
| GDC‐8264 | Placebo | GDC‐8264 | Placebo | ||||||
| 5 mg | 25 mg | 75 mg | 150 mg | 225 mg | 50 mg q.d. | 100 mg q.d. | |||
| Parameter | n = 6 | n = 6 | n = 5 | n = 5 | n = 6 | n = 10 | n = 5 | n = 7 | n = 3 |
| Age, years, mean (SD) | 30 (7) | 23 (5) | 43 (13) | 34 (13) | 26 (4) | 34 (14) | 31 (13) | 36 (10) | 29 (10) |
| Weight, kg, mean (SD) | 71.8 (9.2) | 74.9 (15.7) | 73.1 (8.9) | 78.7 (7.9) | 73.8 (14.8) | 78.5 (6.5) | 73.4 (7.2) | 71.4 (20.4) | 65.4 (9.2) |
| Height, cm, mean (SD) | 172 (14) | 183 (6) | 175 (8) | 178 (6) | 174 (9) | 178 (9) | 177 (5) | 168 (16) | 168 (7) |
| BMI, kg/m2, mean (SD) | 24.3 (2.6) | 22.3 (3.8) | 23.8 (2.0 | 25.0 (3.3) | 24.2 (3.4) | 24.9 (3.4) | 23.5 (3.1) | 24.8 (2.7) | 23.2 (1.6) |
| Sex, n (%) | |||||||||
| Male | 3 (50.0) | 5 (83.3) | 2 (40.0) | 3 (60.0) | 2 (33.3) | 9 (90.0) | 4 (80.0) | 2 (28.6) | 1 (33.3) |
| Female | 3 (50.0) | 1 (16.7) | 3 (60.0) | 2 (40.0) | 4 (66.7) | 1 (10.0) | 1 (20.0) | 5 (71.4) | 2 (66.7) |
| Ethnicity, n (%) | |||||||||
| Not Hispanic or Latino | 5 (83.3) | 6 (100) | 5 (100) | 5 (100) | 5 (83.3) | 9 (90.0) | 5 (100) | 5 (71.4) | 3 (100) |
| Hispanic or Latino | 1 (16.7) | – | – | – | 1 (16.7) | 1 (10.0) | – | 2 (28.6) | – |
| Race, n (%) | |||||||||
| White | 6 (100) | 6 (100) | 4 (80.0) | 4 (80.0) | 3 (50.0) | 7 (70.0) | 5 (100) | 6 (85.7) | 3 (100) |
| Black or African American | – | – | – | 1 (20.0) | 1 (16.7) | 1 (10.0) | – | – | – |
| American Indian or Alaska Native | – | – | – | – | – | 1 (10.0) | – | 1 (14.3) | – |
| Asian | – | – | 1 (20.0) | – | – | 1 (10.0) | – | – | – |
| Multiple | – | – | – | – | 2 (33.3) | – | – | – | – |
Abbreviations: BMI, body mass index; MAD, multiple‐ascending dose; n, number of subjects; QD, once daily; SAD, single‐ascending dose.
In the MAD, 15 subjects ranged in age from 19–54 years, with a BMI range of 19.9–29.3 kg/m2. The mean age ranged from 29 ± 10 years in the placebo group to 36 ± 10 years in the 100‐mg GDC‐8264 q.d. cohort (Table 1). The proportion of male subjects varied from 28.6% to 80% of each cohort. The majority of subjects were White (93.3%), and one subject was American Indian/Alaska native, and two subjects were Hispanic/Latino.
Safety
During the SAD stage, 19 (67.9%) subjects reported 33 TEAEs in the GDC‐8264‐treated groups, and five (50%) subjects reported seven AEs in the placebo group (Table 2). Nearly all TEAEs were mild in severity; one subject in the placebo group reported a moderate TEAE of syncope. The most frequently reported TEAEs were contact dermatitis (8 TEAEs in 6 [15.8%] subjects), headache (6 TEAEs in 6 [15.8%] subjects), and nausea (5 TEAEs in 5 [13.2%] subjects). Reported TEAEs occurred at comparable rates in GDC‐8264‐treated and placebo groups. The cohort that received a high‐fat meal before receiving the study drug showed no differences in the frequency of TEAEs compared with the corresponding fasted cohort.
TABLE 2.
Overview of safety and TEAEs reported by ≥2 subjects overall in either the SAD or the MAD stages.
| SAD (fasted) | SAD (high fat) | SAD total | MAD | MAD total | |||||||||||
|---|---|---|---|---|---|---|---|---|---|---|---|---|---|---|---|
| Placebo | GDC‐8264 | Placebo | GDC‐8264 | Placebo q.d. | GDC‐8264 | ||||||||||
| 5 mg | 25 mg | 75 mg | 150 mg | 225 mg | All GDC‐8264 | 75 mg | 50 mg q.d. | 100 mg q.d. | All GDC‐8264 | ||||||
| (n = 10) | (n = 6) | (n = 6) | (n = 5) | (n = 5) | (n = 6) | (n = 28) | (n = 2) | (n = 5) | (n = 38) | (n = 3) | (n = 5) | (n = 7) | (n = 12) | (n = 15) | |
| No. of subjects with at least one TEAE | 5 (50.0) | 5 (83.3) | 4 (66.7) | 3 (60.0) | 4 (80.0) | 3 (50.0) | 19 (67.9) | 2 (100) | 2 (40.0) | 25 (65.8) | 3 (100) | 3 (60.0) | 7 (100) | 10 (83.3) | 13 (86.7) |
| No. of TEAEs a | 7 | 6 | 6 | 8 | 6 | 7 | 33 | 3 | 4 | 47 | 5 | 10 | 32 | 42 | 47 |
| No. of deaths | 0 | 0 | 0 | 0 | 0 | 0 | 0 | 0 | 0 | 0 | 0 | 0 | 0 | 0 | 0 |
| No. of subjects withdrawn from study due to a TEAE | 0 | 0 | 0 | 0 | 0 | 0 | 0 | 0 | 0 | 0 | 0 | 0 | 0 | 0 | 0 |
| No. of subjects with at least one | |||||||||||||||
| Serious TEAE | 0 | 0 | 0 | 0 | 0 | 0 | 0 | 0 | 0 | 0 | 0 | 0 | 0 | 0 | 0 |
| Related TEAE | 1 (10.0) | 0 | 0 | 1 (20.0) | 3 (60.0) | 0 | 4 (14.3) | 0 | 0 | 5 (13.2) | 2 (66.7) | 3 (60.0) | 5 (71.4) | 8 (66.7) | 10 (66.7) |
| TEAEs b reported by ≥2 subjects overall in either the SAD or MAD c | |||||||||||||||
| Abdominal pain | 1 (10.0) | 1 (16.7) | 1 (16.7) | 0 | 0 | 0 | 2 (7.1) | 0 | 0 | 3 (7.9) | 1 (33.3) | 0 | 2 (28.6) | 2 (16.7) | 3 (20.0) |
| Diarrhea | 1 (10.0) | 0 | 0 | 0 | 0 | 0 | 0 | 0 | 0 | 1 (2.6) | 0 | 1 (20.0) | 2 (28.6) | 3 (25.0) | 3 (20.0) |
| Somnolence | 0 | 0 | 0 | 0 | 0 | 0 | 0 | 0 | 0 | 0 | 0 | 0 | 3 (42.9) | 3 (25.0) | 3 (20.0) |
| Headache | 1 (10.0) | 1 (16.7) | 2 (33.3) | 0 | 1 (20.0) | 0 | 4 (14.3) | 0 | 1 (20.0) | 6 (15.8) | 0 | 0 | 2 (28.6) | 2 (16.7) | 2 (13.3) |
| Dermatitis contact | 1 (10.0) | 1 (16.7) | 0 | 2 (40.0) | 1 (20.0) | 0 | 4 (14.3) | 1 (50.0) | 1 (20.0) | 6 (15.8) | 0 | 0 | 1 (14.3) | 1 (8.3) | 1 (6.7) |
| Dyspepsia | 0 | 1 (16.7) | 0 | 0 | 0 | 0 | 1 (3.6) | 0 | 0 | 1 (2.6) | 1 (33.3) | 1 (20.0) | 0 | 1 (8.3) | 2 (13.3) |
| Catheter site pain | 0 | 1 (16.7) | 0 | 0 | 0 | 0 | 1 (3.6) | 0 | 0 | 1 (2.6) | 0 | 0 | 2 (28.6) | 2 (16.7) | 2 (13.3) |
| Gingivitis | 0 | 0 | 0 | 0 | 0 | 0 | 0 | 0 | 0 | 0 | 0 | 0 | 2 (28.6) | 2 (16.7) | 2 (13.3) |
| Dizziness | 0 | 0 | 0 | 0 | 0 | 0 | 0 | 0 | 0 | 0 | 0 | 2 (28.6) | 2 (16.7) | 2 (13.3) | |
| Nausea | 1 (10.0) | 0 | 0 | 2 (40.0) | 1 (20.0) | 0 | 3 (10.7) | 0 | 1 (20.0) | 5 (13.2) | 0 | 0 | 1 (14.3) | 1 (8.3) | 1 (6.7) |
| Gastrointestinal sounds abnormal | 0 | 0 | 0 | 1 (20.0) | 1 (20.0) | 0 | 2 (7.1) | 0 | 0 | 2 (5.3) | 0 | 0 | 1 (14.3) | 1 (8.3) | 1 (6.7) |
| Presyncope | 0 | 0 | 1 (16.7) | 0 | 0 | 1 (16.7) | 2 (7.1) | 0 | 0 | 2 (5.3) | 0 | 0 | 1 (14.3) | 1 (8.3) | 1 (6.7) |
| Medical device site dermatitis | 0 | 0 | 0 | 0 | 0 | 2 (33.3) | 2 (7.1) | 0 | 0 | 2 (5.3) | 0 | 0 | 0 | 0 | |
| Back pain | 1 (10.0) | 0 | 0 | 1 (20.0) | 0 | 0 | 1 (3.6) | 1 (50.0) | 0 | 2 (5.3) | 0 | 0 | 0 | 0 | 0 |
| Myalgia | 0 | 0 | 0 | 1 (20.0) | 0 | 1 (16.7) | 2 (7.1) | 0 | 0 | 2 (5.3) | 0 | 0 | 0 | 0 | 0 |
Abbreviations: MAD, multiple‐ascending dose; SAD, single‐ascending dose; TEAE, treatment‐emergent adverse event.
Data are number (no.) of subjects (%), except for total no. of TEAEs.
TEAEs were coded as preferred terms from the Medical Dictionary for Regulatory Activities (MedDRA) version 23.1.
Bold lettering indicates overall totals of TEAEs in ≥2 subjects in either the SAD or the MAD.
In the MAD stage, 10 subjects (83.3%) reported 42 TEAEs in the GDC‐8264‐treated groups, and three (100%) subjects reported five TEAEs in the placebo‐treated group (Table 2). All TEAEs were mild. The most frequently reported TEAEs (in ~13%–20% per cohort) were abdominal pain, diarrhea, dyspepsia, catheter site pain, gingivitis, somnolence, dizziness, and headache.
In both the SAD and MAD stages, there were no deaths or SAEs, and no subjects discontinued from the study due to a TEAE (Table 2). The percentages of subjects reporting TEAEs in placebo‐treated and GDC‐8264‐treated groups were similar. There were no significant changes in clinical laboratory results, vital signs, ECGs, or physical examinations. All TEAEs were transient and resolved by follow‐up, except for one subject in the MAD (100‐mg GDC‐8264 q.d. cohort) who reported earlobe inflammation that lasted for 14 days and was recovering at follow‐up.
GDC‐8264 pharmacokinetics (SAD stage)
GDC‐8264 was rapidly absorbed after administration as single oral doses in the fasted state (Table 3, Figure 2a). Individual maximum GDC‐8264 concentrations were reached between 1 and 6 h postdose (Table 3). The median times to attain maximum plasma concentration (T max) for the 5‐ and 25‐mg doses (suspension formulation) were shorter (1.3–1.9 h) compared with the 75–225‐mg doses (3–4 h; tablet formulation). The geometric mean terminal elimination half‐life (t 1/2), apparent total body clearance, and apparent volume of distribution did not vary by dose level or formulation. All PK parameters had low to moderate interindividual variability (6.6% to 54.2%). After a high‐fat meal, median T max was delayed by 1 h (median, 4 h, range, 2–6 h) compared to the fasted state (median, 3 h, range, 1.5–6 h; Table 3). C max was ~21% higher in the fed state versus the fasted state while total exposure (AUC up to the time of the last quantifiable concentration [AUC0‐last] and AUC from zero to infinity [AUC0‐inf]) was comparable in both states (Table S1). A dose‐proportionality assessment (Table 4) performed after administration of the GDC‐8264 tablet formulation under the fasted state demonstrated that the exposure, expressed as C max, AUC0‐last, and AUC0‐inf, all increased in a dose‐proportional manner.
TABLE 3.
Plasma PK parameters for GDC‐8264 in the SAD (including FE) and MAD stages.
| SAD | n | C max (ng/mL) | T max a (h) | C24 (ng/mL) | AUC0‐24 (ng•h/mL) | AUC0‐inf (ng•h/mL) | t 1/2 (h) | CL/F (L/h) | V z/F (L) |
|---|---|---|---|---|---|---|---|---|---|
| 5 mg | 6 | 98.6 (18.7) | 1.29 (1.00–1.50) | 13.5 (29.4) | 831 (9.8) | 1061 (10.0) | 12.1 (19.5) | 4.71 (10.0) | 82.1 (19.5) |
| 25 mg | 6 | 479 (25.1) | 1.94 (1.00–3.00) | 49.1 (52.9) | 4111 (31.3) | 4920 (30.3) | 10.4 (30.5) | 5.08 (30.3) | 76.1 (38.9) |
| 75 mg, fasted | 5 | 783 (23.0) | 3.00 (1.52–6.03) | 199 (27.3) | 9825 (12.9) | 13,168 (19.0) | 11.2 (27.5) | 5.70 (19.0) | 92.3 (12.9) |
| 75 mg, high fat | 5 | 946 (25.7) | 4.00 (2.00–6.00) | 210 (26.8) | 9401 (18.0) | 12,961 (23.2) | 13.3 (18.0) | 5.79 (23.2) | 111 (15.3) |
| 150 mg | 5 | 1118 (32.7) | 4.00 (2.50–4.00) | 535 (22.0) | 18,016 (25.8) | 27,786 (18.4) | 12.9 (18.4) | 5.40 (18.4) | 101 (22.9) |
| 225 mg | 6 | 1829 (18.5) | 3.50 (1.50–4.07) | 924 (10.7) | 31,629 (11.5) | 46,787 (6.7) | 11.9 (14.0) | 4.81 (6.7) | 82.3 (16.7) |
| MAD | n | C max (ng/mL) | T max a (h) | C24 (ng/mL) | AUC0‐τ (ng•h/mL) | ARCmax | ARAUC | t 1/2 (h) | CL/F (L/h) | V z/F (L) |
|---|---|---|---|---|---|---|---|---|---|---|
| 50 mg Day 1 | 5 | 610 (28.2) | 3.00 (1.50–4.00) | 151 (6.0) | 7267 (13.1) | – | – | – | – | – |
| 50 mg Day 14 | 5 | 836 (24.7) | 2.50 (0.52–4.00) | – | 10,078 (14.1) | 1.37 (18.3) | 1.39 (4.8) | 11.2 (12.2) | 4.96 (14.1) | 80.3 (26.4) |
| 100 mg Day 1 | 7 | 1181 (37.2) | 3.00 (1.00–12.00) | 342 (37.6) | 16,167 (28.0) | – | – | – | – | – |
| 100 mg Day 14 | 7 | 1665 (28.8) | 2.50 (1.00–4.00) | – | 21,190 (15.2) | 1.41 (27.3) | 1.31 (17.7) | 11.4 (18.6) | 4.72 (15.2) | 77.4 (22.3) |
Note: Data are geometric mean (geometric CV%), except where otherwise indicated.
Abbreviations: ARAUC, accumulation ratio based on AUC0‐τ of day 14 versus day 1; ARCmax, accumulation ratio based on C max of day 14 versus day 1; AUC0‐τ, area under the plasma concentration‐time curve over a dosing interval tau (τ); AUC0‐24, area under the plasma concentration‐time curve from time 0 to 24 h; AUC0‐inf, area under the plasma concentration‐time curve from time 0 to infinity; C24, plasma concentration at 24 h postdose; C max, maximum observed plasma concentration; CL/F, apparent total body clearance, calculated as dose/AUC0‐inf; CV, coefficient of variation; MAD, multiple ascending dose; PK, pharmacokinetic; SAD, single ascending dose; t 1/2, terminal elimination half‐life; T max, time to attain maximum observed plasma concentration; V z/F, apparent volume of distribution at terminal phase.
Data are median (range).
FIGURE 2.
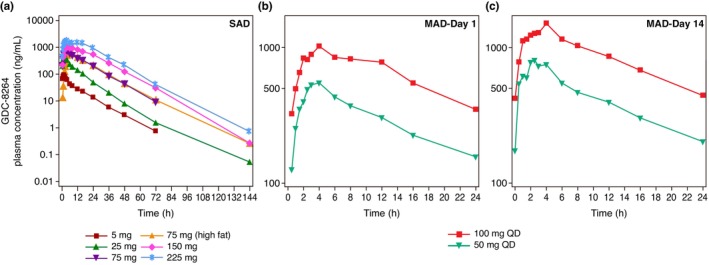
Geometric mean plasma concentration‐time profiles of GDC‐8264 (semi‐logarithmic scale) in the (a) SAD, (b) MAD‐day 1, and (c) MAD‐day 14. MAD, multiple ascending dose; SAD, single ascending dose.
TABLE 4.
Power model analysis of GDC‐8264 (tablet formulation) dose‐proportionality in the SAD stage.
| Parameter | Effect | Estimate | SE | 95% CI |
|---|---|---|---|---|
| C max | Intercept | 3.3599 | 0.6874 | |
| Slope (beta) | 0.7547 | 0.1384 | (0.4578, 1.0515) | |
| AUC0‐last | Intercept | 4.4212 | 0.3911 | |
| Slope (beta) | 1.1654 | 0.0787 | (0.9965, 1.3342) | |
| AUC0‐inf | Intercept | 4.5120 | 0.4034 | |
| Slope (beta) | 1.1489 | 0.0812 | (0.9746, 1.3231) |
Note: Dose proportionality was evaluated using the power model on log‐transformed PK parameters. Model: log(parameter) = intercept + slope*log(dose) + error. A point estimate and 95% CI were produced for the slope. A slope of 1 (i.e., a 95% CI containing 1) indicates that no evidence of deviation from dose proportionality was found.
Abbreviations: AUC0‐inf, area under the concentration‐time curve from zero to infinity; AUC0‐last, AUC up to the time of the last quantifiable concentration; CI, confidence interval; C max, maximum plasma concentration; PK, pharmacokinetic; SAD, single‐ascending dose; SE, standard error.
Renal excretion of unchanged GDC‐8264 was low in all SAD cohorts (Table S2). For all doses, the mean fraction of the GDC‐8264 dose that was excreted unchanged into the urine from 0–72 h (fe0‐72h) was similar and ranged from 0.16% (150 mg GDC‐8264) to 0.22% (75 and 225 mg GDC‐8264). Geometric mean renal clearance of GDC‐8264 during the dosing interval (CLr) was minimal and similar for all doses, ranging from 0.008 L/h (5 mg GDC‐8264) to 0.011 L/h (75 mg GDC‐8264) after a high‐fat meal.
GDC‐8264 pharmacokinetics (MAD stage)
GDC‐8264 was rapidly absorbed after single and multiple dose administration. The median T max after the first dose on day 1 was 3 h and at steady‐state on day 14 was 2.5 h (Table 3) for both 50‐ and 100‐mg doses. Geometric mean C max and AUC increased with dose (Table 3, Figure 2b,c). Dose‐normalized C max and AUC were similar for both doses on day 1 and day 14, suggesting a dose‐proportional increase. The geometric mean t 1/2 was similar for both doses (50 mg q.d.: 11.2 h and 100 mg q.d.: 11.4 h), and was similar to t 1/2 after single doses (10–13 h), indicating time‐independent PKs. The interindividual variability of all PK parameters was low to moderate (coefficient of variation percentage [CV%]: 4.8%–33.0%). Steady‐state trough concentrations were observed on day 4 after daily doses. After multiple oral doses for 14 days, C max and AUC showed minimal accumulation; the accumulation ratio (AR) from day 1 to day 14 ranged from 1.31 to 1.39 for AUC and from 1.37 to 1.41 for C max, consistent with the half‐life.
Renal excretion after multiple doses of GDC‐8264 for 14 days was also low (Table S3). For both doses, mean fe0‐𝛕 was 0.14% after dosing on day 1 and 0.20% after the last dose. Geometric mean CLr0‐𝛕 was ~0.008 L/h for both doses and remained comparable between day 1 and day 14.
Pharmacodynamics
Inflammation and cell death signaling pathways involving RIP1 are not thought to be active in normal healthy adults. Therefore, to evaluate the inhibitory activity of GDC‐8264, production of the RIP1‐inducible biomarker CCL4 6 was measured after ex vivo stimulation of the necroptosis pathway with TBZ (TNF‐α/ bivalent compound 6 (BV6; IAP antagonist)/Z‐VAD (carbobenzoxy‐valyl‐alanyl‐aspartyl‐[O‐methyl]‐fluoromethylketone)] in whole blood from the SAD and MAD participants. Inhibition of CCL4 was calculated by first normalizing CCL4 levels to baseline and then adjusting to the maximum inhibition and standard deviation (SD) per cohort.
Samples from all SAD cohorts collected at 1.5 h postdose showed greater than 90% inhibition of CCL4 (Figure 3a). This inhibition was sustained through the 48‐h timepoint for the 5‐ and 25‐mg GDC‐8264 cohorts, and through the 72‐h timepoint for the 75‐, 150‐, and 225‐mg GDC‐8264 cohorts. At the 144‐h timepoint, the 150‐mg cohort showed levels of CCL4 comparable to the placebo cohort, indicating complete loss of inhibition. In the 225‐mg cohort, levels of CCL4 had not returned to baseline at 144 h, as the group mean inhibition of CCL4 production at 144 h was 49% ± 9% compared with 17% ± 3% inhibition in the placebo cohort.
FIGURE 3.
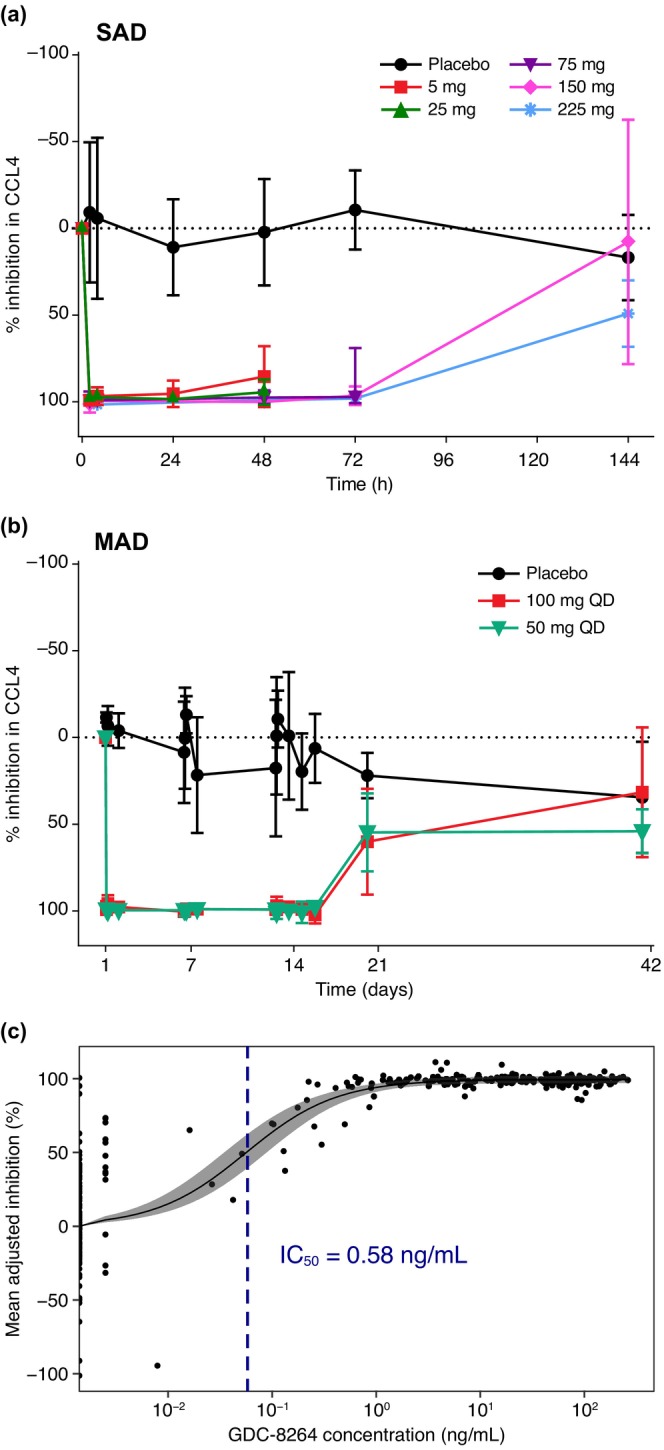
Inhibition of CCL4 levels in the human whole blood assay in (a) SAD and (b) MAD cohorts, and (c) PK‐PD modeling to determine the GDC‐8264 IC50. (a, b) Inhibition of CCL4 levels is shown as the percentage (mean ± SD) of CCL4 inhibition for each cohort, calculated by first normalizing CCL4 levels to baseline and then adjusting to maximum inhibition per cohort. Timepoints for each SAD cohort in (a) are: 5 mg, 25 mg: day 1–day 3 (0–48 h); 75 mg: day 1–day 4 (0–72 h); and 150 mg, 225 mg: day 1–day 7 (0–144 h). Placebo is an average of all SAD cohorts at each respective timepoint. Timeframes shown in (b) for both MAD cohorts are days 1–14 and days 21–42 (follow‐up). Placebo subjects (n = 3) are grouped from both MAD cohorts. (c) Time‐matched GDC‐8264 plasma concentrations and percent inhibition of CCL4 (normalized to baseline and adjusted to the maximum inhibition) were modeled to determine the IC50 of target inhibition/engagement. The solid circles are observed data, the solid line is the estimated E max model fit, the shaded region is the 95% credible interval of parameters, and the dotted blue line is the estimated IC50. E max, maximum effect; IC50, half‐maximal inhibitory concentration; MAD, multiple ascending dose; PD, pharmacodynamic; PK, pharmacokinetic; SAD, single ascending dose.
CCL4 data for both MAD cohorts (50 mg q.d. and 100 mg q.d.) demonstrated greater than 90% sustained inhibition for the 14‐day dosing period and for 7 days after the last dose (day 21 overall; Figure 3b). At day 42 (28 days after the last dose), both MAD cohorts showed similar percent inhibition to the placebo cohort, indicating that the inhibition was reversible. The observed variability could be attributed to participant‐to‐participant variation, as well as participant longitudinal variability in CCL4 levels, which was also observed in in vitro experiments (data not shown).
PK‐PD modeling
PK‐PD modeling demonstrated that PD effects in the blood, as measured by the level of CCL4 inhibition, were dependent on GDC‐8264 concentrations. The model estimated that the IC50 was 0.58 ng/mL (Figure 3c). The maximal inhibition of the target value was estimated to be 99.4%.
DISCUSSION
GDC‐8264 was well‐tolerated in this first‐in‐human, randomized, double‐blind, placebo‐controlled study exploring safety, tolerability, PKs, and PDs of GDC‐8264 following single and multiple oral dose administrations. Systemic exposure to GDC‐8264 increased in proportion to dose when administered as a tablet, and the PKs of GDC‐8264 was time‐independent and showed minimal accumulation. A high‐fat meal had no significant effect on GDC‐8264 exposure, and there was minimal renal excretion of GDC‐8264.
Inhibition of the RIP1 pathway is only expected to produce effects when the pathway is active; therefore, healthy volunteers are not expected to show observable alterations in physiology, even with complete RIP1 kinase inhibition. The TEAE profile of GDC‐8264 in this study supported this prediction, showing no imbalance of TEAEs over placebo. Furthermore, the TEAEs in GDC‐8264‐treated arms were mild events, consistent with those commonly reported in the placebo arms of many clinical studies with subject confinement. 27 There were no notable changes to vital signs or laboratory evaluations in the subjects. Overall, both single doses up to 225 mg and 14 days of daily dosing up to 100 mg were safe and well tolerated and led to GDC‐8264 exposures that were associated with robust RIP1 inhibition, as shown by the ex vivo whole blood assay. This safety profile may provide further evidence that the significant TEAEs (e.g., liver toxicity for DNL104 22 ) observed in healthy volunteer clinical trials of some other RIP1 inhibitors were principally due to off‐target effects specific to those compounds, as opposed to on‐target effects of RIP1 inhibition. However, the possibility that some patient populations may have on‐target safety liabilities that are not apparent in healthy volunteers cannot be ruled out. Data to date do not clearly point to what such a liability might be, and careful monitoring in the future will be necessary to address this.
GDC‐8264 exhibited PKs that were considered favorable for future clinical development. GDC‐8264 is readily absorbed with a median T max of 2.5–4 h and has dose‐proportional exposure over the range of potential therapeutic doses, allowing for predictable titration of dosage for the tablet formulation. The PKs were also time‐independent, leading to predictable accumulation after multiple, steady‐state doses (AR, 1.3–1.4), which facilitates future clinical studies. A mean half‐life of 11–13 h for the tablet formulation, allows for once daily administration. Furthermore, the effect of food on the PKs of GDC‐8264 was not significant, allowing administration of GDC‐8264 with or without food.
The ex vivo stimulation assay confirmed that RIP1 activity was blocked in blood from subjects dosed with GDC‐8264, as indicated by the rapid and complete inhibition of CCL4 release. Although maximum inhibition occurred even at the 5‐mg dose level, a concentration‐response relationship (i.e., a PK‐PD relationship) could be observed as GDC‐8264 was cleared from circulation and RIP1 inhibition diminished and returned to baseline. Similarly, in MAD cohorts, sustained inhibition of CCL4 occurred during the 14‐day dosing period; by 28 days after dosing completed, the percent inhibition had returned to baseline, indicating that the inhibition was reversible. Sustained CCL4 inhibition even beyond 7 days after the last dose (day 21) in the MAD cohort indicated that GDC‐8264 was highly potent. Additionally, because the systemic concentrations of GDC‐8264 observed under the multiple‐dosing scenario are orders of magnitude above the IC50, assuming adequate target tissue distribution, the concentrations achieved after oral dosing in this study are expected to produce physiological responses in the tissues of patients. Depending on the maximum and minimum amounts of inhibition required for physiological response, dosing of GDC‐8264 less frequently than once daily may also be explored.
Previously tested RIP1 inhibitors have been hampered with a short half‐life, poor absorption, or significant off‐target toxicity, 22 , 26 and have not demonstrated robust efficacy in various diseases (e.g., psoriasis, rheumatoid arthritis, and ulcerative colitis). 23 , 24 , 25 The extent to which RIP1‐dependent cell death pathways drive various diseases currently remains unclear. Because RIP1 activation in individual cells is an early decision event that ultimately leads to the irreversible events of necroptosis or apoptosis, early and sustained inhibition in the affected tissues is likely required for a therapeutic effect. 8 RIP1 inhibitors, such as GDC‐8264, with excellent potency, good safety and tolerability, and favorable PK properties that enable complete and lasting inhibition of RIP1 activity in target tissues may help thoroughly assess the importance of RIP1 in several disease states and thus lead to more effective treatments.
AUTHOR CONTRIBUTIONS
N.S.J., S.Ksh., V.M., V.R., F.D., and Y.C. wrote the manuscript. S.Ksh., J.M., D.V., L.P., Y.C., A.N.L., and M.E.R. designed the research. S.Ksh., V.R., S.K., and A.N.L. performed the research; N.S.J., S.Ksh., V.M., V.R., F.D., L.M., H.D., S.K., and A.N.L. analyzed the data. S.K. contributed new reagents/analytical tools.
FUNDING INFORMATION
Genentech, Inc. supported this study.
CONFLICT OF INTEREST STATEMENT
All authors are or were employees of Genentech, Inc., a member of the Roche group, and own/owned Roche stock and/or stock options when this work was performed. Genentech, Inc. participated in the design of the study; the collection, analysis, and interpretation of the data; writing of the report, and the decision to submit the article for publication.
Supporting information
Appendix S1
Table S1
Table S2
Table S3
ACKNOWLEDGMENTS
We would like to thank all the subjects who participated in this trial; Jeroen van de Wetering and the site staff at PRA Health Sciences (The Netherlands) for their assistance with this trial; and Tom Chu for assistance with drug safety analyses. Editing and writing assistance was provided by Deborah Solymar and was funded by Genentech, Inc.
Jones NS, Kshirsagar S, Mohanan V, et al. A phase I, randomized, ascending‐dose study to assess safety, pharmacokinetics, and activity of GDC‐8264, a RIP1 inhibitor, in healthy volunteers. Clin Transl Sci. 2023;16:1997‐2009. doi: 10.1111/cts.13607
DATA AVAILABILITY STATEMENT
For eligible studies, qualified researchers may request access to individual patient‐level clinical data through a data request platform. At the time of writing, this request platform is Vivli: https://vivli.org/ourmember/roche/. For up‐to‐date details on Roche's Global Policy on the Sharing of Clinical Information and how to request access to related clinical study documents, see here: https://www.roche.com/innovation/process/clinical‐trials/data‐sharing/. Anonymized records for individual patients across more than one data source external to Roche cannot, and should not, be linked due to a potential increase in risk of patient re‐identification.
REFERENCES
- 1. Vanden Berghe T, Linkermann A, Jouan‐Lanhouet S, Walczak H, Vandenabeele P. Regulated necrosis: the expanding network of non‐apoptotic cell death pathways. Nat Rev Mol Cell Biol. 2014;15:135‐147. [DOI] [PubMed] [Google Scholar]
- 2. Webster JD, Vucic D. The balance of TNF mediated pathways regulates inflammatory cell death signaling in healthy and diseased tissues. Front Cell Dev Biol. 2020;8:365. doi: 10.3389/fcell.2020.00365 [DOI] [PMC free article] [PubMed] [Google Scholar]
- 3. Gunther C, Martini E, Wittkopf N, et al. Caspase‐8 regulates TNF‐alpha‐induced epithelial necroptosis and terminal ileitis. Nature. 2011;477:335‐339. [DOI] [PMC free article] [PubMed] [Google Scholar]
- 4. Newton K, Dugger DL, Wickliffe KE, et al. Activity of protein kinase RIPK3 determines whether cells die by necroptosis or apoptosis. Science. 2014;343:1357‐1360. [DOI] [PubMed] [Google Scholar]
- 5. Newton K. RIPK1 and RIPK3: critical regulators of inflammation and cell death. Trends Cell Biol. 2015;25:347‐353. [DOI] [PubMed] [Google Scholar]
- 6. Vlantis K, Wullaert A, Polykratis A, et al. NEMO prevents RIP kinase 1‐mediated epithelial cell death and chronic intestinal inflammation by NF‐κB‐dependent and ‐independent functions. Immunity. 2016;44:553‐567. [DOI] [PMC free article] [PubMed] [Google Scholar]
- 7. Newton K. Multitasking kinase RIPK1 regulates cell death and inflammation. Cold Spring Harb Perspect Biol. 2020;12:a036368. doi: 10.1101/cshperspect.a036368 [DOI] [PMC free article] [PubMed] [Google Scholar]
- 8. Mifflin L, Ofengeim D, Yuan J. Receptor‐interacting protein kinase 1 (RIPK1) as a therapeutic target. Nat Rev Drug Discov. 2020;19:553‐571. [DOI] [PMC free article] [PubMed] [Google Scholar]
- 9. Newton K, Dugger DL, Maltzman A, et al. RIPK3 deficiency or catalytically inactive RIPK1 provides greater benefit than MLKL deficiency in mouse models of inflammation and tissue injury. Cell Death Differ. 2016;23:1565‐1576. [DOI] [PMC free article] [PubMed] [Google Scholar]
- 10. Patel S, Webster JD, Varfolomeev E, et al. RIP1 inhibition blocks inflammatory diseases but not tumor growth or metastases. Cell Death Differ. 2020;27:151‐175. [DOI] [PMC free article] [PubMed] [Google Scholar]
- 11. Kumari S, Redouane Y, Lopez‐Mosqueda J, et al. Sharpin prevents skin inflammation by inhibiting TNFR1‐induced keratinocyte apoptosis. Elife. 2014;3:e03422. doi: 10.7554/eLife.03422 [DOI] [PMC free article] [PubMed] [Google Scholar]
- 12. Degterev A, Huang Z, Boyce M, et al. Chemical inhibitor of nonapoptotic cell death with therapeutic potential for ischemic brain injury. Nat Chem Biol. 2005;1:112‐119. [DOI] [PubMed] [Google Scholar]
- 13. Martin‐Sanchez D, Fontecha‐Barriuso M, Carrasco S, et al. TWEAK and RIPK1 mediate a second wave of cell death during AKI. Proc Natl Acad Sci U S A. 2018;115:4182‐4187. [DOI] [PMC free article] [PubMed] [Google Scholar]
- 14. Becker C, Watson AJ. Neurath MF complex roles of caspases in the pathogenesis of inflammatory bowel disease. Gastroenterology. 2013;144:283‐293. [DOI] [PubMed] [Google Scholar]
- 15. Nunes T, Bernardazzi C, de Souza HS. Cell death and inflammatory bowel diseases: apoptosis, necrosis, and autophagy in the intestinal epithelium. Biomed Res Int. 2014;2014:218493. doi: 10.1155/2014/218493 [DOI] [PMC free article] [PubMed] [Google Scholar]
- 16. Yu X, Ma H, Li B, et al. A novel RIPK1 inhibitor reduces GVHD in mice via a nonimmunosuppressive mechanism that restores intestinal homeostasis. Blood. 2023;141:1070‐1086. [DOI] [PubMed] [Google Scholar]
- 17. Linkermann A, Bräsen JH, Himmerkus N, et al. Rip1 (receptor‐interacting protein kinase 1) mediates necroptosis and contributes to renal ischemia/reperfusion injury. Kidney Int. 2012;81:751‐761. [DOI] [PubMed] [Google Scholar]
- 18. Berger SB, Kasparcova V, Hoffman S, et al. Cutting edge: RIP1 kinase activity is dispensable for normal development but is a key regulator of inflammation in SHARPIN‐deficient mice. J Immunol. 2014;192:5476‐5480. [DOI] [PMC free article] [PubMed] [Google Scholar]
- 19. Webster JD, Kwon YC, Park S, et al. RIP1 kinase activity is critical for skin inflammation but not for viral propagation. J Leukoc Biol. 2020;107:941‐952. [DOI] [PMC free article] [PubMed] [Google Scholar]
- 20. Stark K, Goncharov T, Varfolomeev E, et al. Genetic inactivation of RIP1 kinase activity in rats protects against ischemic brain injury. Cell Death Dis. 2021;2:379. doi: 10.1038/s41419-021-03651-6 [DOI] [PMC free article] [PubMed] [Google Scholar]
- 21. Weisel K, Scott NE, Tompson DJ, et al. Randomized clinical study of safety, pharmacokinetics, and pharmacodynamics of RIPK1 inhibitor GSK2982772 in healthy volunteers. Pharmacol Res Perspect. 2017;5:e00365. doi: 10.1002/prp2.365 [DOI] [PMC free article] [PubMed] [Google Scholar]
- 22. Grievink HW, Heuberger JAAC, Huang F, et al. DNL104, a centrally penetrant RIPK1 inhibitor, inhibits RIP1 kinase phosphorylation in a randomized phase I ascending dose study in healthy volunteers. Clin Pharmacol Ther. 2020;107:406‐414. [DOI] [PubMed] [Google Scholar]
- 23. Weisel K, Berger S, Papp K, et al. Response to inhibition of receptor‐interacting protein kinase 1 (RIPK1) in active plaque psoriasis: a randomized placebo‐controlled study. Clin Pharmacol Ther. 2020;108:808‐816. [DOI] [PMC free article] [PubMed] [Google Scholar]
- 24. Weisel K, Berger S, Thorn K, et al. A randomized, placebo‐controlled experimental medicine study of RIPK1 inhibitor GSK2982772 in patients with moderate to severe rheumatoid arthritis. Arthritis Res Ther. 2021;23:85. doi: 10.1186/s13075-021-02468-0 [DOI] [PMC free article] [PubMed] [Google Scholar]
- 25. Weisel K, Scott N, Berger S, et al. A randomised, placebo‐controlled study of RIPK1 inhibitor GSK2982772 in patients with active ulcerative colitis. BMJ Open Gastroenterol. 2021;8:e000680. doi: 10.1136/bmjgast-2021-000680 [DOI] [PMC free article] [PubMed] [Google Scholar]
- 26. Vissers MFJM, Heuberger JAAC, Groeneveld GJ, et al. Safety, pharmacokinetics and target engagement of novel RIPK1 inhibitor SAR443060 (DNL747) for neurodegenerative disorders: randomized, placebo‐controlled, double‐blind phase I/Ib studies in healthy subjects and patients. Clin Transl Sci. 2022;15:2010‐2023. [DOI] [PMC free article] [PubMed] [Google Scholar]
- 27. Emanuel EJ, Bedarida G, Macci K, Gabler NB, Rid A, Wendler D. Quantifying the risks of non‐oncology phase I research in healthy volunteers: meta‐analysis of phase I studies. BMJ. 2015;350:h3271. doi: 10.1136/bmj.h3271 [DOI] [PMC free article] [PubMed] [Google Scholar]
Associated Data
This section collects any data citations, data availability statements, or supplementary materials included in this article.
Supplementary Materials
Appendix S1
Table S1
Table S2
Table S3
Data Availability Statement
For eligible studies, qualified researchers may request access to individual patient‐level clinical data through a data request platform. At the time of writing, this request platform is Vivli: https://vivli.org/ourmember/roche/. For up‐to‐date details on Roche's Global Policy on the Sharing of Clinical Information and how to request access to related clinical study documents, see here: https://www.roche.com/innovation/process/clinical‐trials/data‐sharing/. Anonymized records for individual patients across more than one data source external to Roche cannot, and should not, be linked due to a potential increase in risk of patient re‐identification.