

Abstract
The purpose of this study was to investigate the safety, tolerability, pharmacokinetics, and pharmacodynamics of SN1011, a novel Bruton tyrosine kinase (BTK) inhibitor, and food effects in healthy subjects. In this phase I trial, subjects received single ascending doses (SADs) of SN1011 (100 to 800 mg), multiple ascending doses (MADs) of SN1011 (200 to 600 mg), or placebo q.d. Additionally, 12 subjects randomly received a single dose of SN1011 600 mg under fasting states and then fed states, vice versa. Safety was assessed per Common Terminology Criteria for Adverse Events version 5.0. Pharmacokinetic parameters were calculated by noncompartmental analysis and BTK receptor occupancy in peripheral blood monocytes was determined. Seventy‐one healthy subjects were dosed in five SAD cohorts, three MAD cohorts, and one food effect cohort, with 57 receiving SN1011 and 14 receiving placebo. No serious adverse events (AEs) were reported. There was no correlation between AE occurrences and SN1011 exposure. The three most frequent AEs with SN1011 were increased blood triglycerides, decreased neutrophil count, and decreased leucocyte count. SN1011 exhibited a dose‐proportional increase in maximum plasma concentration and area under the time concentration curve following single and multiple dose administrations, with an accumulation ratio of 1.5 to 2.2 after multiple dose administrations. No difference in SN1011 exposure was observed between fed states. BTK receptor occupancy remained above 83% over 24 h after single administration and remained above 80% for the MAD groups for 10 days of continuous q.d. administration. SN1011 was well‐tolerated and safe after single or multiple exposures to healthy subjects, supporting further clinical development of SN1011 for treatment of autoimmune diseases.
Study Highlights.
WHAT IS THE CURRENT KNOWLEDGE ON THE TOPIC?
Bruton tyrosine kinase (BTK) is a key tyrosine kinase in B cell receptor (BCR) signaling and has become a prime therapeutic target in a variety of diseases including autoimmune diseases.
WHAT QUESTION DID THIS STUDY ADDRESS?
This phase I study aimed to investigate the safety, tolerability, pharmacokinetic (PK), and pharmacodynamic characteristics of single and multiple ascending doses of SN1011, a novel third‐generation BTK inhibitor that abrogates full BTK activation by blocking BCR signaling, and food effects on SN1011 in healthy adult subjects.
WHAT DOES THIS STUDY ADD TO OUR KNOWLEDGE?
SN1011 is well‐tolerated and safe after single or multiple exposures to healthy subjects and food has no effect on SN1011 PKs.
HOW MIGHT THIS CHANGE CLINICAL PHARMACOLOGY AND TRANSLATIONAL SCIENCE?
The findings support further clinical development of SN1011, which could lead to improved treatment of autoimmune diseases.
INTRODUCTION
Bruton tyrosine kinase (BTK), a central regulator of B cell development, differentiation, and survival, is expressed in cells of all hematopoietic lineages except plasma cells. 1 , 2 , 3 , 4 Activated BTK mediates pro‐inflammatory signaling and drives aberrant expression of inflammatory cytokines (TNF‐α and IL‐1β). 5 , 6 The kinase is also involved in signaling of cytokine receptors and chemokine receptors like toll‐like receptors and integrins. 7 As BTK acts as a platform for bringing together a plethora of signaling proteins, it has become a prime therapeutic target in a variety of diseases including autoimmune diseases. Approximately 50 BTK inhibitors are under development and several others, including ibrutinib and acalabrutinib, have been approved for multiple indications, mostly in blood cancer. 8 In addition, BTK inhibitors have been studied for the treatment of autoimmune diseases. Evobrutinib, a selective, covalent, oral BTK inhibitor, has shown promising activities for relapsing multiple sclerosis in a randomized, phase II trial. 9 First‐generation BTK inhibitors irreversibly form covalent bond with cysteine 481 within the ATP‐binding site of the kinase domain and sustain BTK occupancy and inhibition. 10 However, prolonged BTK inhibition compromises immune response, whereas high off‐target effect raises safety concern. Second‐generation BTK inhibitors non‐covalently bind to different BTK‐specific pockets with hydrogen bonds, ionic bonds, or hydrophobic forces and may bypass mutations in cysteine 481. 11 The weak reversible binding could lower off‐target effects of BTK inhibitors, thus decreasing the toxicities of chronic BTK inhibition. However, diminished BTK inhibition poses concern over its efficacy. A phase II trial of orelabrutinib, a second‐generation BTK inhibitor, is currently being conducted in patients with neuromyelitis optica spectrum disorder (NCT05284175).
SN101 [5‐amino‐3‐(4‐((5‐chloro‐2‐pyridinyl)oxy)phenyl)‐1‐((6R)‐4‐cyano‐4‐azaspiro[2.5]octan‐6‐yl)‐1H‐pyrazole‐4‐carboxamide] is a novel third‐generation BTK inhibitor and selectively forms a reversible covalent bond with cysteine 481 in the BTK kinase domain (Figure S1), abrogating full BTK activation by inhibiting autophosphorylation at tyrosine 223 and blocking BCR signaling. The covalent binding mechanism ensures strong BTK inhibition, whereas its reversibility prevents prolonged BTK inhibition that would compromise immune response. Our in vitro studies showed that SN1011 inhibited BTK activities, with an half‐maximal inhibitory concentration between 0.5 and 4 nM. Additionally, SN1011 exhibited 700‐fold greater selectivity for BTK over other kinases (EGFR, ITK, Lck, SRC, LYN, and JAK3), greatly lessening off‐target effects. SN1011 also inhibited BTK‐related signaling pathways in vitro, including CD69 and CD86 upregulation, calcium release, and IgM‐induced release of pro‐inflammatory cytokines. It further demonstrated promising activities in animal models of experimental autoimmune encephalomyelitis and collagen‐induced arthritis. SN1011 had an acceptable safety profile in rats and beagles. Safety of SN1011 was further confirmed in healthy subjects in an early‐stage clinical trial (NCT04041544), showing that SN1011 is safe and well‐tolerated in humans and warrants exploration of higher doses.
This phase I study investigated the safety, tolerability, pharmacokinetic (PK), and pharmacodynamic (PD) characteristics of single (single ascending doses [SADs]) and multiple ascending doses [MADs] of SN1011 and food effects on SN1011 in healthy adult Chinese subjects to provide a basis for the development of recommended dose for further studies.
METHODS
Subjects
This phase I trial (Study No.: SN1011‐102) was conducted at Shuguang Hospital Affiliated to Shanghai University of Traditional Chinese Medicine, Shanghai, China, between January 11, 2021, and July 31, 2021. Healthy subjects aged between 18 and 45 years who had a body mass index between 19.0 and 25.0 kg/m2 were eligible. Health status was determined by medical history, previous and concomitant medications, vital signs, physical examination, laboratory study, and 12‐lead electrocardiogram (ECG) assessments during screening. We excluded subjects with a history of liver or biliary tract abnormalities or having any abnormal liver function test results at the time of screening or with a history of allergy to SN1011 capsules or other BTK inhibitors. The eligibility criteria are detailed in the study protocol.
The study was conducted in accordance with the Declaration of Helsinki and the International Conference on Harmonization Guidance for Good Clinical Practice. The study protocol was approved by Shuguang Hospital Ethics Committee, and all subjects provided written informed consent before participating in any study‐related activities. The study is registered with ChinaDrugTrials.org.cn (CTR20202676) and was sponsored by SinoMab BioScience Limited (MediNexus Pharma [Suzhou] Limited).
Study design and treatments
The trial had three parts: an SAD part (part A), an MAD part (part B), and a food effect part (part C; Figure S2). Parts A and B were designed as double blind, placebo controlled, randomized, ascending dose studies. A computer‐generated randomization schedule was used, and the block randomization method was used (Supplementary Methods). In part A, three subjects received a single dose of SN1011 100 mg, and eight subjects each in the other four cohorts randomly received a single dose of SN1011 200, 400, 600, or 800 mg (6 per cohort), or matching placebo (2 per cohort) under fasting states. Upon completion of safety observation of subjects receiving SN1011 400 mg, part B was started. Three cohorts of eight subjects randomly received MADs of SN1011 200, 400, or 600 mg q.d. (6 per cohort) or placebo q.d. (2 per cohort) for 10 consecutive days. Dose escalation only occurred following review of the safety data (with reference to PK and/or PD data, as appropriate) from the previous dose panel (from SN1011 200 to 800 mg for SAD, and from SN1011200 to 600 mg for MAD) by an independent Safety Review Committee blinded to the safety and PK and PD data. In the randomized, open‐label, two‐period crossover study (part C), 12 subjects randomly received a single dose of SN1011 600 mg under fasting states first and then under fed states, or in the reverse order, with a 7‐day washout between the dosing periods.
Any drugs that could affect hepatic metabolic enzymes were prohibited within 28 days before enrollment and during SN1011 treatment. Following confirmation of eligibility and completion of a 28‐day screening phase, participants were randomized. Participants were admitted to the clinical research unit on day 1, discharged 6 days after the last dose of study drug, and completed a follow‐up safety visit 8–14 days after the last dose.
Safety assessment
Safety was monitored by frequent assessments of vital signs, clinical laboratory tests, physical examinations, 12‐lead ECGs, adverse events (AEs) and serious AEs (SAEs). AEs were coded per the preferred terms of the Medical Dictionary for Regulatory Activities (version 23.1) and assessed by grade per the National Cancer Institute Common Terminology Criteria for Adverse Events (version 5.0).
PK and PD evaluation
In part A, PK blood samples (3 mL) were collected at 0, 0.5, 1, 1.5, 2, 3, 4, 6, 8, 10, 12, 24, 48, 72, 96, and 120 h postdose, and PD blood samples (13 mL) were collected at 0, 12, 24, and 168 h postdose. In part B, PK blood samples were collected at 0, 0.5, 1, 1.5, 2, 3, 4, 6, 8, 10, 12, and 24 h after first administration on day 1 and at 0, 0.5, 1, 1.5, 2, 3, 4, 6, 8, 10, 12, 24, 48, 72, 96, and 120 h after last administration on day 10. Additional trough (predose) blood samples were collected on day 8 and 9. PD blood samples were collected at 0, 12, 24 and 168 h after first administration on day 1 and at 0 and 12 h after last administration on day 10. In part C, PK blood samples were collected at 0, 0.5, 1, 1.5, 2, 3, 4, 6, 8, 10, 12, 24, 48, 72, 96, and 120 h postdose, and PD blood samples were collected at 0, 12, 24, and 120 h postdose.
SN1011 concentrations were assayed using a validated, sensitive, and specific high‐performance liquid chromatography‐tandem accurate mass spectrometry method with a calibration curve range between 5.00 and 5000 ng/mL and an intra‐run accuracy between −12.0% and −2.3% at the lower limit of quantification (LLOQ) and precision of 6.2%, and an inter‐run accuracy between −6.1% and 7.0% at the LLOQ and precision between 0.8% and 2.7% (Supplementary Methods). The PK parameters were calculated by noncompartmental analysis with Phoenix WinNonlin software version 8.2 and included maximum concentration (C max) and time to reach C max (T max), area under the time concentration curve (AUC), terminal phase elimination half‐life (t 1/2), apparent clearance (CL/F) and terminal phase apparent volume of distribution, mean retention time (MRT), and accumulation ratio calculated according to AUC (Rac[AUC] and C max [Rac(Cmax)].
The PD parameter, BTK receptor occupancy in peripheral blood monocytes, was detected with a validated enzyme‐linked immunosorbent assay method as instructed by the manufacturer (United‐Power Pharma Tech), with an assay sensitivity of 1.784 ng/mL (Supplementary Methods). Correlation between SN1011 exposure and BTK receptor occupancy was analyzed.
Statistical analysis
No formal sample size calculation was undertaken. Statistical analysis was done using SAS version 9.4 (SAS Institute) and R (3.2.0, R Core Team [2018], R Foundation for Statistical Computing, Vienna, Austria).
The primary end point of the study was safety and tolerability of SN1011, and the secondary end point was the PK characteristics of SN1011. Key exploratory outcomes included PD characteristics, PK/PD correlation, and food effects on SN1011 exposure.
The full analysis set (FAS) included all randomized subjects and was used for all summaries of disposition and baseline demographics. The safety set included all randomized subjects who received SN1011 or placebo and had safety evaluation data after administration. The PK concentration set included all randomized subjects who received SN1011 and had at least one plasma concentration of SN1011. The PK parameter analysis set included all randomized subjects who received any amount of SN1011 and had at least one evaluable PK parameter. Additionally, all randomized subjects who received SN1011 or placebo and had predose baseline and postdose PD data were included in the PD analysis set.
RESULTS
Baseline characteristics and participant disposition
The dosing scheme and the study flowcharts are shown in Figure S2. In part A, 123 subjects were screened, and 36 eligible subjects were randomized and enrolled. Their median age was 28.0 years, and 25 subjects (69.4%) were men. In part C, 99 subjects were screened, and 24 eligible subjects were randomized and included in the FAS. Their median age was 28.5 years, and 15 subjects (62.5%) were men. In part C, 34 subjects were screened, and 12 eligible subjects were randomized and included in the FAS. Their median age was 29.5 years, and nine subjects (75.0%) were men. Eleven subjects were administered in both periods and completed the study, and one subject in the fasted‐fed group completed the first period and withdrew in the second period due to increased triglyceride levels before administration in the second period. The groups in each trial were comparable in the demographic and anthropometric characteristics (Table 1).
TABLE 1.
Demographic and anthropometric characteristics of the study subjects.
| Single ascending dose | Multiple ascending doses | Food effect | ||||||||||
|---|---|---|---|---|---|---|---|---|---|---|---|---|
| 100 mg | 200 mg | 400 mg | 600 mg | 800 mg | Placebo | 200 mg QD | 400 mg QD | 600 mg QD | Placebo | Fasted‐Fed | Fed‐Fasted | |
| N = 3 | N = 7 | N = 6 | N = 6 | N = 6 | N = 8 | N = 6 | N = 6 | N = 6 | N = 6 | N = 6 | N = 6 | |
| Age, years | ||||||||||||
| Median | 26.0 | 27.0 | 26.5 | 27.5 | 27.5 | 31.0 | 30.0 | 29.0 | 30.0 | 26.5 | 28.5 | 33.0 |
| Q1; Q3 | 22.0; 28.0 | 24.0; 33.0 | 25.0; 28.0 | 23.0; 30.0 | 26.0; 32.0 | 30.0; 34.5 | 27.0; 32.0 | 26.0; 33.0 | 26.0; 31.0 | 21.0; 30.0 | 22.0; 30.0 | 28.0; 34.0 |
| Male sex, n (%) | 3 (100) | 5 (71.4) | 4 (66.7) | 4 (66.7) | 3 (50.0) | 6 (75.0) | 5 (83.3) | 5 (83.3) | 3 (50.0) | 2 (33.3) | 5 (83.3) | 4 (66.7) |
| Ethnicities, n (%) | ||||||||||||
| Han | 3 (100) | 7 (100) | 3 (50.0) | 5 (83.3) | 6 (100) | 8 (100) | 6 (100) | 6 (100) | 6 (100) | 6 (100) | 6 (100) | 6 (100) |
| Others | 0 | 0 | 3 (50.0) | 1 (16.7) | 0 | 0 | 0 | 0 | 0 | 0 | 0 | 0 |
| Body weight, kg | ||||||||||||
| Median | 67.00 | 61.8 | 57.2 | 64.7 | 61.2 | 63.2 | 61.3 | 62.2 | 61.0 | 56.2 | 56.8 | 60.2 |
| Q1; Q3 | 65.60; 69.90 | 57.8; 69.5 | 50.6; 63.5 | 56.8; 67.6 | 49.9; 65.6 | 59.7; 67.8 | 59.2; 64.0 | 52.6; 69.6 | 60.5; 62.4 | 54.7; 58.5 | 54.1; 63.0 | 54.6; 65.3 |
| Height, cm | ||||||||||||
| Median | 169.0 | 172.5 | 163.3 | 169.3 | 162.8 | 166.3 | 166.0 | 168.8 | 165.8 | 159.5 | 162.8 | 167.0 |
| Q1; Q3 | 169.0; 179.0 | 160.0; 174.0 | 153.0; 170.5 | 162.5; 178.0 | 156.0; 172.0 | 164.5; 169.8 | 165.0; 167.5 | 159.0; 181.0 | 160.0; 167.0 | 153.5; 168.0 | 160.0; 168.0 | 153.0; 173.0 |
| Body mass index, kg/m2 | ||||||||||||
| Mean (SD) | 22.8 (0.9) | 22.6 (1.3) | 21.5 (1.3) | 21.8 (1.3) | 22.6 (1.8) | 22.8 (1.7) | 22.6 (1.6) | 21.7 (0.8) | 21.9 (2.0) | 21.9 (1.6) | 21.9 (1.9) | 22.6 (1.5) |
| Range | 21.8; 23.5 | 20.5; 24.4 | 20.4; 24.1 | 20.4; 23.3 | 20.3; 24.4 | 20.6; 25.0 | 20.7; 24.8 | 20.5; 22.9 | 19.0; 24.4 | 19.7; 24.3 | 20.1; 24.7 | 20.5; 24.7 |
Pharmacokinetic
In total, 1708 plasma concentration data were obtained from 71 subjects, including 14 subjects receiving placebo and 57 subjects receiving SN1011, and analyzed for PK characteristics of SN1011.
In the SAD part, SN1011 exhibited rapid intestinal absorption and its plasma concentration significantly increased at 2 h after dosing, followed by a monophasic decline (Figure 1a,b). The levels of systemic exposure to SN1011 showed a dose‐dependent increase in C max from 84.2 ± 16.4 ng/mL with SN1011 100 mg to 779 ± 405 ng/mL with SN1011 800 mg, and AUC from zero to infinity (AUC0‐inf) from 2110 ± 525 ng*h/mL with SN1011 100 mg to 22,300 ± 11,100 ng*h/mL with SN1011 800 mg. The median T max varied between 3 and 5 h after dosing and SN1011 was eliminated with a mean t 1/2 between 15.5 and 21.8 h and a mean MRT between 22.9 and 31.1 h, with no dose dependency (Table 2). There were no significant dose‐related trends in CL/F following SAD of SN1011, with mean CL/F values ranging from 36.5 to 49.6 L/h across all dose levels. Interindividual variability in systemic exposure to SN1011 across doses was moderate with an arithmetic coefficient of variation (CV) for area under the concentration‐time profiles (AUC0–t ), AUC0‐inf, and C max ranging from 28.0% to 50.0%, 25.0% to 50.0%, and 19.0% to 52.0%, respectively.
FIGURE 1.

(a, b) Mean concentration‐time plots of single ascending doses of SN1011. (c, d) Mean concentration‐time plots of SN1011 after single doses in the multiple dose phase. (e, f) Mean concentration‐time plots of multiple ascending doses of SN1011 after multiple oral administrations. (g, h) Mean trough concentration‐time plots of multiple ascending doses of SN1011. (a), (c), (e) and (g): linear coordinates; (b), (d), (f), and (h): semilogarithmic coordinates. Error bars represent standard deviations (SDs).
TABLE 2.
Summary of plasma pharmacokinetics parameters of SN1011 after single oral administration in healthy subjects in the single ascending dose trial.
| Single ascending dose | |||||
|---|---|---|---|---|---|
| 100 mg | 200 mg | 400 mg | 600 mg | 800 mg | |
| N = 3 | N = 6 | N = 6 | N = 6 | N = 6 | |
| C max, ng/mL | 84.2 ± 16.4 (19%) | 293 ± 132 (45%) | 487 ± 221 (45%) | 674 ± 259 (38%) | 779 ± 405 (52%) |
| T max, h | 4.0 (4.0, 6.0) | 3.0 (2.0, 6.0) | 3.5 (2.0, 6.0) | 4.0 (2.0, 6.0) | 5.0 (1.5, 10.0) |
| AUC0‐t , ng*h/mL | 1880 ± 523 (28%) | 4700 ± 1730 (37%) | 11,300 ± 3150 (28%) | 16,400 ± 7970 (49%) | 21,900 ± 11,000 (50%) |
| T last, h | 48.0 (48.0, 72.0) | 72.0 (48.0, 96.0) | 96.0 (72.0, 144.0) | 108.0 (72.0, 144.0) | 132.0 (120.0, 144.1) |
| AUC0‐24, ng*h/mL | 1240 ± 339 (27%) | 3210 ± 1190 (37%) | 6510 ± 1960 (30%) | 9100 ± 3420 (38%) | 11,500 ± 5140 (45%) |
| AUC0‐inf, ng*h/mL | 2110 ± 525 (25%) | 4920 ± 1710 (35%) | 11,600 ± 3140 (27%) | 16,800 ± 8060 (48%) | 22,300 ± 11,100 (50%) |
| CL/F, L/h | 49.6 ± 13.9 (28%) | 44.8 ± 15.3 (34%) | 36.5 ± 9.1 (25%) | 43.4 ± 19.5 (45%) | 44.8 ± 22.3 (50%) |
| V z/F, L | 1210 ± 497 (41%) | 989 ± 293 (30%) | 997 ± 350 (35%) | 1060 ± 227 (21%) | 1400 ± 760 (54%) |
| t 1/2, h | 16.5 ± 2.1 (13%) | 15.5 ± 2.4 (16%) | 19.3 ± 6.5 (34%) | 19.1 ± 6.4 (33%) | 21.8 ± 4.1 (19%) |
| MRT, h | 26.4 ± 1.7 (6%) | 22.9 ± 4.0 (17%) | 29.4 ± 9.9 (34%) | 28.7 ± 8.5 (30%) | 31.1 ± 6.3 (20%) |
Note: T max and T last are presented as median (minimum, maximum). The remaining summary results for each parameter are presented as arithmetic mean ± SD (% coefficient of variation).
Abbreviations: AUC0‐24, area under the plasma concentration‐time curves from 0 to 24 h; AUC0‐inf, area under the plasma concentration‐time curve from time zero to time infinity; AUC0‐t , area under the plasma concentration‐time curve, from 0 till the last quantifiable point; CL/F, apparent clearance; C max, maximum blood concentration; MRT, mean retention time; N, number of subjects included in statistical analysis; t 1/2, elimination of half‐life at terminal phase; T last, time corresponding to the last quantifiable concentration; T max, time to maximum blood concentration; V z/F, apparent volume of distribution at terminal phase.
In the MAD part, the PK profiles of SN1011 were comparable with those of the single dose administrations (Figure 1c–f ). After once daily administration, SN1011 achieved steady‐state in the plasma on day 8 (Figure 1g,h). Under steady‐state conditions, T max was between 2.5 and 3.5 h and SN1011 exhibited a dose‐dependent increase in C max from 516 ± 172 ng/mL with SN1011 200 mg to 1600 ± 49 7 ng/mL with SN1011 600 mg and AUC from time point 0 to the end of the dosing interval (AUC0‐τ) from 8690 ± 3420 ng*h/mL with SN1011 200 mg to 22,000 ± 7700 ng*h/mL with SN1011 600 mg. The mean t 1/2 was largely consistent across all doses (Table 3). Similar to SAD, interindividual variability in systemic exposure to SN1011 was generally moderate with arithmetic CVs for AUC0–t , AUC0‐τ, and steady‐state maximum concentrations ( C ss‐max ) ranging from 30.0% to 51.0%, and 20.0% to 39.0%, and 22.0% to 33.0%, respectively. Moderate accumulation of SN1011 was observed upon multiple dosing, with a mean Rac(Cmax) of 1.5 to 2.2 and a mean Rac(AUC) of 1.7 to 2.2 in the plasma during 10 days of q.d. doses across dose ranges from 200 to 600 mg.
TABLE 3.
Summary of plasma pharmacokinetics parameters of SN1011 after single and multiple oral administrations in healthy subjects in the multiple ascending dose trial.
| 200 mg q.d. | 400 mg q.d. | 600 mg q.d. | ||||
|---|---|---|---|---|---|---|
| Day 1, N = 5 a | Day 10, N = 6 | Day 1, N = 6 | Day 10, N = 6 | Day 1, N = 6 | Day 10, N = 6 | |
| C max, ng/mL b | 260 ± 54.8 (21%) | 516 ± 172 (33%) | 727 ± 183 (25%) | 1070 ± 234 (22%) | 910 ± 332 (36%) | 1600 ± 497 (31%) |
| T max, h | 3.0 (2.0, 8.0) | 3.0 (2.0, 8.0) | 4.0 (1.5, 6.0) | 3.5 (2.0, 4.0) | 4.0 (3.0, 6.0) | 2.5 (2.0, 6.0) |
| AUC0‐t , ng*h/mL | 4280 ± 1130 (26%) | 17,300 ± 7900 (46%) | 9170 ± 1640 (18%) | 26,400 ± 7930 (30%) | 12,200 ± 4680 (38%) | 40,300 ± 20,400 (51%) |
| T last, h | 23.7 (23.7, 23.8) | 120.0 (72.0, 120.0) | 23.8 (23.7, 23.9) | 120.0 (120.0, 120.0) | 23.8 (23.7, 23.8) | 120.0 (96.0, 120.0) |
| C ss,min, ng/mL | – | 257 ± 111 (43%) | – | 419 ± 121 (29%) | – | 531 ± 264 (50%) |
| AUC0‐τ, ng*h/mL | – | 8690 ± 3420 (39%) | – | 15,200 ± 3000 (20%) | – | 22,000 ± 7700 (35%) |
| CLss/F, L/h | – | 27.2 ± 13.4 (49%) | – | 27.4 ± 6.2 (23%) | – | 30.0 ± 9.8 (33%) |
| V ss/F, L | – | 728 ± 161 (22%) | – | 736 ± 181 (25%) | – | 872 ± 345 (40%) |
| t 1/2, h | – | 20.5 ± 5.3 (26%) | – | 19.0 ± 5.4 (28%) | – | 20.4 ± 4.1 (20%) |
| Rac(Cmax) | – | 2.2 ± 0.5 b (24%) | – | 1.5 ± 0.4 (26%) | – | 1.9 ± 0.8 (39%) |
| Rac(AUC) c , d | – | 2.2 ± 0.5 b (23%) | – | 1.7 ± 0.4 (22%) | – | 1.9 ± 0.5 (25%) |
Note: T max and T last are presented as median (minimum, maximum). The summary results of the remaining parameters are presented as mean ± standard deviation (coefficient of variation %).
Abbreviations: AUC0‐t , area under the concentration‐time curve, from 0 until the last quantifiable point; AUC0‐τ, area under the plasma concentration time curve of SN1011 during steady‐state administration interval; CLss/F, steady‐state apparent clearance; C max, maximum plasma concentration; C ss,max, steady‐state maximum plasma concentration; C ss,min, steady‐state minimum plasma concentration; Rac(AUC), accumulation ratio calculated from AUC; Rac(Cmax), accumulation ratio calculated from C max; t 1/2, elimination of half‐life at terminal phase; T last, time corresponding to the last quantifiable concentration; T max, time to steady‐state maximum plasma concentration; V ss/F, apparent volume of distribution at steady‐state terminal phase.
One outlier subject was excluded;
C ss,max for day 1.;
Rac(AUC) = AUC0‐τ on day 10/AUC0‐t on day 1.
Five subjects were included in the analysis of Rac(Cmax) and Rac(AUC).
Dose exposure
After single dose administration, the exposure parameters of each dose group showed a dose‐dependent increase between 100 and 600 mg (Figure 2a). Analysis of dose proportionality using a power model revealed that the point estimates of the slope for C max, AUC from 0 to 24‐h AUC0‐24, and AUC0‐inf after single dose administration of SN1011 were 1.07, 1.04, and 1.16, respectively, and the 90% confidence intervals (CIs) of the point estimates of the slope were largely overlapping with, although not completely within, the judgment interval (Table S1). The findings suggested that SN1011 exposure increased approximately proportional with the dose between 100 and 600 mg. Meanwhile, the 800 mg group and the 600 mg group had a similar exposure profile. After multiple administrations of SN1011 within the dose range between 200 and 600 mg, the exposure parameters of each dose group showed a dose‐dependent rise (Figure 2b). The dose‐normalized exposures were generally distributed at the same level across the dose groups after single and multiple administrations (Figure 2c,d).
FIGURE 2.

Box plots of distribution of exposure parameters by dose after single (a) and (b) multiple oral administrations of SN1011 to healthy subjects. Box plots of distribution of dose‐normalized exposure parameters by dose after single (c) and (d) multiple oral administrations of SN1011 to healthy subjects. Left: C max; mid: AUC0‐24; right: AUC0‐inf. Each plot in (a) and (c) shows the 100 mg (SAD), 200 mg (SAD and MAD day 1), 400 mg (SAD and MAD day 1), 600 mg (SAD, MAD day 1, and the fasted group in the food effect study), and 800 mg (SAD) dose groups from left to right. Each plot in (b) and (d) shows the 200, 400, and 600 mg dose groups at MAD day 10 from left to right. The horizontal line in the middle of the box plot represents the median, the boxes represent the four‐digit interval (1st quartile to 3rd quartile, or the interquartile range [IQR]), the whiskers represent 1.5*IQR, and the scatter outside the box plot represents discrete data; values below the box plot are the number of subjects included in the analysis. AUC0‐inf could not be accurately calculated and was not included in the analysis. C max, maximum blood concentration; AUC0‐24, area under the plasma concentration‐time curves from 0 to 24 h; AUC0‐inf, area under the plasma concentration‐time curve from time zero to time infinity; C max/dose, dose‐normalized maximum blood concentration; AUC0‐24/dose, dose‐normalized area under the plasma concentration‐time curve from 0 to 24 h; AUC0‐inf/dose, dose‐normalized area under the plasma concentration‐time curve from time zero to time infinity; MAD, multiple ascending doses; SAD, single ascending dose.
Dose exposure and sex
After single administration, male and female subjects showed a similar profile in the exposure parameters within the dose range between 100 and 600 mg (Figure S3A). In the 800 mg group, female subjects had generally greater exposure than male subjects. After multiple administrations, no apparent difference was observed in exposure between sexes (Figure S3B).
Food effects
The mean concentration‐time curves of SN1011 after single oral administration at 600 mg under different fed states are depicted in Figure S4. Overall, the trend of plasma concentration‐time curves was consistent when SN1011 was administered in the fed state compared with that in the fasted state. The median T max was 4.0 h for fasted subjects and 6.0 h for fed subjects after receiving a single dose of SN1011 600 mg (Table S2), indicating delayed absorption in the fed state. The mean t 1/2 values were similar under fasted or fed conditions (fasted 24.3 ± 8.7 h and fed 26.6 ± 13.3 h). The geometric mean ratios of C max, AUC0‐t , and AUC0‐inf after administration in the fed state to administration in the fasted state were 97.08%, 92.79%, and 93.76%, respectively, and the corresponding 90% CIs were all within the bioequivalence range between 80.0% and 125.0%, indicating that food had no effect on the exposure of SN1011 (Table S3).
Pharmacodynamics
BTK occupancy
BTK data were available from 28 subjects, including 24 subjects receiving SN1011 and four subjects receiving placebo. The occupancy of BTK receptor after SN1011 administration was rapid and significantly higher than that of placebo. BTK receptor occupancy remained above 80% for the MAD groups for 10 days of continuous q.d. administration of SN1011 400 and 600 mg (Figure 3a). Furthermore, BTK receptor occupancy remained above 83% over 24 h after single administration of 600 mg in both fasted and fed states (Figure 3b).
FIGURE 3.
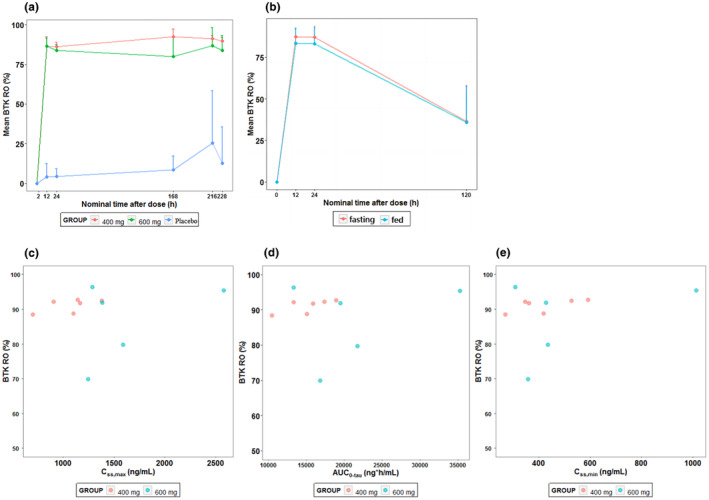
BTK occupancy‐time curves of peripheral blood mononuclear cells in each dose group from day 1 in the multiple ascending dose (MAD) phase (a) and the food effect study (b). Scatter plots of BTK occupancy in peripheral blood mononuclear cells from SN1011 exposure parameters after multiple oral administration of SN1011 to healthy subjects. (c) C ss.max; (d) AUC0‐tau; (e) C ss.min. Placebo subjects with negative BTK occupancy data were replaced with a value of 0 and included in the statistical analysis. One subject in the MAD 600 mg group had a negative BTK occupancy value and the BTK data was judged as an outlier and not included in the statistical analysis of BTK. In the food effect study, one subject in the food effect study dropped out in the second period and four subjects whose BTK occupancy data were judged to be outliers were not included in the statistical analysis of BTK. AUC0‐τ, area under the plasma concentration‐time curve of SN1011 during steady‐state administration interval (AUC0‐24); BTK, Bruton tyrosine kinase; BTKO, Bruton tyrosine kinase occupancy; C ss,max, steady‐state maximum plasma drug concentration; C ss,min, steady‐state minimum plasma drug concentration. Error bars represent standard deviations in (a) and (b).
No apparent correlation was observed between BTK occupancy and SN1011 exposure between 400 and 600 mg (Figure 3c–e).
Safety
Seventy‐one subjects who received SN1011 or placebo were included in the safety population and assessed for AEs for the duration of the study. Thirty‐four subjects experienced 62 AEs. Among 57 subjects who received SN1011, 28 experienced a total of 55 AEs; one AE was grade 3, and the remaining were grade 1 or 2 (Tables S4 to S6). AEs with a rate greater than or equal to 10% are shown in Table 4. Overall, no SAEs were reported in any parts of the study. No death occurred and there were also no meaningful changes in vital signs and ECGs. One AE leading to study discontinuation (triglycerides increased, food effect study). There were no unexpected serious adverse reactions. Furthermore, there was no correlation between occurrences of AEs and SN1011 exposure. Thirty‐six subjects were enrolled in part A. One subject withdrew from the trial before SN1011 administration due to a low heart rate and 35 were included in the safety set. Among 27 subjects who received SAD of SN1011 from 100 to 800 mg, 9 (33.3%) experienced 13 AEs. The three most frequent AEs were blood triglycerides increased (18.5%), neutrophil count decreased (14.8%), and white blood cell count decreased (7.4%). Two of the eight subjects (25.0%) receiving placebo had increased blood triglycerides.
TABLE 4.
AEs (≥10%) in the study population.
| Single ascending dose | Multiple ascending doses | Food effect | Total | ||||||||||||
|---|---|---|---|---|---|---|---|---|---|---|---|---|---|---|---|
| 100 mg | 200 mg | 400 mg | 600 mg | 800 mg | All | Placebo | 200 mg QD | 400 mg QD | 600 mg QD | All | Placebo | Fasted‐Fed | Fed‐Fasted | ||
| N = 3 | N = 6 | N = 6 | N = 6 | N = 6 | N = 27 | N = 8 | N = 6 | N = 6 | N = 6 | N = 18 | N = 6 | N = 6 | N = 6 | N = 12 | |
| AEs | 0 | 2 (33.3) | 2 (33.3) | 3 (50.0) | 2 (33.3) | 9 (23.3) | 2 (25.0) | 3 (50.0) | 4 (66.7) | 5 (83.3) | 12 (66.7) | 4 (66.7) | 5 (41.7) | 2 (18.2) | 7 (58.3) |
| Treatment discontinuation due to AEs | 0 | 0 | 0 | 0 | 0 | 0 | 0 | 0 | 0 | 0 | 0 | 0 | 1 (8.3) | 0 | |
| Increased blood triglycerides | 0 | 2 (33.3) | 2 (33.3) | 0 | 1 (16.7) | 5 (18.5) | 2 (25.0) | 2 (33.3) | 2 (33.3) | 6 (33.3) | 1 (16.7) | 4 (33.3) | 1 (9.1) | 5 (41.7) | |
| Decreased neutrophil count | 0 | 0 | 0 | 3 (50.0) | 1 (16.7) | 4 (14.8) | 0 | 1 (16.7) | 2 (33.3) | 2 (33.3) | 5 (27.8) | 2 (33.3) | 0 | 0 | |
| Decreased leukocyte count | 0 | 0 | 0 | 1 (16.7) | 1 (16.7) | 2 (7.4) | 0 | 1 (16.7) | 1 (16.7) | 2 (33.3) | 4 (22.2) | 1 (16.7) | 0 | 0 | |
| Increased ALT | 0 | 1 (16.7) | 0 | 0 | 0 | 1 (3.7) | 0 | 1 (16.7) | 0 | 1 (16.7) | 2 (11.1) | 0 | 0 | 0 | |
| Increased blood cholesterol | 0 | 1 (16.7) | 0 | 0 | 0 | 1 (3.7) | 0 | 0 | 0 | 0 | 0 | 0 | 0 | 0 | |
| Increased AST | 0 | 0 | 0 | 0 | 0 | 0 | 0 | 1 (16.7) | 0 | 1 (16.7) | 2 (11.1) | 0 | 0 | 0 | |
| Increased blood bilirubin | 0 | 0 | 0 | 0 | 0 | 0 | 0 | 1 (16.7) | 0 | 1 (16.7) | 2 (11.1) | 0 | 0 | 1 (9.1) | |
| Increased blood creatinine | 0 | 0 | 0 | 0 | 0 | 0 | 0 | 0 | 2 (33.3) | 0 | 2 (11.1) | 0 | 0 | 0 | |
| Decreased lymphocyte count | 0 | 0 | 0 | 0 | 0 | 0 | 0 | 0 | 0 | 1 (16.7) | 1 (5.6) | 0 | 0 | 0 | |
| Oropharyngeal pain | 0 | 0 | 0 | 0 | 0 | 0 | 0 | 0 | 0 | 1 (16.7) | 1 (5.6) | 0 | 0 | 0 | |
| Dermatitis allergic | 0 | 0 | 0 | 0 | 0 | 0 | 0 | 0 | 0 | 2 (33.3) | 2 (11.1) | 0 | 0 | 0 | |
| Upper respiratory tract infection | 0 | 0 | 0 | 0 | 0 | 0 | 0 | 0 | 1 (16.7) | 1 (5.6) | 0 | 0 | 0 | ||
| Mouth ulceration | 0 | 0 | 0 | 0 | 0 | 0 | 0 | 0 | 0 | 1 (16.7) | 1 (5.6) | 0 | 0 | 0 | |
| Constipation | 0 | 0 | 0 | 0 | 0 | 0 | 0 | 0 | 0 | 1 (16.7) | 1 (5.6) | 0 | 0 | 0 | |
| Abdominal discomfort | 0 | 0 | 0 | 0 | 0 | 0 | 0 | 0 | 0 | 1 (16.7) | 1 (5.6) | 0 | 0 | 0 | |
| Dyspepsia | 0 | 0 | 0 | 0 | 0 | 0 | 0 | 0 | 0 | 1 (16.7) | 1 (5.6) | 0 | 0 | 0 | |
| Lethargy | 0 | 0 | 0 | 0 | 0 | 0 | 0 | 0 | 0 | 1 (16.7) | 1 (5.6) | 0 | 0 | 0 | |
| Sinus arrythmia | 0 | 0 | 0 | 0 | 0 | 0 | 0 | 0 | 1 (16.7) | 0 | 1 (5.6) | 0 | 0 | 0 | |
Abbreviations: AE, adverse event; ALT, alanine transaminase; AST, aspartate transaminase.
Twenty‐four subjects in part B were included in the safety set. Eighteen subjects received MAD of SN1011 from 200 to 600 mg for 10 days and 12 of them (66.7%) experienced 34 AEs. The three most frequent AEs were blood triglycerides increased (33.3%), neutrophil count decreased (27.8%) and leucocyte count decreased (22.2%). Eleven subjects (61.1%) experienced at least a treatment‐related AE (TRAE), all of which were grade 1 or 2. AE and TRAE grade increased with the rising exposure levels of SN1011 after single administration, but there was a large overlap in subject exposure levels across TRAE grades. Meanwhile, after multiple dosing of SN1011, the steady‐state exposure corresponding to grade 2 treatment‐emergent AE (TEAE) or TRAE was higher than that associated with grade 0 or 1 AEs (Figure S5). Six subjects received placebo and four (66.7%) of them experienced five AEs. No grade 3 or higher AEs were reported and there were no SAEs in subjects receiving SN1011 or placebo. Three subjects (50%) had TRAEs, which were grade 1 or 2.
In the food effect study, 7 (58.3%) in 12 subjects experienced eight AEs, and one (8.3%) experienced one AE (increased triglycerides, grade 3) leading to study discontinuation. Of the above AEs, one AE was grade 3, and the remaining were grade 1. There were no SAEs and serious adverse reactions in both the fasted group and the fed group.
DISCUSSION
BTK broadly participates in both innate and adaptative immune response, rendering it a prime target in autoimmune diseases. 1 , 2 , 12 Our novel BTK inhibitor SN1011 is differentiated from currently available BTK inhibitors like ibrutinib in terms of selectivity and mode of binding mechanisms. Its unique chemical structure renders it high binding affinity and selectivity towards BTK. In our unpublished preclinical studies in animals, SN1011 demonstrated greater bioavailability compared with the marketed BTK inhibitors (ibrutinib, acalabrutinib, and zanubrutinib). In this randomized phase I trial, SN1011 caused no serious safety concerns in healthy subjects, with good safety and tolerability. The PK/PD results supported further clinical development of SN1011 for treatment of immune‐mediated diseases.
The most frequent TEAEs in our study were blood triglycerides increased, blood neutrophil count decreased, and blood leucocyte count decreased in both the SAD and MAD phases of the study. Most TRAEs were mild or moderate, and only one subject had a grade 3 TRAE (blood triglycerides increased) in the food effect study, which did not appear to be dose dependent. The subject also experienced blood triglycerides increased following drug administration in previous clinical studies unrelated to SN1011. Multiple factors could lead to increased blood triglycerides, which also appeared in our subjects receiving placebo. Further studies are required to address the issue. Lower incidences of AEs have been reported in patients treated with other BTK inhibitors like acalabrutinib or zanubrutinib. 13 , 14 As a reversible but highly selective BTK inhibitor, SN1011 is less likely to cause long‐lasting off‐ or on‐target effects on other kinases than ibrutinib. Bleeding and infectious complications have been recognized as a TRAE due to on‐target effects of ibrutinib and are AEs of clinical interest associated with BTK inhibitor therapy. 15 , 16 No bleeding complications occurred with SN1011. One case of upper respiratory tract infection occurred. Treatment‐related QTc prolongation and atrial fibrillation, one of the major concerns for ibrutinib and other BTK inhibitors were not reported in our trial. 17 , 18 Furthermore, elevations in alanine transaminase and aspartate transaminase and rises in creatinine were not dose dependent and exhibited no apparent trend. The rates of occurrences of these AEs were low. Given the small sample size and the short‐term nature of the study, longer term studies with a larger population may be required to determine whether any AEs are treatment related.
PK assessments demonstrated good plasma drug exposure after oral administration of SN1011, with a dose‐proportional increase in C max and AUC. Meanwhile, there was only modest accumulation of SN1011 in plasma over time after multiple administrations, which agrees with the overall low frequency of any grade toxicity and virtually no treatment‐related toxicities of SN1011. Meanwhile, SN1011 has a longer half‐life, resulting in longer duration of exposure compared to other BTK inhibitors. In the range between 100 and 800 mg, t 1/2 and plasma drug exposure of SN1011 are greater than those of PRN1008, also a reversible covalent BTK inhibitor. 19 This increased exposure has the potential to translate into greater BTK inhibition in tissue biopsy specimens and could maximize the chances of achieving deep and sustained responses. Additionally, food had no significant effect on PK parameters of SN1011, and SN1011 capsules could be taken under fasting conditions or with meals. There was also no significant difference in SN1011 exposure between sexes after single and multiple doses. The exposure characteristics (C max and AUC0‐24) of subjects to SN1011 after single administration at the same dose were somewhat different in SAD, MAD day 1, and food effect study, possibly due to the small sample size and relatively large interindividual variability. The CV% of exposure was 55%–145% for BTK inhibitor fenebrutinib within the single dose range from 200 to 400 mg, and 45.6%–64.6% for PRN1008 within the single dose range from 300 to 600 mg, with relatively large interindividual variability. 19 , 20 The CV% of SN1011 exposure (31% to 38%) does not exceed the general variability of BTK inhibitors. Due to differences of exposure for SAD, MAD day 1, and food effects studies after single dose administration and imbalances in the number of subjects among the dosing levels, the result of dose proportionality analysis after single dose may have some bias. Therefore, the data after multiple dose administration may provide more accurate information. When the number of subjects was balanced among each dosing cohort, there was no more than dose proportional increase for the dose‐normalized parameters with the dose between 200 and 600 mg.
Currently, the threshold of BTK inhibition required for clinical efficacy in autoimmune diseases is unknown. SN1011 rapidly occupied BTK receptors after administration. BTK receptor occupancy remained above 80% with 10 days of continuous q.d. administration of SN1011 400 and 600 mg and could be saturated with SN1011 400 mg. A twice daily dosing regimen of acalabrutinib achieved a BTK receptor occupancy rate of 96% and spebrutinib b.i.d. attained a BTK receptor occupancy rate of 88% in patients with rheumatoid arthritis. 21 , 22 The higher receptor occupancy rates with the two BTK inhibitors could be attributed to the twice daily dosing regimen and covalent inhibition of BTK. Near complete BTK inhibition may raise safety concerns as covalent BTK inhibitors may severely reduce the number of B cells compromising normal immunological functions and leading to infectious complications. At above 80% BTK receptor occupancy in the current study, no infectious complications were reported. From a safety perspective, all current doses are safe and maximum tolerated dose was not explored, but from a PD perspective, BTK occupancy may no longer increase with the increase of dose, so 600 mg may become the recommended dose for subsequent clinical studies, which are needed to fully determine the optimal dose and risk–benefit profile in the patient population. Additionally, BTK receptor occupancy could serve as a marker for the percentage of BTK inhibition required for the minimal effective doses of SN1011 for an autoimmune disease in future trials and for optimizing dosing schedules.
In conclusion, this randomized phase I trial demonstrated that SN1011 was well‐tolerated and safe after single or multiple exposures to healthy subjects. SN1011 increased approximately in a dose‐proportional manner within the investigated dose range and BTK could be occupied rapidly above 80% in the 400 and 600 mg groups. Food had no effect on the exposure parameters of SN1011 and SN1011 capsules could be taken with or without food. Overall, the PK, PD, safety, and tolerability results support further clinical development of SN1011 for the treatment of autoimmune diseases.
AUTHOR CONTRIBUTIONS
L.Z., R.S., and W.Y. wrote the manuscript. D.W., C.C., G.X., and S.L. designed the research. L.Z., R.S., T.Z., Y.Y., J.T., P.P., and Y.H. performed the research. L.Z. and D.W. analyzed the data. G.X. and S.L. contributed new reagents/analytical tools.
FUNDING INFORMATION
This trial was sponsored by SinoMab BioScience Limited. Additional support was provided by Shanghai Education Commission Collaborative Innovation Center: Integrated Traditional Chinese and Western Medicine ‐ Clinical Evaluation Platform of Chinese Patent Medicine (A1‐U21‐205‐0103); Construction of Demonstrative Research Wards in Shanghai Shenkang Center (SHDC2022CRW010); and Shanghai Shenkang Center Medical Enterprise Integration Innovation Collaboration Project (SHDC2022CRT018).
CONFLICT OF INTEREST STATEMENT
This trial was sponsored by SinoMab BioScience Limited. SinoMab was involved in the study design, collection, analysis, and interpretation of data. Dong Wang, Clement Chong, Guolin Xu, and Shui‐on Leung were full‐time employees of SinoMab BioScience Limited. All other authors declared no competing interests for this work.
Supporting information
Data S1
Zhu L, Shi R, Zhao T, et al. A randomized, controlled single, and multiple ascending dose trial of the safety, pharmacokinetics and pharmacodynamics of SN1011 in healthy subjects. Clin Transl Sci. 2023;16:1982‐1996. doi: 10.1111/cts.13606
Leilei Zhu and Rong Shi contributed equally to this work.
The study is registered with ChinaDrugTrials.org.cn (CTR20202676).
REFERENCES
- 1. Niiro H, Clark EA. Regulation of B‐cell fate by antigen‐receptor signals. Nat Rev Immunol. 2002;2:945‐956. [DOI] [PubMed] [Google Scholar]
- 2. Corneth OBJ, Klein Wolterink RGJ, Hendriks RW. BTK signaling in B cell differentiation and autoimmunity. Curr Top Microbiol Immunol. 2016;393:67‐105. [DOI] [PubMed] [Google Scholar]
- 3. Vetrie D, Vořechovský I, Sideras P, et al. The gene involved in X‐linked agammaglobulinaemia is a member of the src family of protein‐tyrosine kinases. Nature. 1993;361:226‐233. [DOI] [PubMed] [Google Scholar]
- 4. Saito K, Scharenberg AM, Kinet JP. Interaction between the Btk PH domain and phosphatidylinositol‐3,4,5‐trisphosphate directly regulates Btk. J Biol Chem. 2001;276:16201‐16206. [DOI] [PubMed] [Google Scholar]
- 5. Liang C, Tian D, Ren X, et al. The development of Bruton's tyrosine kinase (BTK) inhibitors from 2012 to 2017: a mini‐review. Eur J Med Chem. 2018;151:315‐326. [DOI] [PubMed] [Google Scholar]
- 6. Cheung TT, Mcinnes IB. Future therapeutic targets in rheumatoid arthritis? Semin Immunopathol. 2017;39:487‐500. [DOI] [PMC free article] [PubMed] [Google Scholar]
- 7. Spaargaren M, Beuling EA, Rurup ML, et al. The B cell antigen receptor controls integrin activity through Btk and PLCgamma2. J Exp Med. 2003;198:1539‐1550. [DOI] [PMC free article] [PubMed] [Google Scholar]
- 8. Honigberg LA, Smith AM, Sirisawad M, et al. The Bruton tyrosine kinase inhibitor PCI‐32765 blocks B‐cell activation and is efficacious in models of autoimmune disease and B‐cell malignancy. Proc Natl Acad Sci USA. 2010;107:13075‐13080. [DOI] [PMC free article] [PubMed] [Google Scholar]
- 9. Montalban X, Arnold DL, Weber MS, et al. Placebo‐controlled trial of an oral BTK inhibitor in multiple sclerosis. N Engl J Med. 2019;380:2406‐2417. [DOI] [PubMed] [Google Scholar]
- 10. Roskoski R Jr. Classification of small molecule protein kinase inhibitors based upon the structures of their drug‐enzyme complexes. Pharmacol Res. 2016;103:26‐48. [DOI] [PubMed] [Google Scholar]
- 11. Johnson AR, Kohli PB, Katewa A, et al. Battling Btk mutants with noncovalent inhibitors that overcome cys481 and thr474 mutations. ACS Chem Biol. 2016;11:2897‐2907. [DOI] [PubMed] [Google Scholar]
- 12. Neys SFH, Rip J, Hendriks RW, Corneth OBJ. Bruton's tyrosine kinase inhibition as an emerging therapy in systemic autoimmune disease. Drugs. 2021;81:1605‐1626. [DOI] [PMC free article] [PubMed] [Google Scholar]
- 13. Byrd JC, Harrington B, O'Brien S, et al. Acalabrutinib (ACP‐196) in relapsed chronic lymphocytic leukemia. N Engl J Med. 2016;374:323‐332. [DOI] [PMC free article] [PubMed] [Google Scholar]
- 14. Tam CS, Trotman J, Opat S, et al. Phase 1 study of the selective BTK inhibitor zanubrutinib in B‐cell malignancies and safety and efficacy evaluation in CLL. Blood. 2019;134:851‐859. [DOI] [PMC free article] [PubMed] [Google Scholar]
- 15. Burger JA, Tedeschi A, Barr PM, et al. Ibrutinib as initial therapy for patients with chronic lymphocytic leukemia. N Engl J Med. 2015;373:2425‐2437. [DOI] [PMC free article] [PubMed] [Google Scholar]
- 16. Lipsky AH, Farooqui MZH, Tian X, et al. Incidence and risk factors of bleeding‐related adverse events in patients with chronic lymphocytic leukemia treated with ibrutinib. Haematologica. 2015;100:1571‐1578. [DOI] [PMC free article] [PubMed] [Google Scholar]
- 17. Sestier M, Hillis C, Fraser G, Leong D. Bruton's tyrosine kinase inhibitors and cardiotoxicity: more than just atrial fibrillation. Curr Oncol Rep. 2021;23:113. [DOI] [PMC free article] [PubMed] [Google Scholar]
- 18. Tang CPS, McMullen J, Tam C. Cardiac side effects of bruton tyrosine kinase (BTK) inhibitors. Leuk Lymphoma. 2018;59:1554‐1564. [DOI] [PubMed] [Google Scholar]
- 19. Smith PF, Krishnarajah J, Nunn PA, et al. A phase I trial of PRN1008, a novel reversible covalent inhibitor of Bruton's tyrosine kinase, in healthy volunteers. Br J Clin Pharmacol. 2017;83:2367‐2376. [DOI] [PMC free article] [PubMed] [Google Scholar]
- 20. Herman AE, Chinn LW, Kotwal SG, et al. Safety, pharmacokinetics, and pharmacodynamics in healthy volunteers treated with GDC‐0853, a selective reversible bruton's tyrosine kinase inhibitor. Clin Pharmacol Ther. 2018;103:1020‐1028. [DOI] [PubMed] [Google Scholar]
- 21. Alsadhan A, Cheung J, Gulrajani M, et al. Pharmacodynamic analysis of BTK inhibition in patients with chronic lymphocytic leukemia treated with acalabrutinib. Clin Cancer Res. 2020;26:2800‐2809. [DOI] [PMC free article] [PubMed] [Google Scholar]
- 22. Schafer PH, Kivitz AJ, Ma J, et al. Spebrutinib (CC‐292) affects markers of B cell activation, chemotaxis, and osteoclasts in patients with rheumatoid arthritis: results from a mechanistic study. Rheumatol Ther. 2020;7:101‐119. [DOI] [PMC free article] [PubMed] [Google Scholar]
Associated Data
This section collects any data citations, data availability statements, or supplementary materials included in this article.
Supplementary Materials
Data S1