

Key Points
Question
Did the Million Hearts Model, which encouraged and paid for cardiovascular risk assessment and reduction, reduce the incidence of first-time myocardial infarctions and strokes or Medicare spending among Medicare beneficiaries aged 40 to 79 years?
Findings
The model reduced the probability of a first-time myocardial infarction or stroke over 5 years by 0.3 percentage points among people at high or medium risk for these events, without statistically significant changes in Medicare spending.
Meaning
The commitment of health care organizations to cardiovascular risk assessment and follow-up, coupled with payments for risk assessment and reduction, reduced myocardial infarction and stroke rates. Results support guideline recommendations for cardiovascular risk assessment.
Abstract
Importance
The Million Hearts Model paid health care organizations to assess and reduce cardiovascular disease (CVD) risk. Model effects on long-term outcomes are unknown.
Objective
To estimate model effects on first-time myocardial infarctions (MIs) and strokes and Medicare spending over a period up to 5 years.
Design, Setting, and Participants
This pragmatic cluster-randomized trial ran from 2017 to 2021, with organizations assigned to a model intervention group or standard care control group. Randomized organizations included 516 US-based primary care and specialty practices, health centers, and hospital-based outpatient clinics participating voluntarily. Of these organizations, 342 entered patients into the study population, which included Medicare fee-for-service beneficiaries aged 40 to 79 years with no previous MI or stroke and with high or medium CVD risk (a 10-year predicted probability of MI or stroke [ie, CVD risk score] ≥15%) in 2017-2018.
Intervention
Organizations agreed to perform guideline-concordant care, including routine CVD risk assessment and cardiovascular care management for high-risk patients. The Centers for Medicare & Medicaid Services paid organizations to calculate CVD risk scores for Medicare fee-for-service beneficiaries. CMS further rewarded organizations for reducing risk among high-risk beneficiaries (CVD risk score ≥30%).
Main Outcomes and Measures
Outcomes included first-time CVD events (MIs, strokes, and transient ischemic attacks) identified in Medicare claims, combined first-time CVD events from claims and CVD deaths (coronary heart disease or cerebrovascular disease deaths) identified using the National Death Index, and Medicare Parts A and B spending for CVD events and overall. Outcomes were measured through 2021.
Results
High- and medium-risk model intervention beneficiaries (n = 130 578) and standard care control beneficiaries (n = 88 286) were similar in age (median age, 72-73 y), sex (58%-59% men), race (7%-8% Black), and baseline CVD risk score (median, 24%). The probability of a first-time CVD event within 5 years was 0.3 percentage points lower for intervention beneficiaries than control beneficiaries (3.3% relative effect; adjusted hazard ratio [HR], 0.97 [90% CI, 0.93-1.00]; P = .09). The 5-year probability of combined first-time CVD events and CVD deaths was 0.4 percentage points lower in the intervention group (4.2% relative effect; HR, 0.96 [90% CI, 0.93-0.99]; P = .02). Medicare spending for CVD events was similar between the groups (effect estimate, −$1.83 per beneficiary per month [90% CI, −$3.97 to −$0.30]; P = .16), as was overall Medicare spending including model payments (effect estimate, $2.11 per beneficiary per month [90% CI, −$16.66 to $20.89]; P = .85).
Conclusions and Relevance
The Million Hearts Model, which encouraged and paid for CVD risk assessment and reduction, reduced first-time MIs and strokes. Results support guidelines to use risk scores for CVD primary prevention.
Trial Registration
ClinicalTrials.gov Identifier: NCT04047147
This cluster-randomized clinical trial examines the effects of the Million Hearts Model on first-time myocardial infarctions and strokes and Medicare spending over a period up to 5 years.
Introduction
In 2017, the US Centers for Medicare & Medicaid Services (CMS) launched the Million Hearts Cardiovascular Disease (CVD) Risk Reduction Model. Under this model (a health care delivery initiative tested by the CMS Innovation Center), CMS paid participating health care organizations to assess and reduce CVD risk among Medicare fee-for-service beneficiaries aged 40 to 79 years and organizations agreed to follow guideline-concordant care processes for the primary prevention of CVD. The model was unique in paying for overall CVD risk reduction, measured by a novel, longitudinal risk calculator,1 rather than tying performance-based payments to control of individual risk factors.2 CMS tested the model from 2017 to 2021 in a cluster-randomized, pragmatic trial including hundreds of thousands of beneficiaries across the US.
CVD remains the leading cause of death in the US and progress has stalled in recent years,3 with substantial room to improve modifiable risk factors.4 The Million Hearts Model, part of the US government’s broader Million Hearts initiative,5 aimed to reduce first-time myocardial infarctions (MIs) and strokes by 7%. CMS hypothesized that this 7% relative effect could reduce Medicare spending enough to offset model payments, making the model cost-neutral.
A previous study6 showed the Million Hearts Model increased practitioners’ use of CVD risk assessment. In addition, Medicare beneficiaries in the intervention group were more than 10% more likely than control beneficiaries to appropriately initiate or intensify antihypertensive or statin medications within a year of entering the model. Over the same period, systolic blood pressure and low-density lipoprotein cholesterol among high-risk beneficiaries declined 1% to 2% relative to the control group. The current study extended this work, examining model effects on long-term outcomes (measured over a maximum of 5 years) including first-time CVD events (MIs, strokes, and transient ischemic attacks [TIAs]) and Medicare spending.
Methods
The trial protocol is available in Supplement 1. This study was part of a mixed-methods evaluation.7 Beneficiaries were tracked as part of the group to which their organization was randomized following intention-to-treat principles. The study was registered at ClinicalTrials.gov (NCT04047147) and was exempt from federal policies on human subjects research, including institutional review board review, as an evaluation of public benefits or services.8
Intervention
The study ran from January 3, 2017, to December 31, 2021, and had 2 main components. First, intervention organizations signed a model participation agreement in which they agreed to perform CVD preventive care aligned with guidelines from the American College of Cardiology and the American Heart Association.9 As part of this agreement, intervention organizations agreed to calculate Medicare beneficiaries’ risk of MI or stroke over 10 years (a CVD risk score). Risk scores relied on demographic information (age, sex, and race [because Black race is associated with higher CVD-event risk in the US10]), clinical information (blood pressure, lipid levels, and diabetes status), smoking status, and antihypertensive use.11 Organizations varied in how they implemented the risk score calculation, with most either building a risk calculator into the electronic health record or having staff calculate risk scores using an existing web- or phone-based app. The organizations further agreed to provide cardiovascular management services to high-risk beneficiaries (CVD risk score ≥30%). This included (1) discussing CVD risk with patients; (2) developing individualized care plans with patients for reducing risk; (3) annual in-person reassessment visits, including recalculating 10-year CVD risk scores using a longitudinal calculator designed for this purpose1; and (4) additional contact at least twice annually to monitor progress.
Second, CMS offered payments to organizations to assess and reduce CVD risk. From 2017 to 2021, CMS provided intervention organizations 1-time payments of $10 per eligible beneficiary for whom they assessed risk. Further, in 2017 only, CMS paid intervention organizations $10 per beneficiary per month (PBPM) for each high-risk beneficiary to support cardiovascular care management. Then, from 2018 to 2021, CMS made performance-based risk-reduction payments: CMS paid each organization $0, $5, or $10 PBPM for each high-risk beneficiary with an annual risk reassessment, with monthly payment amounts dependent on mean risk score change across all of the organization’s high-risk beneficiaries reassessed. Beneficiaries’ risk score change was measured each year relative to the baseline score.
In addition, CMS created the Million Hearts Data Registry, through which organizations submitted clinical data needed to calculate risk scores initially and at reassessments. CMS provided webinars and peer-to-peer learning sessions and sent each organization semiannual performance reports.
CMS paid standard care control organizations $20 to submit the clinical data needed to calculate risk scores via the Million Hearts Data Registry (for the initial visits and each annual visit thereafter), with no payments PBPM. CMS did not ask control organizations to calculate risk scores, but staff at organizations randomized to the control group could have used their data to calculate risk scores and followed guidelines for CVD prevention.
Randomization
Randomization occurred at the organization level. CMS used a minimization procedure (adaptive randomization) equivalent to random assignment12,13,14 (eMethods 1 in Supplement 2).
Study Population
Organizations volunteered for participation following a CMS request for applications. Eligible organizations had to have an electronic health record and at least 1 practitioner (physician, nurse practitioner, or physician assistant) billing Medicare.
Medicare fee-for-service beneficiaries entered the model during the intervention period (after randomization) when they visited a participating practitioner at a participating organization and the organization submitted the clinical data needed to calculate a risk score to the registry. Organizations chose whether to have all or only some practitioners participate and could update their practitioner lists during the intervention (after randomization). However, for organizations randomized to the control group, CMS imposed a 20-practitioner cap to limit costs of testing the model. Eligible beneficiaries were aged 40 to 79 years at their initial model visit, without a previous MI or stroke, kidney failure, or hospice use. CMS used registry data and Medicare data to (1) verify beneficiaries’ eligibility, including no Medicare claims indicating MI or stroke since 1999; (2) verify that a visit occurred with a participating practitioner; and (3) calculate a baseline CVD risk score. After a beneficiary was assigned to an organization they could not be assigned to a second organization.
The analytic population for this study was defined as beneficiaries entering the model in 2017 or 2018 (eMethods 2 in Supplement 2) with a CVD risk score greater than or equal to 15%. Although performance-based risk-reduction payments were limited to high-risk beneficiaries (CVD risk score ≥30%), CMS anticipated spillover15 to medium-risk beneficiaries (CVD risk score ≥15% and <30%). As prespecified in the trial protocol, we focused on effects among (1) the combined high- and medium-risk population and (2) only the high-risk group. We analyzed only beneficiaries entering the model in 2017 or 2018 to ensure sufficient time to assess long-term outcomes before the model’s end in 2021.
Outcomes
The outcome measures are defined in eMethods 3 in Supplement 2, including relevant diagnosis codes. We analyzed the following 2 primary outcomes: (1) first-time CVD events (MIs, strokes, and TIAs), identified using Medicare claims data, and (2) Medicare spending on first-time CVD events (PBPM), before model payments, covering all Parts A and B spending during the hospitalization or emergency department (ED) visit for the event and 90 days after discharge (to cover, for example, rehabilitation services following a stroke). This outcome was the primary spending outcome because we anticipated better power to detect effects than for total Medicare spending.
We further analyzed the following secondary outcomes: (1) first-time CVD events or CVD deaths (due to coronary heart disease or cerebrovascular disease), identified using claims data and underlying cause of death recorded in the National Death Index; (2) Medicare Parts A and B spending PBPM before model payments; (3) Medicare Parts A and B spending PBPM including model payments; (4) all-cause hospitalizations; (5) all-cause outpatient ED visits (including hospital observation stays); (6) office visits; (7) circulatory system–related hospitalizations, limited to stays with 1 of roughly 300 relevant diagnosis codes; (8) circulatory system–related ED visits; and (9) all-cause deaths, identified in the Medicare Enrollment Database. Supplement 2 also contains analyses by cause of death from the National Death Index.
Follow-up Period
Outcomes were measured from the date the beneficiary entered the model until December 31, 2021, or censoring due to death or losing Medicare fee-for-service coverage, a maximum of 1823 days (5 years).
Statistical Analysis
We estimated effects using Cox proportional hazard models for time-to-event outcomes (first-time CVD events, first-time CVD events or CVD deaths, and all-cause deaths). For Medicare spending on first-time CVD events, we used a 2-part model: a logit model for the probability of a CVD event within 4 years and a linear model for spending conditional on having an event (eMethods 4 in Supplement 2 describes sample restrictions for this analysis, the only with a 4-year follow-up). For all other outcomes, longitudinal linear regression models were used. All analyses used robust standard errors clustered at the organization level. Covariates covered beneficiary-, organization-, and area-level characteristics (eMethods 5 in Supplement 2). As with other CMS tests,16,17,18,19 we prespecified7 a P value threshold of .10 (2-tailed test) to balance the risk of type I and type II errors.
Sensitivity Analyses
We conducted sensitivity tests using more specific outcome definitions for CVD events (eg, excluding TIAs), supplementing time-to-event analyses with logistic models in case the Cox proportional hazards assumption was violated, and trimming the intervention group to mimic the 20-practitioner cap in the control group. We further attributed beneficiaries based on visits with model-participating practitioners and reestimated effects among all beneficiaries who visited the organizations and appeared eligible in Medicare data, regardless of whether an organization provided registry data (eMethods 6 in Supplement 2). We also assessed the influence of COVID-19 by calculating outcome trends in 2020 to 2021 by county and checking how much regional differences could bias the study findings
Results
Participation
Of 516 organizations randomized, 345 (173 in the model intervention group and 172 in the standard care control group) submitted registry data to enter at least 1 beneficiary into the model (Figure 1). Organizations with model beneficiaries—both intervention and control—were more likely than organizations randomized but without model beneficiaries to be primary care practices and participate in other CMS initiatives (eTable 1 in Supplement 2). As expected, the intervention group had more model beneficiaries with high and medium risk (n = 130 578) than the control group (n = 88 286) due to the control group’s practitioner cap. For both groups, the model population comprised slightly more than half the attributed beneficiaries (eFigure 1 in Supplement 2), indicating that organizations did not provide data for many beneficiaries aged 40 to 79 years without previous MI or stroke. In both the intervention and control groups, model beneficiaries had similar demographics to attributed beneficiaries not in the model, but had lower mean Medicare spending and hospitalization rates before their model-qualifying visits (eTable 2 in Supplement 2).
Figure 1. Flow of Organizations and Beneficiaries From Random Assignment Through Analysis.
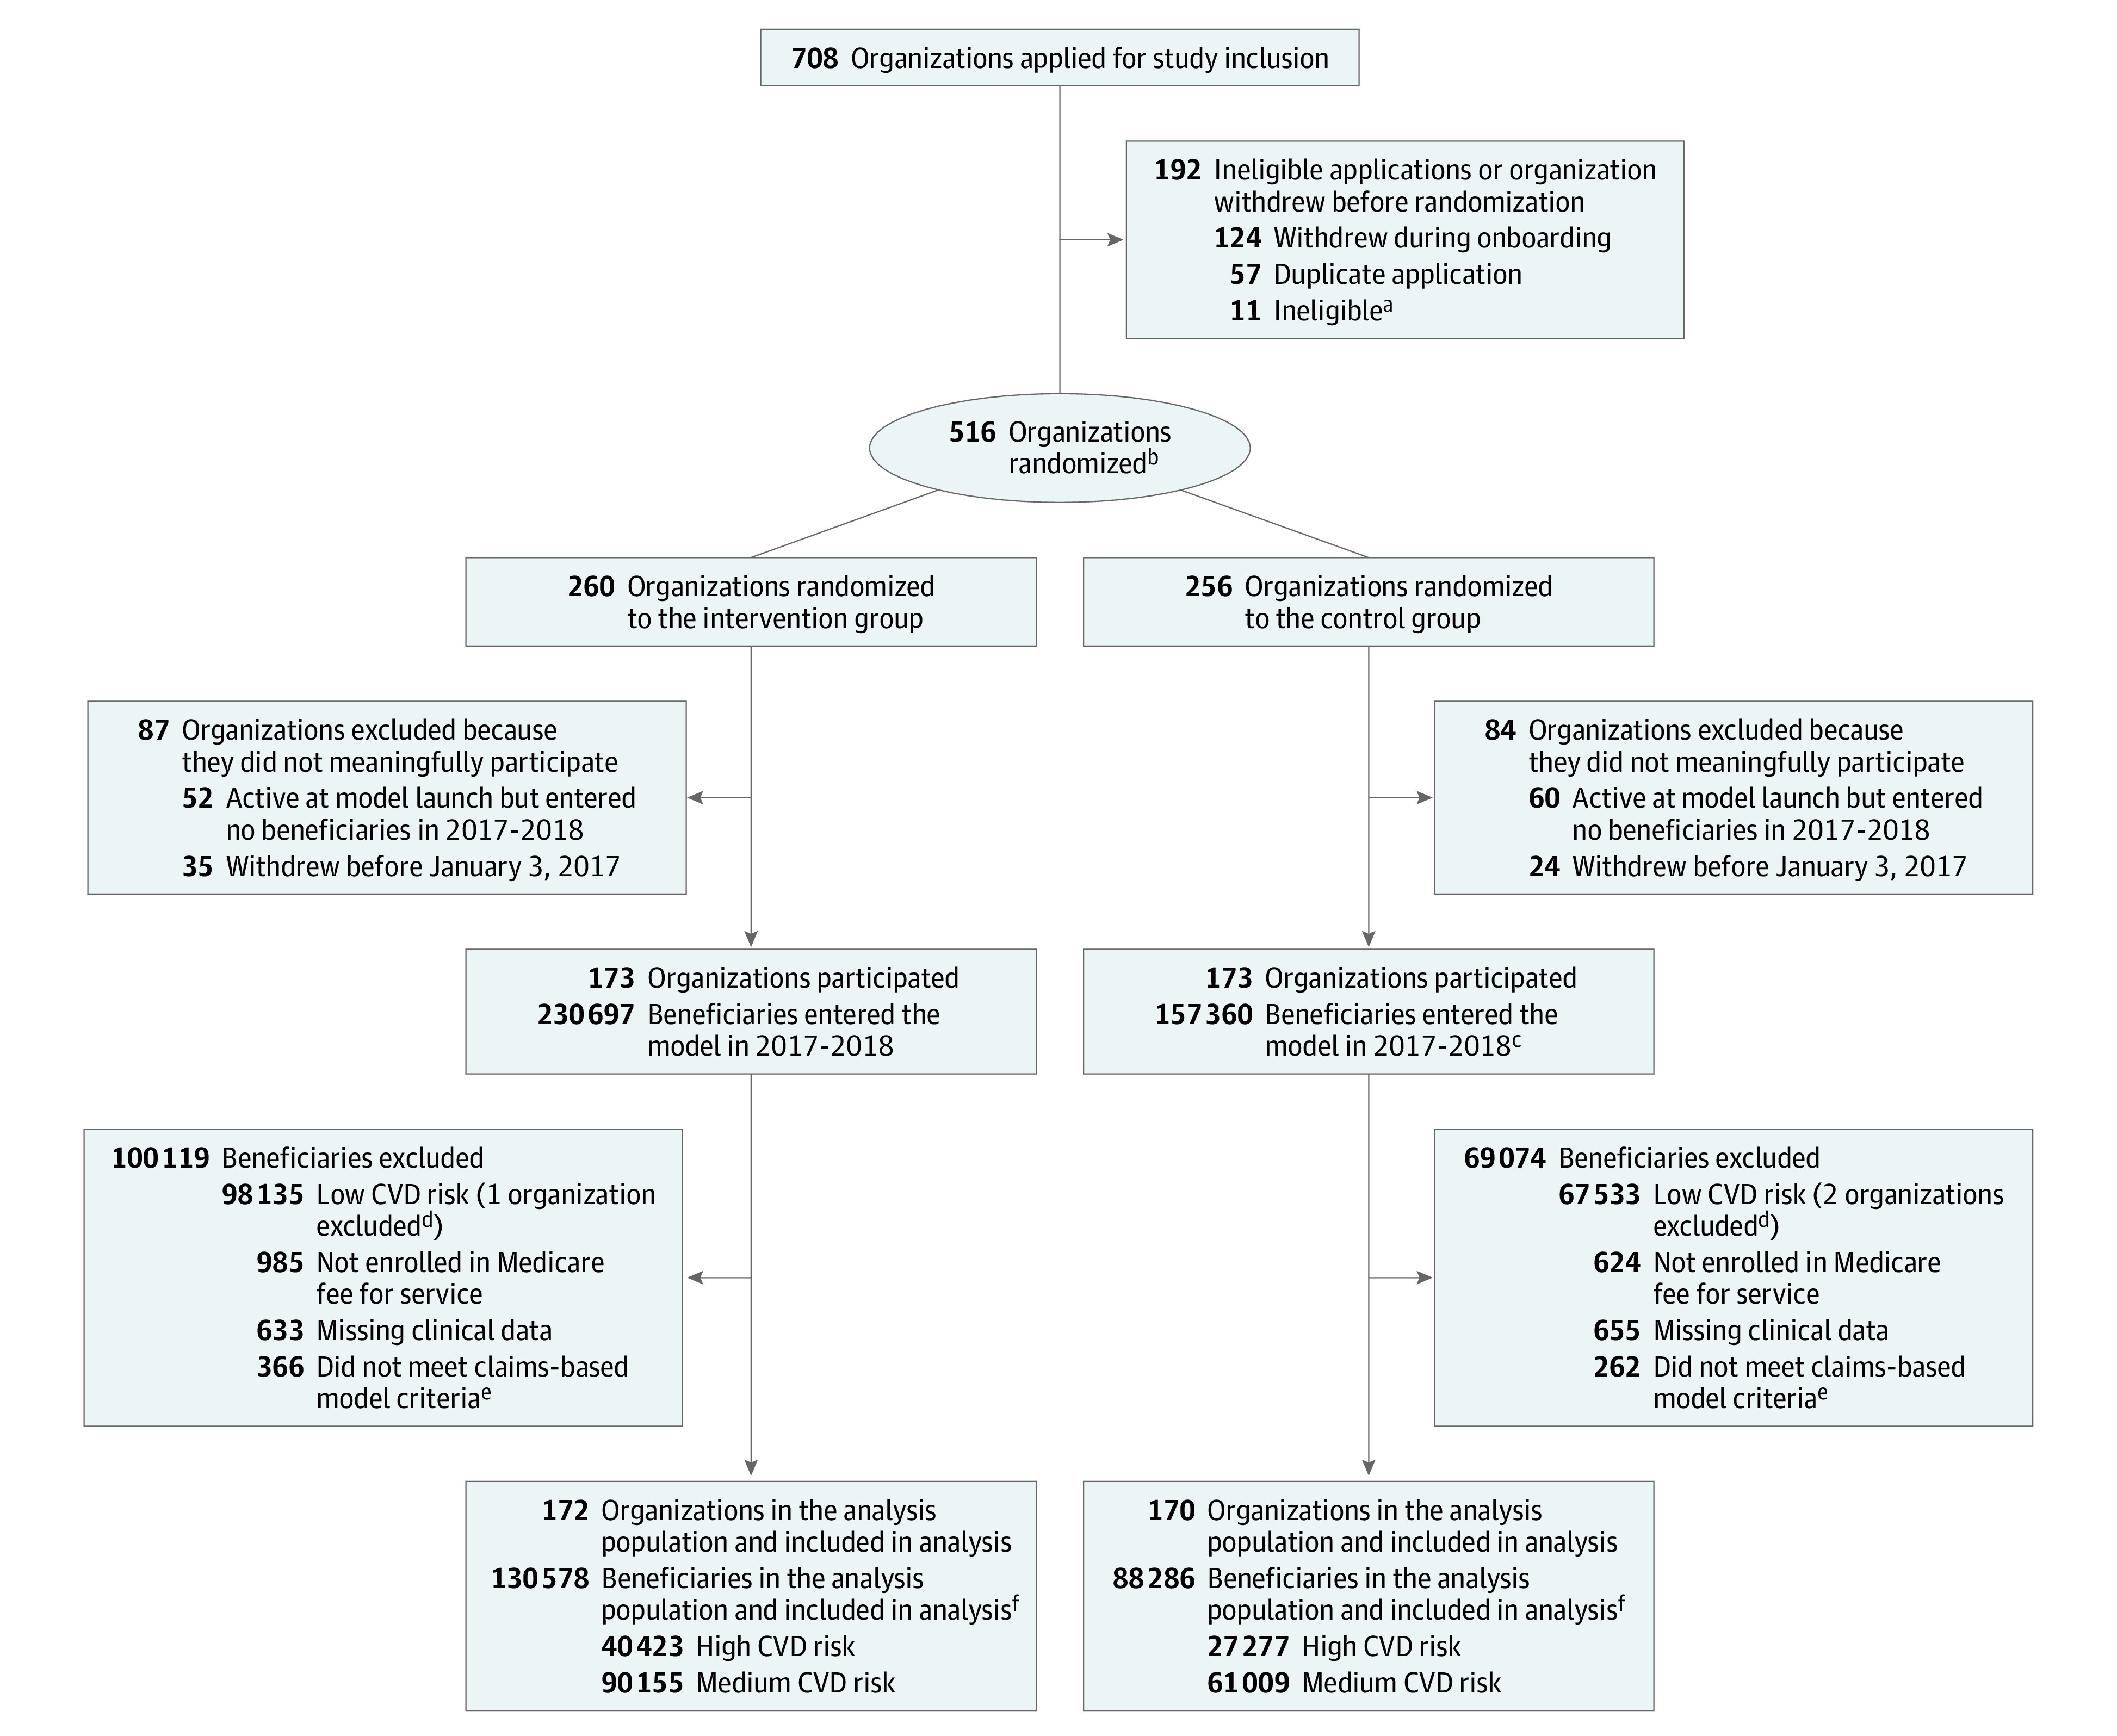
aThe Centers for Medicare and Medicaid Services (CMS) issued a broad request for applications to participate in the Million Hearts Model. To participate, organizations had to submit a complete application, have at least 1 practitioner enrolled in and eligible to bill for Medicare Part B, use an electronic health record system certified by the Office of the National Coordinator for Health Information Technology, and have met the criteria for the CMS electronic health record Incentive Programs, also known as Meaningful Use, in performance year 2014. Five organizations were ineligible because they failed to meet 1 or more of these criteria. CMS rejected an additional 6 organizations for ambiguous or unsatisfactory responses to application questions about these same criteria or about willingness or ability to participate in the model.
bAssignment occurred at the organization level. CMS used a minimization procedure (adaptive randomization), equivalent to random assignment (eMethods 1 in Supplement 2).
cIn the control group, the number of participating practitioners per organization was capped at 20. This resulted in fewer beneficiaries per organization, on average, in the control group vs the intervention group.
dOrganizations were implicitly excluded from the analysis population if none of their model beneficiaries met the inclusion criteria.
eBeneficiaries had to be aged 40 to 79 years when entering the model with no prior acute myocardial infarction, prior stroke, kidney failure, or hospice use.
fAll beneficiaries remained alive and in Medicare fee-for-service at least 1 day after entering the model, although censoring sometimes occurred later due to beneficiaries dying or exiting Medicare fee-for-service.
The participating intervention and control groups that were used to estimate effects were broadly similar. Model-participating organizations ranged in size and included primary care practices, specialty practices, and health centers (Table 1). Model beneficiaries in the intervention and control groups (Table 2) were similar (among high- and medium-risk beneficiaries together) in age (median age, 72-73 years), sex (58%-59% men), race (7%-8% Black and 92%-93% other races, as reported by the participating organizations and verified in the Medicare Enrollment Database, with both based on fixed-category race designations), and baseline CVD risk score (median, 24%). These beneficiaries received substantial care at baseline, with frequent office visits in the year before model entry and most receiving statins or antihypertensives (Table 2). Still, opportunities remained to reduce CVD risk. For example, approximately three-quarters of high-risk beneficiaries had elevated systolic blood pressure (≥130 mm Hg).
Table 1. Characteristics of Organizations With at Least One Beneficiary Entering the Million Hearts Model from January 3, 2017, to December 31, 2018.
| Characteristic | No. (%) | |
|---|---|---|
| Intervention organizations (n = 173) | Control organizations (n = 172) | |
| Organization size (reported on Million Hearts Model application), median (IQR) | ||
| Total practitioners | 10 (3-30) | 11 (4-30) |
| Total sites | 3 (1-7) | 3 (1-7) |
| Rural location | 79 (46) | 80 (47) |
| Census region | ||
| South | 65 (38) | 68 (40) |
| Northeast | 52 (30) | 41 (24) |
| Midwest | 29 (17) | 35 (20) |
| West | 26 (15) | 28 (16) |
| US territory | 1 (1) | 0 (0) |
| Organization typea | ||
| Primary care | 90 (52) | 95 (55) |
| Specialty or multispecialty | 39 (23) | 35 (20) |
| Federally qualified health centers, rural health clinics, or other health centersb | 26 (15) | 25 (15) |
| Hospitalc | 18 (10) | 17 (10) |
| Participating in other CMS models or programs when applied for the Million Hearts Model | ||
| ≥1 CMS initiative (or application pending at random assignment) | 88 (51) | 84 (49) |
| Medicare Shared Savings Program | 51 (29) | 37 (22) |
Abbreviation: CMS, Centers for Medicare & Medicaid Services.
Organization type is based on data from the organizations’ Million Hearts Model applications linked to the CMS National Plan & Provider Enumeration System.
“Other” health centers include Indian health and migrant health centers.
Hospital sites were outpatient clinics within hospitals. The National Provider Identifier Type 2 organization taxonomy codes that were used to categorize the organizations do not distinguish hospitals’ primary care clinics from their specialty care clinics.
Table 2. Baseline Characteristics of Medicare Beneficiaries Entering the Model in 2017 or 2018.
| Characteristic | No. (%) | |||
|---|---|---|---|---|
| High-risk beneficiaries | Medium-risk beneficiaries | |||
| Intervention (n = 40 423) | Control (n = 27 277) | Intervention (n = 90 155) | Control (n = 61 009) | |
| Demographics and socioeconomic status | ||||
| Age, median (IQR), ya | 75 (71-77) | 75 (71-77) | 71 (68-74) | 71 (68-75) |
| Black raceb | 3103 (8) | 1753 (6) | 7373 (8) | 4047 (7) |
| Mena | 26 434 (65) | 17 833 (65) | 49 202 (55) | 34 176 (56) |
| Women | 13 989 (35) | 9444 (35) | 40 953 (45) | 26 833 (44) |
| Dually eligible for Medicaida | 3788 (9) | 2746 (10) | 8675 (10) | 6093 (10) |
| Risk factors for myocardial infarction and stroke | ||||
| CVD risk score, median (IQR), percentage pointsc,d | 37 (33-45) | 38 (33-45) | 21 (18-25) | 21 (18-25) |
| Diabetes | 25 828 (64) | 17 033 (62) | 24 516 (27) | 16 813 (28) |
| Ischemic heart diseasee | 15 403 (38) | 10 728 (39) | 26 454 (29) | 19 076 (31) |
| Total cholesterol, median (IQR), mg/dLc | 164 (140-193) | 164 (139-194) | 173 (148-201) | 172 (147-200) |
| LDL cholesterol,c median (IQR), mg/dL | 88 (68-113) | 87 (67-113) | 95 (74-119) | 93 (72-118) |
| LDL cholesterol ≥70 mg/dL | 29 195 (73) | 19 553 (72) | 71 983 (80) | 47 777 (79) |
| Systolic blood pressure, median (IQR), mm Hgc | 138 (128-150) | 138 (128-150) | 130 (121-140) | 130 (122-140) |
| Systolic blood pressure ≥130 mm Hg | 29 955 (74) | 20 268 (74) | 48 902 (54) | 33 374 (55) |
| Current smokingc | 5041 (12) | 3951 (14) | 9442 (10) | 7078 (12) |
| Medication use | ||||
| Aspirinc | 20 567 (51) | 13 452 (49) | 38 958 (43) | 24 500 (40) |
| Medicare Part D prescription drug coveragef | 28 348 (70) | 19 061 (70) | 61 064 (68) | 41 290 (68) |
| Antihypertensive usef | 25 561 (90) | 17 015 (89) | 48 442 (79) | 32 575 (79) |
| Statin usef | 19 517 (69) | 12 960 (68) | 37 089 (61) | 25 401 (62) |
| Model entryg | ||||
| Initial model visit with a primary care physician | 23 369 (58) | 16 466 (60) | 52 777 (59) | 37 796 (62) |
| Initial model visit with a cardiologist | 10 953 (27) | 7470 (27) | 23 801 (26) | 15 867 (26) |
| Time from model launch to initial model visit, median (IQR), d | 122 (55-265) | 157 (70-297) | 136 (64-282) | 168 (77-307) |
| Health care service use in the year before model entrye | ||||
| Total Medicare Parts A and B spending per beneficiary per month, median (IQR), $ | 241 (98-622) | 233 (93-601) | 205 (80-532) | 201 (77-525) |
| All-cause hospitalizations per 1000 people per year, mean (SD)h | 204 (747) | 201 (619) | 181 (636) | 189 (769) |
| CVD-specific hospitalizations per 1000 people per year, mean (SD)h | 49 (309) | 45 (271) | 39 (272) | 42 (321) |
| All-cause ED visits per 1000 people per year, mean (SD)h | 395 (1080) | 383 (969) | 377 (1202) | 367 (1199) |
| CVD-specific ED visits per 1000 people per year, mean (SD)h | 32 (238) | 32 (213) | 28 (259) | 26 (212) |
| Office visits per person per year, median (IQR) | 8 (5-13) | 8 (4-13) | 7 (4-12) | 7 (4-12) |
| Office visits per person per year with a practitioner listed on the organization’s Million Hearts Model application, median (IQR) | 2 (1-4) | 2 (1-4) | 2 (0-3) | 2 (1-4) |
Abbreviations: CVD, cardiovascular disease; ED, emergency department; LDL, low-density lipoprotein.
Based on data from the Medicare enrollment database.
Based on registry data submitted by the Million Hearts Model participating organizations, validated against data in the Medicare Enrollment Database. Because CVD risk score calculation differs for those with Black race vs non-Black race,1,11 CMS required model participants only to provide race information stating whether beneficiaries were Black or not Black. However, imputed race data from the RAND Medicare Bayesian Improved Surname Geocoding race and ethnicity file—which incorporates information from the Medicare Enrollment Database as well as name and address—suggest the model population with high and medium risk was 84% non-Hispanic White, 7% non-Hispanic Black, 4% Hispanic (of any race), and 4% Other (American Indian and Alaska Native, non-Hispanic Asian and Pacific Islander, or multiracial).
Based on data from the Million Hearts Data Registry.
The CVD risk score is the predicted probability of a myocardial infarction or stroke within 10 years expressed as a percentage (0%-100%). Risk scores were calculated based on demographic information (age, sex, and race), clinical information (blood pressure and lipid levels and diabetes status), smoking status, and use of antihypertensives, following the study by Goff et al.11 The study population limits to beneficiaries with a CVD risk score of at least 15%. The maximum observed risk score was 88% for high-risk beneficiaries and just less than 30% for medium-risk beneficiaries.
Based on Medicare Parts A and B claims.
Based on Medicare Part D claims.
Based on Million Hearts Data Registry data linked to specialty information in the National Plan & Provider Enumeration System.
Mean values per 1000 people are shown rather than the median values per person because the median values per person were all 0.
Model Effects
Table 3 shows estimated effects on all outcomes. Over a median follow-up of 4.3 years, high- and medium-risk beneficiaries in the intervention group experienced a 3.3% lower rate of CVD events than beneficiaries in the control group (Table 3 and Figure 2; adjusted hazard ratio [HR], 0.97 [90% CI, 0.93-1.00]; P = .09) and a 4.2% lower rate of combined first-time CVD events and CVD deaths (HR, 0.96 [90% CI, 0.93-0.99]; P = .02). These relative effects represent an absolute reduction of 0.3 percentage points in the probability of a CVD event over 5 years (7.8% in the intervention group vs 8.1% in the control group; Figure 2) and 0.4 percentage points in the probability of a CVD event or CVD death over 5 years (9.3% vs 9.7%; Figure 2). The beneficiaries in the intervention group also experienced a 4.3% lower death rate (HR, 0.96 [90% CI, 0.93-0.98]; P = .01; absolute reduction of 0.5 percentage points over 5 years). Analyses by cause of death showed the largest relative declines (10.6%) among deaths due to coronary heart disease and cerebrovascular disease (eTable 3 in Supplement 2). Across outcomes, results were generally more favorable among medium-risk beneficiaries than high-risk beneficiaries, for whom differences between the intervention and control group were not statistically significant for first-time CVD events, combined CVD events and CVD deaths, or all-cause deaths. However, high-risk beneficiaries in the intervention group experienced a relative 14.4% lower death rate than beneficiaries in the control group from coronary heart disease (P = .03; eTable 3 in Supplement 2).
Table 3. Estimated Effects of the Million Hearts Model on Primary and Secondary Long-Term Study Outcomes.
| Outcome | Intervention | Control | Difference | Relative change or effect, %a | P value | |
|---|---|---|---|---|---|---|
| Unadjustedb | Adjusted (90% CI) | |||||
| Health events (No. per 1000 person-years) | ||||||
| High- and medium-risk beneficiaries | ||||||
| First-time myocardial infarctions, strokes, and TIAs (from Medicare claims only) (primary outcome) | 15.8 | 17.0 | HR, 0.92 | HR, 0.97 (0.93 to 1.0) | −3.3 | 0.09 |
| First-time myocardial infarctions, strokes, or TIAs, including deaths due to CHD or cerebrovascular disease | 18.7 | 20.3 | HR, 0.92 | HR, 0.96 (0.93 to 0.99) | −4.2 | 0.02 |
| All-cause deaths | 28.0 | 29.7 | HR, 0.94 | HR, 0.96 (0.93 to 0.98) | −4.3 | 0.01 |
| High-risk beneficiaries | ||||||
| First-time myocardial infarctions, strokes, and TIAs (from Medicare claims only) (primary outcome) | 21.3 | 22.7 | HR, 0.94 | HR, 0.99 (0.94 to 1.03) | −1.3 | 0.63 |
| First-time myocardial infarctions, strokes, or TIAs, including deaths due to CHD or cerebrovascular disease | 25.7 | 27.3 | HR, 0.94 | HR, 0.98 (0.94 to 1.02) | −2.0 | 0.45 |
| All-cause deaths | 38.4 | 39.3 | HR, 0.97 | HR, 0.99 (0.95 to 1.03) | −0.8 | 0.72 |
| Medium-risk beneficiaries | ||||||
| First-time myocardial infarctions, strokes, and TIAs (from Medicare claims only) (primary outcome) | 13.3 | 14.6 | HR, 0.92 | HR, 0.95 (0.91 to 0.99) | −4.7 | 0.06 |
| First-time myocardial infarctions, strokes, or TIAs, including deaths due to CHD or cerebrovascular disease | 15.7 | 17.3 | HR, 0.91 | HR, 0.94 (0.91 to 0.98) | −5.6 | <0.001 |
| All-cause deaths | 23.5 | 25.4 | HR, 0.92 | HR, 0.93 (0.90 to 0.96) | −6.8 | 0.02 |
| Medicare spending ($ per beneficiary per mo) | ||||||
| High- and medium-risk beneficiaries | ||||||
| Medicare spending on first-time myocardial infarctions, strokes, and TIAs and 90-d follow-up (primary outcome) | $37.56 | $40.72 | −$3.16 | −$1.83 (−$3.97 to $0.30) | −4.7 | 0.16 |
| Total Medicare Parts A and B spending before model payments | $958.50 | $954.82 | $3.69 | $0.87 (−$17.91 to $19.64) | 0.1 | 0.94 |
| Total Medicare Parts A and B spending including model paymentsc | $959.75 | $954.82 | $4.93 | $2.11 (−$16.66 to 20.89) | 0.2 | 0.85 |
| High-risk beneficiaries | ||||||
| Medicare spending on first-time myocardial infarctions, strokes, and TIAs and 90-d follow-up (primary outcome) | $50.92 | $55.78 | $4.86 | −$3.09 (−7.33 to 1.15) | 5.7 | 0.23 |
| Total Medicare Parts A and B spending before model payments | $1104.50 | $1088.32 | $16.18 | $9.93 (−$18.54 to +$38.40) | 0.9 | 0.57 |
| Total Medicare Parts A and B spending including model paymentsc | NAc | NAc | NAc | NAc | NAc | NAc |
| Medium-risk beneficiaries | ||||||
| Medicare spending on first-time myocardial infarctions, strokes, and TIAs and 90-d follow-up (primary outcome) | $31.36 | $33.84 | $2.48 | −$1.30 (−3.66 to 1.07) | −4.0 | 0.37 |
| Total Medicare Parts A and B spending before model payments | $893.76 | $895.61 | $1.85 | −$3.22 (−21.08 to 14.65) | −0.4 | 0.77 |
| Total Medicare Parts A and B spending including model paymentsc | NAc | NAc | NAc | NAc | NAc | NAc |
| Health care service use (No. per 1000 beneficiaries per year) | ||||||
| High- and medium-risk beneficiaries | ||||||
| All-cause hospitalizations | 255.3 | 251.9 | 3.4 | 9.0 (3.8 to 14.3) | 3.7 | 0.005 |
| Circulatory system-related hospitalizations | 56.0 | 57.0 | −1.1 | 0.8 (−1.0 to 2.6) | 1.4 | 0.48 |
| All-cause ED visits | 386.3 | 382.8 | 3.5 | 8.2 (−1.1 to 17.6) | 2.2 | 0.15 |
| Circulatory system–related ED visits | 31.6 | 33.0 | −1.4 | 0.1 (−1.7 to 1.9) | 0.4 | 0.91 |
| Office visits | 10 544.7 | 10 173.6 | 371.1 | 101.1 (−55.5 to 257.7) | 1.0 | 0.29 |
| High-risk beneficiaries | ||||||
| All-cause hospitalizations | 309.2 | 302.4 | 6.8 | 12.3 (3.5 to 21.1) | 4.1 | 0.02 |
| Circulatory system-related hospitalizations | 75.6 | 75.6 | 0.1 | 2.3 (−0.7 to 5.3) | 3.1 | 0.21 |
| All-cause ED visits | 422.7 | 416.2 | 6.5 | 11.9 (0.2 to 23.6) | 2.9 | 0.09 |
| Circulatory system–related ED visits | 38.4 | 39.3 | 0.9 | 1.2 (−1.2 to 3.5) | 3.1 | 0.41 |
| Office visits | 11 312.4 | 10 875.2 | 437.3 | 138.0 (−57.6 to 333.6) | 1.2 | 0.25 |
| Medium-risk beneficiaries | ||||||
| All-cause hospitalizations | 231.4 | 229.5 | 1.9 | 7.5 (2.3 to 12.7) | 3.4 | 0.02 |
| Circulatory system–related hospitalizations | 47.2 | 48.8 | −1.6 | 0.1 (−1.7 to 2.0) | 0.2 | 0.92 |
| All-cause ED visits | 370.1 | 368.0 | 2.2 | 7.4 (−2.7 to 17.5) | 2.0 | 0.23 |
| Circulatory system–related ED visits | 28.6 | 30.2 | −1.6 | −0.4 (−2.2 to 1.4) |
−1.4 | 0.71 |
| Office visits | 10 204.2 | 9862.5 | 341.7 | 81.6 (−68.8 to 232.0) | 0.8 | 0.37 |
Abbreviations: CHD, coronary heart disease; CMS, Centers for Medicare & Medicaid Services; ED, emergency department; NA, not applicable; TIA, transient ischemic attack.
The relative change is the estimated relative increase or decrease in the outcome associated with the Million Hearts Model, expressed as a percentage. For the health-event outcomes, hazard ratios are already on a relative scale rather than an absolute scale. The relative change as a percentage effect is calculated as (HR − 1) × 100%. For outcomes of Medicare spending or health care service use, the unadjusted and adjusted differences are on the absolute scale, so the relative change as a percentage effect is calculated from the adjusted difference relative to the outcome mean. For example, the percentage effect for Medicare spending on first-time myocardial infarctions, strokes, and TIAs (a primary outcome) among high- and medium-risk beneficiaries is the adjusted effect (−$1.83) divided by the adjusted control group mean, where the adjusted control group mean equals the intervention group mean minus the adjusted difference (−$1.83/[$37.56 – −$1.83] = −0.047 = −4.7%). CIs are not provided for relative change, but can be inferred from the CIs provided for the “Adjusted (90% CI)” column.
Unadjusted differences are calculated before rounding the intervention or control group rates or means. As a result, numbers might not sum across rows exactly.
Model payments included (1) the risk assessment payments CMS paid for intervention group beneficiaries entering the model through December 2018 (all risk groups), as risk assessments were needed to identify high- and medium-risk beneficiaries; (2) cardiovascular care management payments for intervention group high-risk beneficiaries, which CMS paid only in 2017; and (3) risk reduction payments CMS paid through December 2021 for intervention group high-risk beneficiaries who entered the model through December 2018. All together, these payments summed to $7.2 million, and we divided this total payment evenly across high- and medium-risk beneficiaries and their follow-up months to estimate means and effects. We did not estimate effects separately for either the high-risk or the medium-risk beneficiaries, given the risk-assessment costs were incurred by the population as a whole.
Figure 2. Cumulative Probabilitya of First-Time Cardiovascular Disease (CVD) Event (Regression-Adjusted Mean Cumulative Probability Functions).
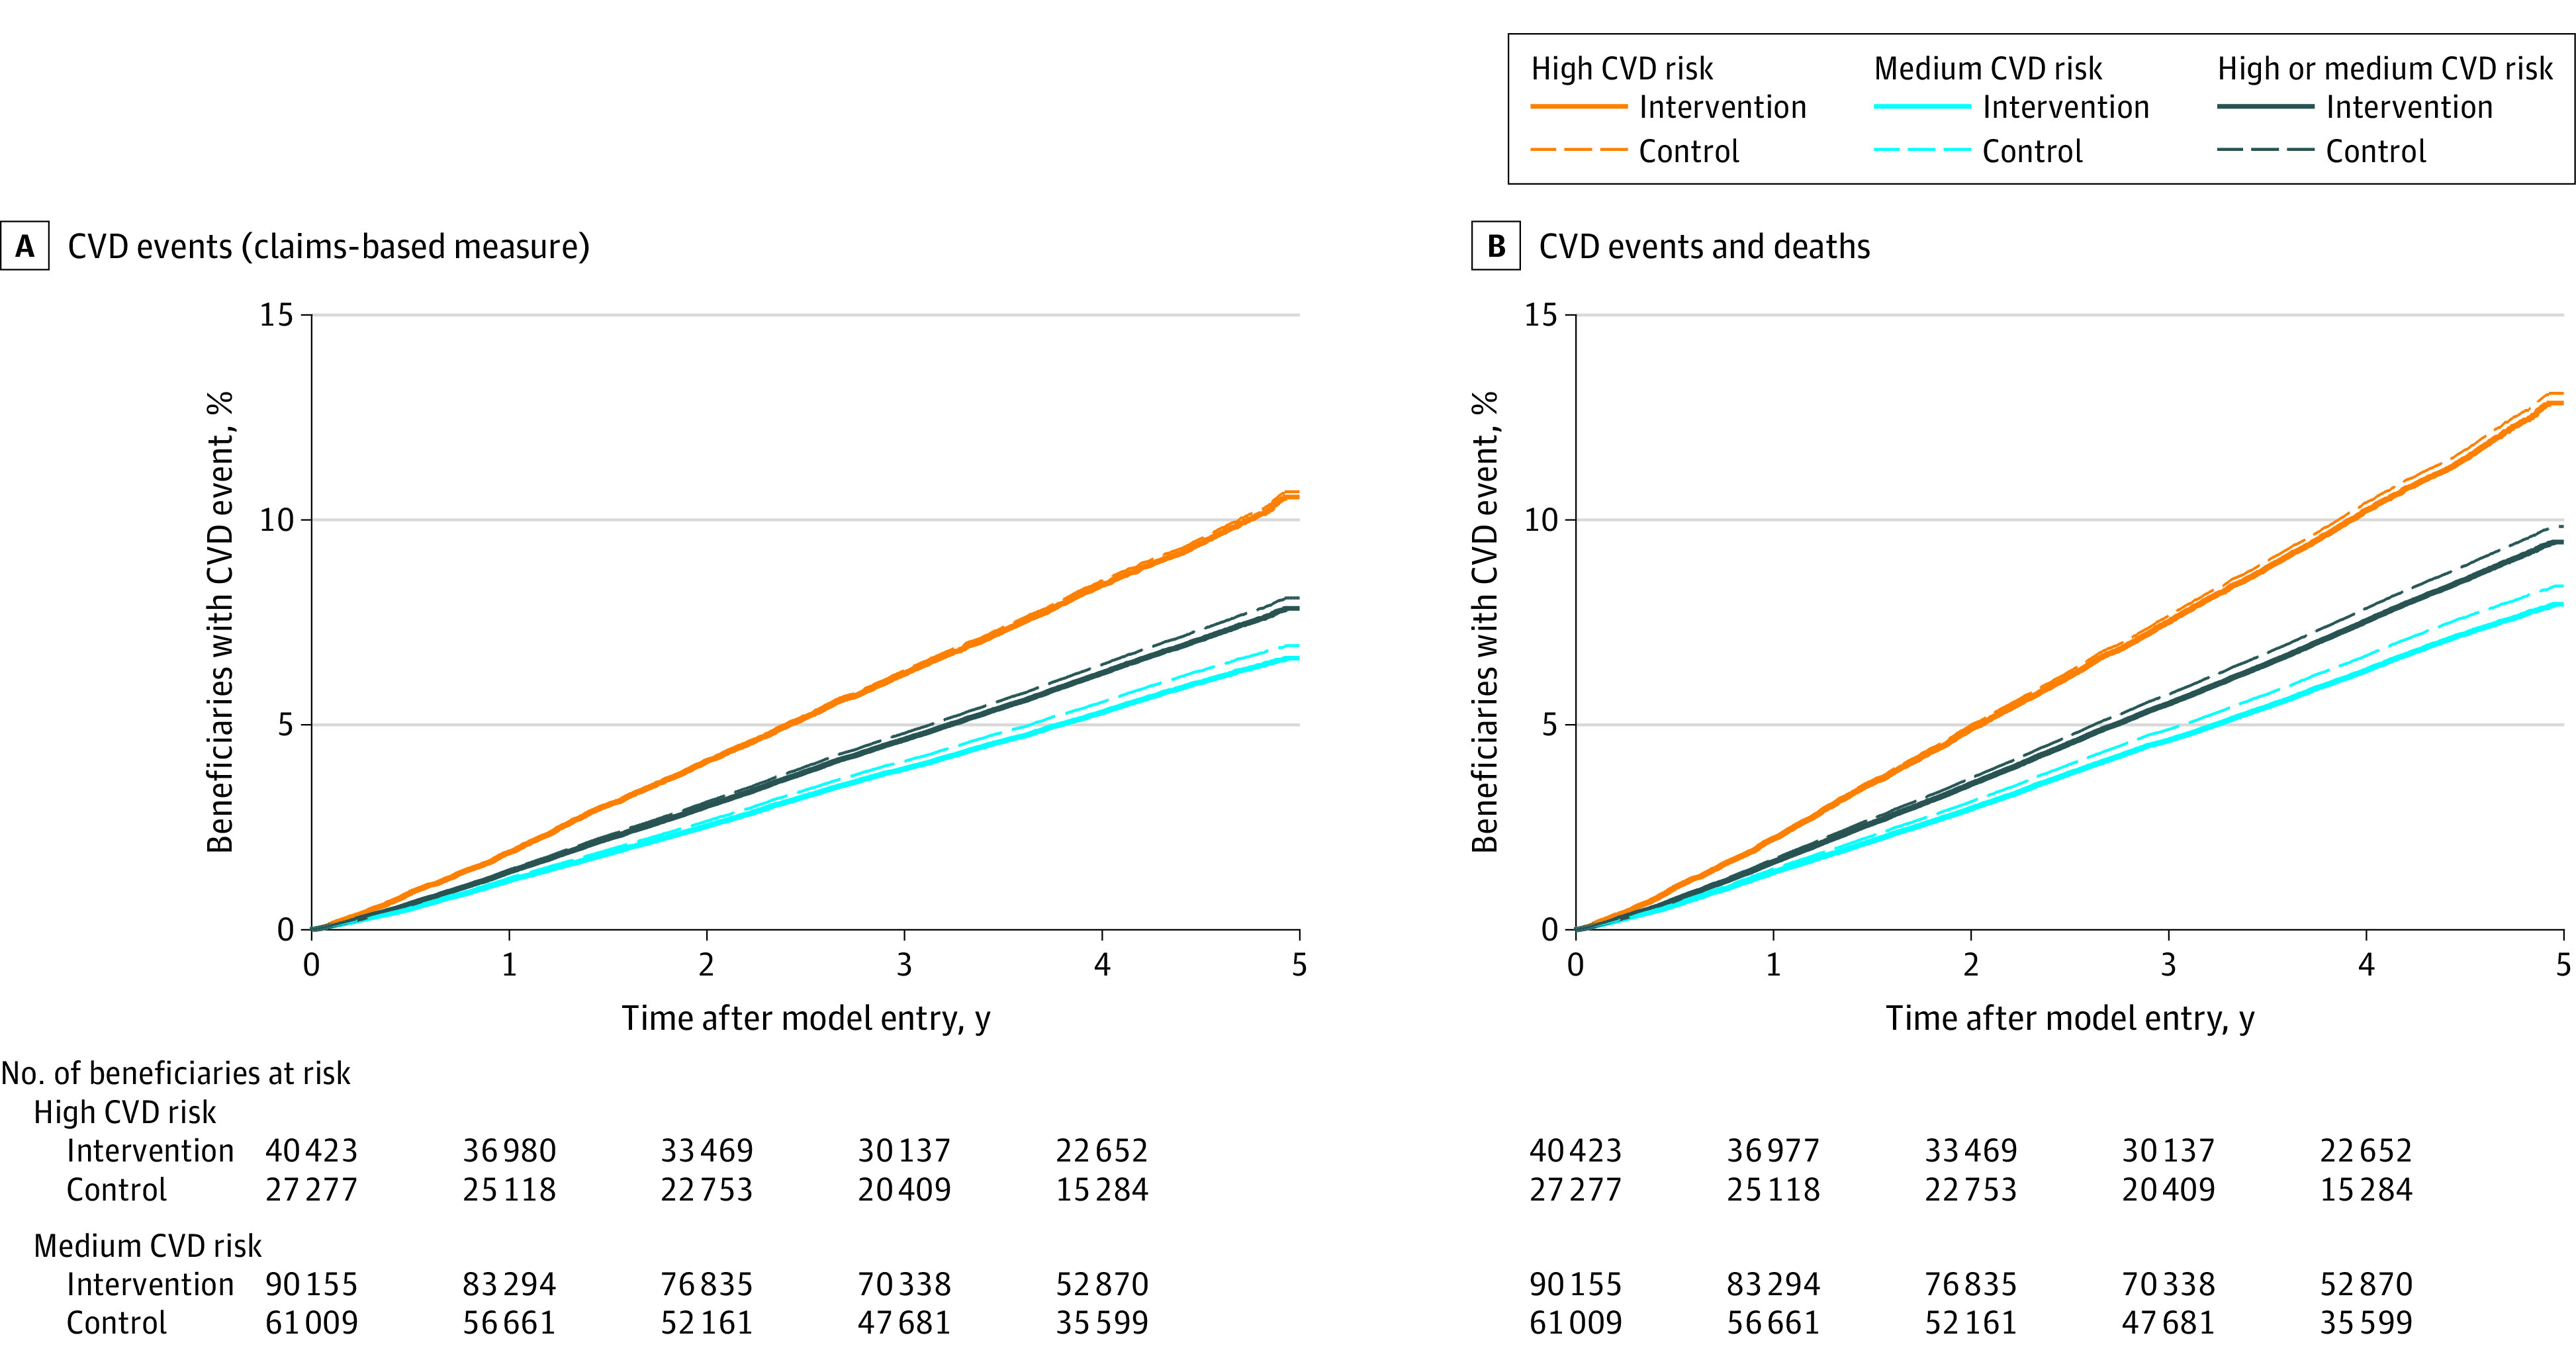
aThe cumulative probabilities are modeled based on Cox proportional-hazards regressions of intervention and control group beneficiaries. The intervention group line represents the percentage of intervention group beneficiaries estimated to experience an event during the model. The control group line represents the percentage of beneficiaries who would experience an event over the same period, if those beneficiaries had the same characteristics (covariates) as intervention group beneficiaries but did not experience the Million Hearts Model.
There was no significant difference in Medicare spending on CVD events between the intervention and control groups (effect estimate for high- and medium-risk beneficiaries = −$1.83 PBPM [90% CI, −$3.97 to $0.30]; P = .16). Likewise, overall Parts A and B spending PBPM was similar between the intervention and control groups—both before and including model payments—despite higher rates of all-cause hospitalizations in the intervention group than the control group (3.7% higher among high- and medium-risk beneficiaries). Model payments were small: an estimated $1.24 per high- and medium-risk beneficiary per month. Risk-reduction payments comprised 28% of the total model payments.
Findings were largely robust to sensitivity tests around outcome definition, regression specification, and population composition (eTables 4-7 in Supplement 2). For example, high- and medium-risk beneficiaries attributed to the intervention organizations (based on visit history) experienced a 1.1% lower rate of CVD events than those in control organizations. This implies a relative effect of 2.1% for model beneficiaries—similar to the main estimate of 3.3%—assuming that only model beneficiaries experienced effects (eTable 7 in Supplement 2). Similarly, analysis results suggest a low risk of bias due to COVID-19. Changes in outcome trends during the pandemic were virtually identical between regions in which the intervention and control group beneficiaries lived (eFigures 2-4 in Supplement 2), implying no meaningful influence on effect estimates (eTable 8 in Supplement 2).
Discussion
The Million Hearts Model tested a strategy of providing payments for CVD risk assessment and risk reduction and asking organizations to commit to CVD preventive care. The model reduced the probability of a first-time CVD event over 5 years by 0.3 percentage points and reduced the probability of a first-time CVD event or CVD death by 0.4 percentage points among high- and medium-risk beneficiaries. As with other primary prevention initiatives, small risk differences at an individual level can translate into meaningful effects at the population level. Results of this study suggest 1 averted first-time CVD event for roughly every 400 high- and medium-risk beneficiaries in the model and 1 averted first-time CVD event or CVD death for roughly every 250 high- and medium-risk beneficiaries—numbers that compare favorably to historical values of numbers needed to screen for common cancer screenings.20 Results did not show effects on the primary outcome of CVD events or the outcome of CVD events or CVD deaths among high-risk beneficiaries alone, although analyses for that population had lower statistical power. There were no statistically significant effects on Medicare spending for any population, despite the intervention group’s increased hospitalization rates.
This study used a prespecified threshold for statistical significance of .10, which is unconventional in the medical literature but common among CMS studies.16,17,18,19 A threshold of .10 indicates, by definition, a greater risk of false-positive results than a threshold of .05 with a greater probability of identifying effective interventions. As noted in the American Statistical Association’s 2016 statement on statistical significance,21 no P value threshold determines whether effects are real. This study’s observed effect on CVD events (P = .09) is supported by findings for the study’s secondary outcomes and for intermediate model outcomes reported previously.6
The Million Hearts Model was a pragmatic trial, and organizations’ model engagement varied. Roughly one-third of randomized organizations entered no beneficiaries into the model, generally citing low payments and challenges submitting registry data. Moreover, among organizations with model beneficiaries, most stopped submitting reassessment data needed to qualify for performance-based payments,22 which could have been recurring payments through 2021, contributing to low model payments overall.
Current guidelines in the US,9 similar to those in other countries,23,24,25 recommend that health care practitioners calculate CVD risk scores and use the scores to engage patients in discussions about CVD prevention. Although previous studies of CVD risk scoring interventions have shown improvement in CVD risk factor control, this is the first study of a CVD risk score–focused intervention to demonstrate declines in CVD events.26
This study did not test risk scoring or other CVD preventive care directly, but tested a policy to incentivize CVD preventive care. Still, results of the study suggest that CVD risk assessment and resulting care were more important than other activities incentivized under the model, which were specific to high-risk beneficiaries. In particular, observed effects were generally larger for medium-risk beneficiaries than high-risk beneficiaries. An earlier Million Hearts Model study showed large increases in CVD risk assessment and subsequent improvements in both CVD medication use and CVD risk factor control.6 Risk scores might be especially useful for identifying medium-risk beneficiaries, whose risk might otherwise be overlooked.27 The findings thus bolster the case for current guideline recommendations advocating CVD risk score use, even though we cannot entirely disentangle effects of risk assessment from organizations’ other CVD efforts.
The study results have implications for value-based payment policy. Systematic reviews show that value-based payment initiatives, both overall28,29 and for CVD care,30 have improved care processes, but few improved long-term outcomes. This randomized pragmatic trial suggests that paying for risk assessment and reduction could improve outcomes of public health importance. However, high rates of model nonparticipation demonstrate the importance of calibrating payments to effort and reducing burden of data sharing.
This study has many strengths. Model participants included various organization types across the US, suggesting broad applicability of findings within the country. The model was large and unusual among CMS models in having a randomized design.31 Also, the study used administrative data (from Medicare and the National Death Index) to track beneficiaries’ outcomes, regardless of organizations’ model engagement.
Limitations
This study has several limitations. First, the main limitation is nonparticipation of many randomized organizations and incomplete entry of beneficiary data into the registry, which could have led to systematic differences between the intervention and control groups. Intervention and control beneficiaries remained broadly similar regarding observable characteristics, although regression adjustment had a meaningful influence on effect estimates. Results from the attributed population were generally consistent with results from the model population, strengthening our confidence that estimates represent model effects. Nevertheless, bias due to the selective participation of organizations and beneficiaries cannot be ruled out.
Second, organizations volunteered for random assignment into the model, which limits generalizability of findings. Intervention organizations were likely motivated to implement the model. Other practitioners might not respond equally to model incentives and supports offered from 2017 to 2021. It is unclear how findings would generalize to an older, younger, or sicker population; to secondary prevention of CVD; or to settings outside the US.
Third, CMS payments to the control group to collect clinical data for CVD risk scores could have induced changes in care for the control group. If this happened, it would bias study results toward the null.
Fourth, this study identified first-time CVD events in Medicare claims, which misses events without a hospitalization or ED visit. The risk was particularly acute during the COVID-19 pandemic, when many people likely avoided the hospital, even for CVD events.32 To address this, effects were estimated on a composite outcome of first-time CVD events (in claims) and CVD deaths. Effect estimates were similar for the 2 outcomes, indicating the model likely reduced first-time MIs and strokes, including fatal cases without claims, by 3% to 4%.
Conclusions
With CMS payments and organizations’ commitment to routine CVD risk assessment, the Million Hearts Model reduced the incidence of first-time MIs and strokes over 5 years, without significant changes in Medicare spending. Results suggest a promising approach to improve CVD outcomes and support guidelines about risk scoring for CVD primary prevention.
Trial protocol and statistical analysis plan
eMethods
Data sharing statement
References
- 1.Lloyd-Jones DM, Huffman MD, Karmali KN, et al. Estimating longitudinal risks and benefits from cardiovascular preventive therapies among Medicare patients: the Million Hearts Longitudinal ASCVD Risk Assessment Tool: a special report from the American Heart Association and American College of Cardiology. J Am Coll Cardiol. 2017;69(12):1617-1636. doi: 10.1016/j.jacc.2016.10.018 [DOI] [PMC free article] [PubMed] [Google Scholar]
- 2.Sanghavi DM, Conway PH. Paying for prevention: a novel test of Medicare value-based payment for cardiovascular risk reduction. JAMA. 2015;314(2):123-124. doi: 10.1001/jama.2015.6681 [DOI] [PubMed] [Google Scholar]
- 3.Mehta NK, Abrams LR, Myrskylä M. US life expectancy stalls due to cardiovascular disease, not drug deaths. Proc Natl Acad Sci U S A. 2020;117(13):6998-7000. doi: 10.1073/pnas.1920391117 [DOI] [PMC free article] [PubMed] [Google Scholar]
- 4.He J, Zhu Z, Bundy JD, Dorans KS, Chen J, Hamm LL. Trends in cardiovascular risk factors in US adults by race and ethnicity and socioeconomic status, 1999–2018. JAMA. 2021;326(13):1286-1298. doi: 10.1001/jama.2021.15187 [DOI] [PMC free article] [PubMed] [Google Scholar]
- 5.Frieden TR, Berwick DM. The “Million Hearts” initiative–preventing heart attacks and strokes. N Engl J Med. 2011;365(13):e27. doi: 10.1056/NEJMp1110421 [DOI] [PubMed] [Google Scholar]
- 6.Peterson GG, Pu J, Magid DJ, et al. Effect of the Million Hearts Cardiovascular Disease Risk Reduction Model on initiating and intensifying medications: a prespecified secondary analysis of a randomized clinical trial. JAMA Cardiol. 2021;6(9):1050-1059. doi: 10.1001/jamacardio.2021.1565 [DOI] [PMC free article] [PubMed] [Google Scholar]
- 7.Conwell L, Barterian L, Rose A, et al. Evaluation of the Million Hearts Cardiovascular Disease Reduction Model: First Annual Report. Mathematica; 2019. Accessed July 6, 2023. https://downloads.cms.gov/files/cmmi/mhcvdrrm-firstann-evalrpt.pdf [Google Scholar]
- 8.US Department of Health and Human Services. Regulations for the Protection of Human Subjects (45 CFR §46) 104 (d)(5).
- 9.Arnett DK, Blumenthal RS, Albert MA, et al. 2019 ACC/AHA Guideline on the Primary Prevention of Cardiovascular Disease: a report of the American College of Cardiology/American Heart Association Task Force on Clinical Practice Guidelines. Circulation. 2019;140(11):e596-e646. doi: 10.1161/CIR.0000000000000678 [DOI] [PMC free article] [PubMed] [Google Scholar]
- 10.Carnethon MR, Pu J, Howard G, et al. ; American Heart Association Council on Epidemiology and Prevention; Council on Cardiovascular Disease in the Young; Council on Cardiovascular and Stroke Nursing; Council on Clinical Cardiology; Council on Functional Genomics and Translational Biology; and Stroke Council . Cardiovascular health in African Americans: a scientific statement from the American Heart Association. Circulation. 2017;136(21):e393-e423. doi: 10.1161/CIR.0000000000000534 [DOI] [PubMed] [Google Scholar]
- 11.Goff DC Jr, Lloyd-Jones DM, Bennett G, et al. 2013 ACC/AHA guideline on the assessment of cardiovascular risk: a report of the American College of Cardiology/American Heart Association Task Force on Practice Guidelines. J Am Coll Cardiol. 2014;63(25 Pt B):2935-2959. doi: 10.1016/j.jacc.2013.11.005 [DOI] [PMC free article] [PubMed] [Google Scholar]
- 12.Moher D, Hopewell S, Schulz KF, et al. CONSORT 2010 explanation and elaboration: updated guidelines for reporting parallel group randomised trials. BMJ. 2010;340:c869. doi: 10.1136/bmj.c869 [DOI] [PMC free article] [PubMed] [Google Scholar]
- 13.Frane JW. A method of biased coin randomization, its implementation, and its validation. Drug Inf J. 1998;32(2):423-432. doi: 10.1177/009286159803200213 [DOI] [Google Scholar]
- 14.Colavincenzo J. Adaptive Randomization Designs: A Senior Project Presented to the Faculty of the Statistics and Mathematics Departments. California Polytechnic State University; 2012. [Google Scholar]
- 15.Sanghavi DM, Conway PH. Approaches to prevention of cardiovascular disease—Reply. JAMA. 2015;314(21):2306-2307. doi: 10.1001/jama.2015.13100 [DOI] [PubMed] [Google Scholar]
- 16.Peikes D, Chen A, Schore J, Brown R. Effects of care coordination on hospitalization, quality of care, and health care expenditures among Medicare beneficiaries: 15 randomized trials. JAMA. 2009;301(6):603-618. doi: 10.1001/jama.2009.126 [DOI] [PubMed] [Google Scholar]
- 17.Bir A, Smith K, Kahwati L, et al. Health Care Innovation Awards (HCIA) Meta-Analysis and Evaluators Collaborative: Annual Report Year 3. RTI International; 2018. Accessed July 11, 2023. https://downloads.cms.gov/files/cmmi/hcia-metaanalysisthirdannualrpt.pdf [Google Scholar]
- 18.Swankoski K, O’Malley A, Tu H, et al. Independent Evaluation of Comprehensive Primary Care Plus (CPC+): Fourth Annual Report. Mathematica; 2022. Accessed July 11, 2023. https://innovation.cms.gov/data-and-reports/2022/cpc-plus-fourth-annual-eval-report [Google Scholar]
- 19.Somers J, Bradley A, Bacon K, et al. CMS Bundled Payments for Care Improvement Advanced Model: Fourth Evaluation Report. The Lewin Group; 2023. [Google Scholar]
- 20.Gates TJ. Screening for cancer: evaluating the evidence. Am Fam Physician. 2001;63(3):513-522. [PubMed] [Google Scholar]
- 21.Wasserstein R. ASA statement on statistical significance and P values. Am Stat. 2016;70(2):131-132. doi: 10.1080/00031305.2016.1154108 [DOI] [Google Scholar]
- 22.Peterson G, Steiner A, Powell R, et al. Evaluation of the Million Hearts® Cardiovascular Disease Reduction Model: Fourth Annual Report. Mathematica; 2022. Accessed July 6, 2023. https://innovation.cms.gov/data-and-reports/2022/mhcvdrrm-fourthannevalrpt [Google Scholar]
- 23.Gudenkauf BM, Jacobsen A, Blumenthal S, Stone NJ, Martin SS. Update in prevention: 2021. Canadian Cardiovascular Society dyslipidemia guidelines. American College of Cardiology. Accessed February 15, 2023. https://www.acc.org/Latest-in-Cardiology/Articles/2021/09/07/12/46/Update-in-Prevention-2021-Canadian-CV-Society-Dyslipidemia-Guidelines
- 24.JBS 3 Board . Joint British Societies’ consensus recommendations for the prevention of cardiovascular disease. Heart. 2014;100(suppl 2):ii1–ii67. [DOI] [PubMed] [Google Scholar]
- 25.Visseren FLJ, Mach F, Smulders YM, et al. ; ESC National Cardiac Societies; ESC Scientific Document Group . 2021 ESC Guidelines on cardiovascular disease prevention in clinical practice. Eur Heart J. 2021;42(34):3227-3337. doi: 10.1093/eurheartj/ehab484 [DOI] [PubMed] [Google Scholar]
- 26.Quispe R, Ferraro RA, Cainzos-Achirica M, et al. Risk assessment for cardiovascular disease prevention: comparing the American and European approaches. American College of Cardiology. Accessed February 15, 2023. https://www.acc.org/Latest-in-Cardiology/Articles/2019/11/21/07/26/Risk-Assessment-for-Cardiovascular-Disease-Prevention
- 27.Morieri ML, Lamacchia O, Manzato E, Giaccari A, Avogaro A; Lipid-Lowering-Relevance Study Group . Physicians’ misperceived cardiovascular risk and therapeutic inertia as determinants of low LDL-cholesterol targets achievement in diabetes. Cardiovasc Diabetol. 2022;21(1):57. doi: 10.1186/s12933-022-01495-8 [DOI] [PMC free article] [PubMed] [Google Scholar]
- 28.Eijkenaar F, Emmert M, Scheppach M, Schöffski O. Effects of pay for performance in health care: a systematic review of systematic reviews. Health Policy. 2013;110(2-3):115-130. doi: 10.1016/j.healthpol.2013.01.008 [DOI] [PubMed] [Google Scholar]
- 29.Mendelson A, Kondo K, Damberg C, et al. The effects of pay-for-performance programs on health, health care use, and processes of care: a systematic review. Ann Intern Med. 2017;166(5):341-353. doi: 10.7326/M16-1881 [DOI] [PubMed] [Google Scholar]
- 30.Husaini M, Joynt Maddox KE. Paying for performance improvement in quality and outcomes of cardiovascular care: challenges and prospects. Methodist Debakey Cardiovasc J. 2020;16(3):225-231. doi: 10.14797/mdcj-16-3-225 [DOI] [PMC free article] [PubMed] [Google Scholar]
- 31.Centers for Medicare & Medicaid Services . Synthesis of evaluation results across 21 Medicare models, 2012–2020. Accessed July 6, 2023. https://innovation.cms.gov/data-and-reports/2022/wp-eval-synthesis-21models
- 32.Stewart KA, Blue L, Kranker K, et al. Hospital use for myocardial infarction and stroke among Medicare beneficiaries from March to December 2020. JAMA Cardiol. 2021;6(11):1340-1342. doi: 10.1001/jamacardio.2021.2729 [DOI] [PMC free article] [PubMed] [Google Scholar]
Associated Data
This section collects any data citations, data availability statements, or supplementary materials included in this article.
Supplementary Materials
Trial protocol and statistical analysis plan
eMethods
Data sharing statement