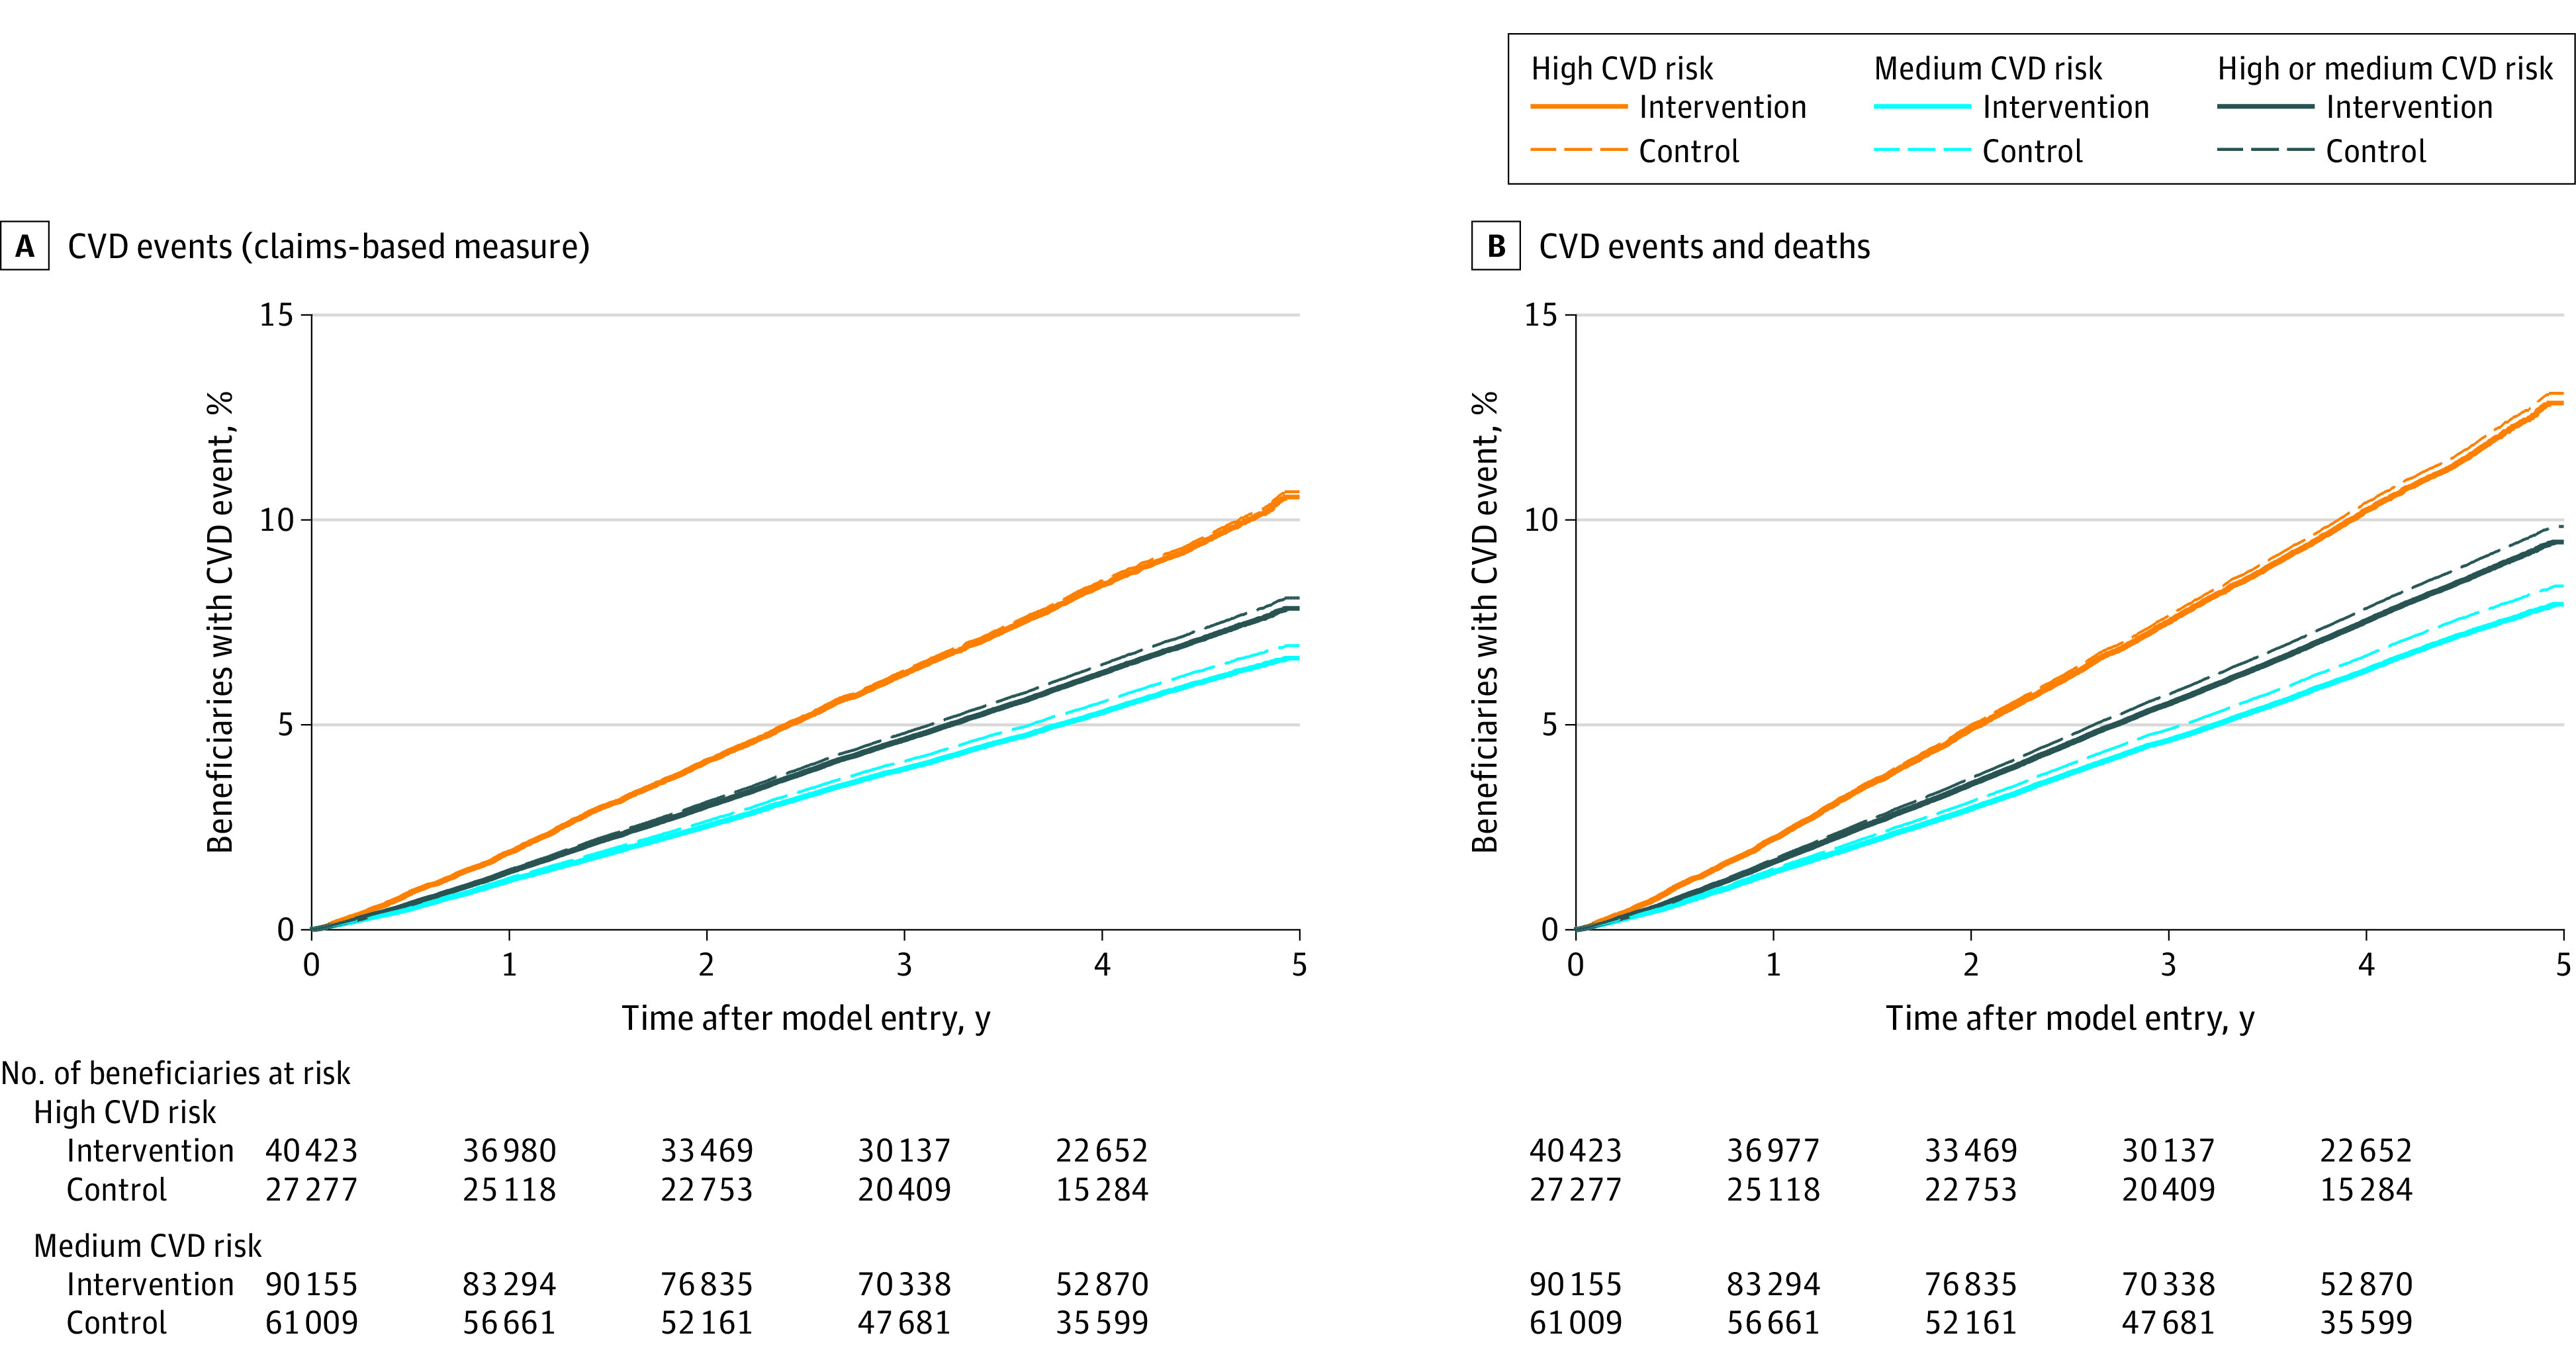
Figure 2. Cumulative Probabilitya of First-Time Cardiovascular Disease (CVD) Event (Regression-Adjusted Mean Cumulative Probability Functions).

aThe cumulative probabilities are modeled based on Cox proportional-hazards regressions of intervention and control group beneficiaries. The intervention group line represents the percentage of intervention group beneficiaries estimated to experience an event during the model. The control group line represents the percentage of beneficiaries who would experience an event over the same period, if those beneficiaries had the same characteristics (covariates) as intervention group beneficiaries but did not experience the Million Hearts Model.
