

Abstract
The purpose of this research is to evaluate the accuracy of AI-assisted quantification in comparison to conventional CT parameters reviewed by a radiologist in predicting the severity, progression, and clinical outcome of disease. The current study is a cross-sectional study that was conducted on patients with the diagnosis of COVID-19 and underwent a pulmonary CT scan between August 23th, 2021 to December 21th, 2022. The initial CT scan on admission was used for imaging analysis. The presence of ground glass opacity (GGO), and consolidation were visually evaluated. CT severity score was calculated according to a semi-quantitative method. In addition, AI based quantification of GGO and consolidation volume were also performed. 291 patients (mean age: 64.7 ± 7; 129 males) were included. GGO + consolidation was more frequently revealed in progress-to-severe group whereas pure GGO was more likely to be found in non-severe group. Compared to non-severe group, patients in progress-to-severe group had larger GGO volume percentage (40.6%± 11.9%versus 21.7%± 8.8%, p ˂0.001) as well as consolidation volume percentage (4.8% ± 2% versus 1.9% ± 1%, p < 0.001). Among imaging parameters, consolidation volume percentage and the largest area under curve (AUC) in discriminating non-severe from progress-to-severe group (AUC = 0.91, p < 0.001). According to multivariate regression, consolidation volume was the strongest predictor for disease progression. In conclusion, the consolidation volume measured on the initial chest CT was the most accurate predictor of disease progression, and a larger consolidation volume was associated with a poor clinical outcome. In patients with COVID-19, AI-assisted lesion quantification was useful for risk stratification and prognosis evaluation.
Key Words: COVID-19, computed tomography, pulmonary CT scan, artificial intelligence
Ethical Publication Statement
We confirm that we have read the Journal’s position on issues involved in ethical publication and affirm that this report is consistent with those guidelines.
Coronavirus disease 2019 (COVID-19), which is caused by the severe acute respiratory syndrome coronavirus (SARS-CoV-2), has been the most significant global health concern over the past few years.1 Numerous material and human resources have been devoted to the diagnosis and treatment of COVID-19, whose clinical spectrum ranges from moderate to severe disease. The majority of confirmed cases are classified as mild, whereas a few require hospitalization or even lead to respiratory failure and mortality.2,3 Important for providing appropriate management and follow-up assessments while maximizing the use of limited resources is the timely identification of high-risk patients.3 It has been established that chest computed tomography (CT) is the imaging modality of choice for rapid identification and monitoring of the disease course in COVID-19 pneumonia.4 Comparatively to reverse transcription polymerase chain reaction (RT-PCR), chest CT has an extremely high sensitivity for identifying COVID-19 pneumonia. It was also revealed that the severity of the pulmonary lesions played a role in the patient's prognosis.4,5 However, visual evaluation of CT images may be associated with greater variability, and the vast volume of daily CT scans is a significant challenge for radiologists.6 Artificial intelligence (AI) using deep learning has been advocated for automated reading and quantification of parenchymal involvement on CT-scans, helping speed up the reading time and reducing the burden of the radiologists.7 In comparison to visual analysis, it permits a more precise quantification of pulmonary lesions based on varying attenuation thresholds.7 Furthermore, AI was found to be useful in identifying COVID-19 pneumonia of other origin using chest CT with good diagnostic accuracy as well as predicting COVID-19 respiratory problems.8 However, there is a lack of consensus in the scientific literature regarding the factors that can predict the probability of death or experiencing a worsening of clinical condition in COVID-19 patients.9 Using a combination of AI-based CT analysis and clinical and laboratory data, a more accurate prognosis could be determined. Therefore, the purpose of this research is to evaluate the accuracy of AI-assisted quantification in comparison to conventional CT parameters reviewed by a radiologist in predicting the severity, progression, and clinical outcome of the disease.
Materials and Methods
The study protocol was approved by the research committee of AJA University of Medical Sciences, and the ethics committee also approved it (Code No: IR.AJAUMS.REC.1400.209). The current study is a cross-sectional study that was conducted on patients who were admitted to the 501 Army Hospital in Tehran with the diagnosis of COVID-19 and underwent a pulmonary CT scan between August 23th, 2021 to December 21th, 2022. The SARS-CoV2 positivity was determined by reverse-transcriptase polymerase chain reaction (RT-PCR) of standard nasopharyngeal and oropharyngeal swab specimens. Only symptomatic patients were included who had at least one of the following symptoms: fever or chills, dry cough, fatigue, sputum production, shortness of breath, muscle or joint pain, sore throat, headache, gastrointestinal symptoms, and loss of smell or taste. The exclusion criteria were: i) the image quality of chest CT was significantly impaired so that AI-based quantification was not feasible; ii) patients had superimposed infections of other pathogens; and iii) patients were initially classified as severe on admission. The initial CT scan on admission was used for further analysis. Medical history data including age, sex, body mass index (BMI), hypertension, diabetes, and chronic obstructive pulmonary disease (COPD) were recorded. Also, symptoms of patients at the beginning of admission to the hospital such as fever, cough, and shortness of breath were recorded. Chest CT scans were obtained using a 16-slice CT scanner (Philips Incisive, Philips Healthcare) in the supine position during an inspiratory breath hold. The CT acquisition protocol included a peak tube voltage of 120 kV, automatic tube current modulation (150–350 mAs), slice thickness = 1.25 mm, slice interval = 1 mm, matrix = 512 × 512, and field of view = 350 mm × 350 mm. Two datasets with different kernels were reconstructed for the image interpretation of the lung (sharp kernel, Lung, GE Medical Systems) and mediastinum (smooth kernel, Stnd, GE Medical Systems). All datasets were reconstructed with lung kernel and soft kernel for evaluation of pulmonary parenchyma and mediastinum. The lung window was set at a level of − 600 HU and width of 1200 HU whereas the mediastinal window was set at a level of 40 HU and a width of 350 HU. The presence of the following lesions was visually assessed: i) GGO, which was defined as hazy increased attenuation with preserved margins of bronchus and vasculature; ii) consolidation, which was defined as opacification with obscured margins of bronchus and vasculature; iii) reticulation; iv) nodules; v) lymphadenopathy; vi) pleural effusion; and vii) other abnormalities 10,11. Semi-quantitative CT severity scoring proposed by Yang et al. and Pan et al.10,11 was calculated for each of the 5 lobes regarding the extent of pathologic involvement, as follows: 0, no involvement; 1, < 5% involvement; 2, 5–25% involvement; 3, 26–50% involvement; 4, 51–75% involvement; and 5, > 75% involvements. The resulting global CT score was the sum of each individual lobar score from 0 to 25. Two chest radiologists (with 5-year and 15-year experience of chest imaging) independently evaluated all patients without knowing of clinical characteristics and prognosis. Any disagreement between two observers was resolved by consensus. The U-net model is a popular deep learning architecture used for image segmentation tasks.12-14 In this study, the U-net model was adapted with batch normalization after each layer to improve its performance and convergence during training. After training the model on a dataset consisting of 3393 slices from 36 patients, the Dice similarity score was found to be 0.97. The Dice similarity score is a common metric used to evaluate the accuracy of image segmentation models, and a score of 0.97 indicates that the model performed very well in accurately segmenting the target structures in the images.12-15 Overall, the use of batch normalization after each layer in the U-net model appears to have significantly improved its performance in this study, leading to a high level of accuracy in the segmentation task. In the recognition of pneumonia regions, the semantic segmentation technology based on deep learning was used to perform one-time segmentation extraction of the pneumonia regions in the input lung parenchyma. Ronneberger et al.12 proposed the U-net for the segmentation of anatomic structures in microscopy images. Since then, it has been used for a wide range of segmentation tasks and various modified versions have been studied.13,14 We used trained U-net (LTRC Lobes) model for lung segmentation. This model was trained on a subset of the LTRC dataset. The model performs segmentation of individual lung-lobes (Figure 1).15 The volumes of GGO and consolidation were automatically measured according to different attenuation thresholds (− 750 HU ~ − 300 HU for GGO, − 300 HU ~ 50 HU for consolidation). The percentages of GGO volume as well as consolidation volume versus whole lung volume were also recorded. Two chest radiologists (with 5-year and 15-year experience of chest imaging) independently supervised the lesion quantification and manual adjustment of lesion regions was made when necessary. Any disagreement between two observers was resolved by consensus. Disease severity was evaluated according to the 6th edition of diagnosis and treatment protocols for pneumonia caused by novel coronaviruses issued by Chinese centers for disease control and prevention.4.6 Patients with a confirmed diagnosis of COVID-19 were classified into four types as described below: i) mild, patients with mild symptoms and no imaging findings of pneumonia; ii) moderate, patients with fever, respiratory symptoms, and imaging findings of pneumonia; iii) severe, patients met any of the following criteria: a. respiratory distress, respiratory rate 30 times/min; b. SpO2 93% at rest; c. PaO2/FiO2 300 mmHg; d. rapid progression of disease involvement [more than 50%] on chest CT within 24 to 48 h; iv) critical; patients met any of For further analysis, patients were grouped as "non-severe" (classified as mild or moderate type) and "progress-to-severe" (classified as severe or critical type) according to the most severe classification during hospitalization. In addition, the mortality rate was also recorded. After collecting the study data, they were entered into SPSS software (version 28, IBM Corporation, Armonk, NY) and analyzed. After using the Kolmogorov-Smirnov test, the mean (SD) were used to describe continuous variables, and the number (percentage) was used to describe categorical variables. T-student, chi-square tests, univariate and multivariate logistic regression, and ROC curve were used to compare. A p-value less than 0.05 was considered statistically significant (two-sided).
Fig 1.
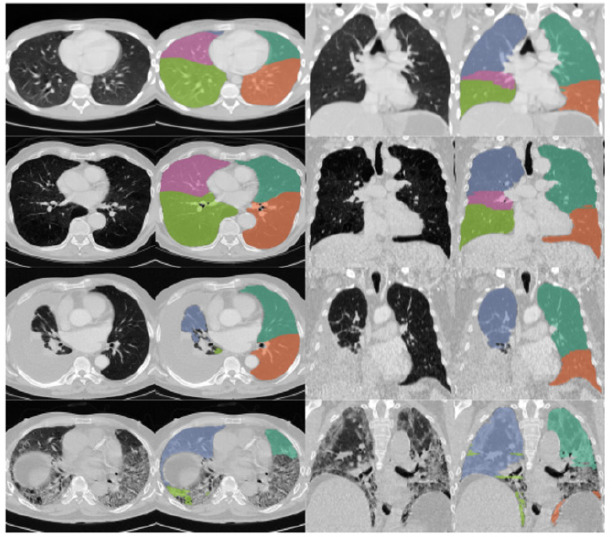
Lung segmentation using the U-net model (LTRC Lobes). Adapted from Hofmanninger J.,et al.,15
Results
From August 23th, 2021 to December 21th, 2022, 316 patients with confirmed COVID-19 infection were retrospectively reviewed. Three patients were excluded due to significantly impaired image quality of chest CT whereas four patients were excluded because of having superimposed infection of other pathogens. Moreover, another 18 patients who were classified as severe type were also ruled out. 291 patients with mean (SD) of age was 64.7 (+/-7.0) years, with 1.2 female to male proportion were included in the further analysis. During hospitalization, 93 (32%) patients progressed to severe group with mean (SD) age 69.9 (+/-5.4) years that was higher than non-severe group, the percentage of men was 65.5% which was higher than non-severe group.
Table 1.
Demographic and clinical characteristics of the patients.
| Variables | All patients (n=291) | Non-severe group (n=198) | Progress-to-severe group (n=93) | p-value* |
|---|---|---|---|---|
| Age, year | 64.7(7.0) | 62.5(6.5) | 69.4(5.7) | ˂0.001 |
| Men, No (%) | 129(44.3) | 72(36.4) | 57(61.3) | ˂0.001 |
| Clinical symptoms | ||||
| No symptom, No (%) | 36(12.4) | 28(14.1) | 8(8.6) | 0.181 |
| Fever, No (%) | 147(50.5) | 101(51.0) | 46(49.5) | 0.805 |
| Cough, No (%) | 145(49.8) | 93(47.0) | 52(55.9) | 0.155 |
| Shortness of breath, No (%) | 128(43.9) | 73(36.9) | 58(62.4) | ˂0.001 |
| Comorbidity | ||||
| Diabetes, No (%) | 72(24.7) | 39(19.7) | 33(35.5) | 0.004 |
| Hypertension, No (%) | 127(43.6) | 83(41.9) | 44(47.3) | 0.387 |
| COPD, No (%) | 30(10.3) | 14(7.1) | 16(17.2) | 0.008 |
| Clinical outcome, No (%) | ||||
| Death, No (%) | 12(4.1) | 3(1.5) | 9(9.7) | 0.002 |
All patients were followed up at a mean time of 23.2±11.7 days. For patients from progressed to severe group, the mean interval between admission and disease progression was 11.3±3.4 days. Detailed clinical characteristics are given in Table 1. As for subgroup analysis, GGO + consolidation was more frequently revealed in progress-to-severe group whereas pure GGO was more likely to be found in non-severe group (Table 2). Moreover, patients in progress-to-severe group had higher incidence of pleural effusion, nodule and larger number of involved lobes (Table 2). The regions of lesion (pneumonia) were reliably segmented by AI assisted quantification, with a Dice coefficient of 0.845 (CI 0.751–0.944, p=0.005). Compared to non-severe group, patients in progress-to-severe group had larger GGO volume as well as consolidation volume. The GGO volume percentage and consolidation volume percentage was significantly higher in severe group (Table 2 and Figures 2 and Figure 3). To determine the predictive value of CT-derived parameters for disease severity progression and clinical outcome, ROC curve analysis and logistic regression were conducted (Figure 2 and Table 3). The results revealed that consolidation volume percentage had the greatest AUC in distinguishing between the non-severe and progress-to-severe groups as well as predicting clinical outcomes (Figure 3). Table 3 demonstrates that all CT-derived parameters had equal sensitivity in distinguishing between the non-severe and progress-to-severe groups, as well as predicting clinical outcomes. However, when it came to specificity, there were notable differences. The consolidation volume percentage yielded the highest specificity in distinguishing between the two groups and predicting clinical outcomes. Univariate analysis revealed that consolidation volume percentage was the strongest predictor of disease severity progression, followed by CT severity score, GGO + consolidation volume percentage, and GGO volume percentage (Table 4). These findings were confirmed after multivariate regression adjustment, indicating that consolidation volume percentage remained the strongest predictor of disease severity progression (Table 4).
Table 2.
Initial chest CT findings between the non-severe and progress-to-severe groups and clinical outcome.
| Variables | All patients (n=291) | Non-severe group (n=198) | Progress-to-severe group (n=93) | p-value* |
|---|---|---|---|---|
| Pure GGO, No (%) | 58 (19.9) | 50 (25.2) | 8 (8.6) | 0.001 |
| GGO + Consolidation, No (%) | 179 (61.5) | 96 (48.5) | 83 (89.2) | ˂0.001 |
| Pure consolidation, No (%) | 6(2) | 4(2) | 2 (2.1) | 0.999 |
| CT severity score | 13.2(3.0) | 11.8(1.9) | 16.3(2.7) | ˂0.001 |
| Reticulation, No (%) | 32(11.0) | 18(9.1) | 14(15.1) | 0.129 |
| Nodule, No (%) | 8(2.7) | 0() | 8(8.6) | ˂0.001 |
| Cavitation, No (%) | 11(3.8) | 4(2.0) | 7(7.5) | 0.022 |
| Emphysema, No (%) | 45(15.5) | 23(11.6) | 22(23.7) | 0.008 |
| Pleural effusion, No (%) | 61(21.0) | 23(11.6) | 38(40.9) | ˂0.001 |
| Lymphadenopathy, No (%) | 36(12.4) | 16(8.1) | 20(21.5) | 0.001 |
| AI-assisted quantification | ||||
| GGO volume percentage | 27.8(13.2) | 21.7(8.8) | 40.6(11.9) | ˂0.001 |
| Consolidation volume percentage | 2.8(1.9) | 1.9(1.0) | 4.8(2.0) | ˂0.001 |
| GGO+ Consolidation volume percentage | 30.6(14.5) | 23.7(9.0) | 45.4(12.9) | ˂0.001 |
AI: artificial intelligence, GGO: ground glass opacity. In case of CT semi-quantitative score, the two group are not different about
AI: artificial intelligence, GGO: ground glass opacity. In case of CT semi-quantitative score, the two group are not different about characteristics are given in Table 1. As for subgroup analysis, GGO + consolidation was more frequently revealed in progress-to-severe group whereas pure GGO was more likely to be found in non-severe group (Table 2). Moreover, patients in progress-to-severe group had higher incidence of pleural effusion, nodule and larger number of involved lobes (Table 2). The regions of lesion (pneumonia) were reliably segmented by AI assisted quantification, with a Dice coefficient of 0.845 (CI 0.751–0.944, p=0.005). Compared to non-severe group, patients in progress-to-severe group had larger GGO volume as well as consolidation volume. The GGO volume percentage and consolidation volume percentage was significantly higher in severe group (Table 2 andFigures 2 and Figure 3). To determine the predictive value of CT-derived parameters for disease severity progression and clinical outcome, ROC curve analysis and logistic regression were conducted (Figure 2 and Table 3). The results revealed that consolidation volume percentage had the greatest AUC in distinguishing between the non-severe and progress-to-severe groups as well as predicting clinical outcomes (Figure 3). Table 3 demonstrates that all CT-derived parameters had equal sensitivity in distinguishing between the non-severe and progress-to-severe groups, as well as predicting clinical outcomes. However, when it came to specificity, there were notable differences. The consolidation volume percentage yielded the highest specificity in distinguishing between the two groups and predicting clinical outcomes. Univariate analysis revealed that consolidation volume percentage was the strongest predictor of disease severity progression, followed by CT severity score, GGO + consolidation volume percentage, and GGO volume percentage (Table 4). These findings were confirmed after multivariate regression adjustment, indicating that consolidation volume percentage remained the strongest predictor of disease severity progression (Table 4).
Fig 2.

Disease severity progression
Fig 3.

Clinical outcome
Table 3.
ROC curve analysis of CT-derived parameters for predicting progression and clinical outcome.
| Variables | Best cut of | AUC | 95% CI | p-value | Sensitivity (%) | Specificity (%) |
|---|---|---|---|---|---|---|
| Disease severity progression* | ||||||
| CT severity score | 10.5 | 0.88 | 0.84-0.92 | 0.022 | 0.98 | 0.30 |
| GGO volume percentage | 10.4 | 0.89 | 0.85-0.93 | 0.020 | 0.99 | 0.10 |
| Consolidation volume percentage | 1.7 | 0.94 | 0.91-0.96 | 0.014 | 0.98 | 0.46 |
| GGO+ Consolidation volume percentage | 15.3 | 0.91 | 0.87-0.94 | 0.018 | 0.99 | 0.15 |
| Death | ||||||
| CT severity score | 13.5 | 0.88 | 0.80-0.95 | ˂0.001 | 0.92 | 0.66 |
| GGO volume percentage | 29.3 | 0.88 | 0.81-0.94 | ˂0.001 | 0.92 | 0.67 |
| Consolidation volume percentage | 4.0 | 0.91 | 0.87-0.96 | ˂0.001 | 0.92 | 0.81 |
| GGO+ Consolidation volume percentage | 33.2 | 0.84 | 0.83-0.95 | ˂0.001 | 0.92 | 0.69 |
AUC: area under curve, CT: computed tomography, CI: confidence interval, GGO: ground glass opacity, ICU: intensive care unit, ROC: receiver operating characteristic. *Disease severity progression was defined as prediction of progress-to-severe group.
Table 4.
Univariate and multivariate analysis of CT-derived parameters for prediction of disease severity progression and clinical outcome.
| Variables | Univariate analysis | Multivariate analysis1 | ||||
|---|---|---|---|---|---|---|
| Odds Ratio | 95% CI | p-value | Odds Ratio | 95% CI | p-value | |
| Disease severity progression* | ||||||
| CT severity score | 38.11 | 5.12-280.00 | ˂0.001 | 16.57 | 2.1-126.39 | 0.007 |
| GGO volume percentage | 10.34 | 1.36-78.24 | 0.024 | 2.59 | 0.32-21.03 | 0.37 |
| Consolidation volume percentage | 38.69 | 9.27-161.48 | ˂0.001 | 24.50 | 5.69-105.59 | ˂0.001 |
| GGO+ Consolidation volume percentage | 16.43 | 2.20-122.43 | 0.006 | 5.74 | 0.72-45.48 | 0.098 |
| Death | ||||||
| CT severity score | 1.43 | 1.19-1.73 | ˂0.001 | 8.55 | 0.95-80.70 | 0.061 |
| GGO volume percentage | 22.00 | 2.79-172.99 | 0.003 | 9.22 | 0.97-88.05 | 0.054 |
| Consolidation volume percentage | 45.83 | 5.79-362.69 | ˂0.001 | 23.64 | 2.48-225.39 | 0.006 |
| GGO+ Consolidation volume percentage | 24.27 | 3.08-190.98 | 0.022 | 10.78 | 1.08-107.28 | 0.042 |
Discussion
In the current study we tested the accuracy of AI-assisted quantification in comparison to conventional CT parameters reviewed by radiologists in predicting the severity, progression, and clinical outcome of COVID-19 infection. The main finding of the current study confirmed the value of AI assisted lesion quantification for predicting progressionof disease severity. The consolidation volume on initial chest CT was the strongest predictor among all CT-derived parameters and larger consolidation volume was associated with unfavorable clinical outcome. Chest CT is regarded as a crucial diagnostic tool in management of COVID-19 infection for the detection of pulmonary involvement and serial monitoring of disease progression. In addition to visual diagnosis, the most recent technological advancements in the field of artificial intelligence permit automatic lesion quantification using predetermined attenuation thresholds.16 Improved COVID-19 risk stratification is critical for cost-effective patient care because it prompts safe hospital discharge of low-risk patients and prolonged in-hospital and follow-up surveillance of high-risk patients.17,18 Chest CT has been intensively examined as a potential tool for COVID-19 diagnosis, with different recommendations ranging from adopting CT as a first-line screening modality to warnings against overuse and a false sense of security. Our findings demonstrate that chest CT should be seen as a risk stratification tool rather than a diagnostic tool in and of itself. However, it is critical to recognize that chest CT should not be seen as the single prognosticator in COVID-19 patients, as other clinical and biochemical variables have previously been linked to poor outcomes.19,20 The AI-based severity assessment is uniform, reproducible, and standardized, but prognosis scores and affected region percentages indicated by radiologists can vary greatly. The disparity between the number of radiologists and CT examinations is widening daily.21 Several studies indicate that incorporating the AI-based severity score into the daily practice of triaging COVID-19 patients could significantly enhance clinical outcomes.22-24 This AI-based quantification was advantageous not only for disease diagnosis but also for prognosis evaluation, according to the current findings. Comparatively to conventional clinical characteristics, the volume of consolidation on the initial chest CT was the most accurate predictor of progression to severe disease. Even though GGO is the most common finding on chest CT, consolidation has been reported to be more prevalent in severe and critical cases.25,26 Similar to other forms of viral pneumonia, the underlying pathology of consolidation in COVID-19 is the complete filling of alveoli with inflammatory exudation.27 The ventilation function is severely impaired when viral pneumonia is present along with necrotizing bronchitis and diffuse alveolar injury.28 Consequently, it is plausible that patients with a larger area of consolidation on their initial chest CT are more likely to develop severe or life-threatening conditions. Another significant finding of the current study was the superiority of AI-assisted quantification over conventional CT severity scores in predicting disease progression. The semi-quantitative CT score was initially created to assess the severity of severe acute respiratory syndrome.29 However, this score does not take different lesion components, such as consolidation and GGO, into account. Li et al.24 conducted a study in 2020 to assess AI-assisted quantification on the initial chest CT for predicting disease progression and clinical prognosis in COVID-19 patients. According to the findings of this study, the predictive value of consolidation volume exceeded that of GGO volume. In another study, Ren et al, used AI to explore the features of CT imaging of 58 patients with COVID-19. The AUC of the volume percentage of pneumonia lesions for the whole lung for the diagnosis of severe type COVID-19 was 0.740, with sensitivity and specificity of 91.2% and 58.8%, respectively.30 Among all imaging characteristics used in the evaluation of clinical outcomes, consolidation volume showed the highest diagnostic accuracy in predicting which patients would continue to experience serious adverse events. This was consistent with the findings of Li et al. 24 and Meiler et al.31 semi-quantitative chest CT investigations, in which severe parenchymal involvement was associated with a poor clinical outcome. Despite the above-mentioned encouraging findings, the present study has a number of limitations. First, radiomics analysis, which facilitates the extraction of a large number of quantitative features from medical images for diagnosis and prognosis evaluation, was not utilized in the current study. In addition, the present study's sample size was inadequate to include additional clinical characteristics,32 and imaging features in multivariate analysis. To validate the current findings, additional investigations involving more patients are required.
In conclusion, the consolidation volume measured on the initial chest CT was the most accurate predictor of disease progression, and a larger consolidation volume was associated with a poor clinical outcome. In patients with COVID-19, AI-assisted lesion quantification was useful for risk stratification and prognosis evaluation.
Acknowledgments
None
List of acronyms
- AUC
area under curve
- BMI
body mass index
- COPD
chronic obstructive pulmonary disease
- COVID-19
Coronavirus disease 2019
- GGO
ground glass opacity
Funding Statement
Funding: The authors have not received specific funding.
Contributor Information
Saeid Sadeghi Joni, Email: saeedsadeghi69@gmail.com.
Fakhereh Pashaei, Email: fakhereh.pashaee@yahoo.com.
Hojat Ebrahiminik, Email: dr_ebrahiminik@yahoo.com.
Mahmood Karimi, Email: dr.karimi.ma@gmail.com.
References
- 1.Ciotti M, Ciccozzi M, Terrinoni A, Jiang WC, Wang CB, Bernardini S. The COVID-19 pandemic. Crit Rev Clin Lab Sci. 2020. Sep;57(6):365-388. doi: 10.1080/10408363.2020.1783198. Epub 2020 Jul 9. PMID: 32645276. [DOI] [PubMed] [Google Scholar]
- 2.Msemburi W, Karlinsky A, Knutson V, Aleshin-Guendel S, Chatterji S, Wakefield J. The WHO estimates of excess mortality associated with the COVID-19 pandemic. Nature. 2023. Jan;613(7942):130-137. doi: 10.1038/s41586-022-05522-2. Epub 2022 Dec 14. PMID: 36517599; PMCID: PMC9812776. [DOI] [PMC free article] [PubMed] [Google Scholar]
- 3.Kang J, Kang J, Seo WJ, Park SH, Kang HK, Park HK, Hyun J, Song JE, Kwak YG, Kim KH, Kim YS, Lee SS, Koo HK. Prediction models for respiratory outcomes in patients with COVID-19: integration of quantitative computed tomography parameters, demographics, and laboratory features. J Thorac Dis. 2023. Mar 31;15(3):1506-1516. doi: 10.21037/jtd-22-1076. Epub 2023 Mar 9. PMID: 37065603; PMCID: PMC10089866. [DOI] [PMC free article] [PubMed] [Google Scholar]
- 4.Vandenberg O, Martiny D, Rochas O, van Belkum A, Kozlakidis Z. Considerations for diagnostic COVID-19 tests. Nat Rev Microbiol. 2021. Mar;19(3):171-183. doi: 10.1038/s41579-020-00461-z. Epub 2020 Oct 14. PMID: 33057203; PMCID: PMC7556561. [DOI] [PMC free article] [PubMed] [Google Scholar]
- 5.Jafari R, Cegolon L, Jafari A, Kashaki M, Otoukesh B, Ghahderijani BH, Izadi M, Saadat SH, Einollahi B, Javanbakht M. Large saddle pulmonary embolism in a woman infected by COVID-19 pneumonia. Eur Heart J. 2020. Jun 7;41(22):2133. doi: 10.1093/eurheartj/ehaa402. PMID: 32374381; PMCID: PMC7239188. [DOI] [PMC free article] [PubMed] [Google Scholar]
- 6.Long C, Xu H, Shen Q, Zhang X, Fan B, Wang C, Zeng B, Li Z, Li X, Li H. Diagnosis of the Coronavirus disease (COVID-19): rRT-PCR or CT? Eur J Radiol. 2020. May;126:108961. doi: 10.1016/j.ejrad.2020.108961. Epub 2020 Mar 25. PMID: 32229322; PMCID: PMC7102545. [DOI] [PMC free article] [PubMed] [Google Scholar]
- 7.Vaishya R, Javaid M, Khan IH, Haleem A. Artificial Intelligence (AI) applications for COVID-19 pandemic. Diabetes Metab Syndr. 2020. Jul-Aug;14(4):337-339. doi: 10.1016/j.dsx.2020.04.012. Epub 2020 Apr 14. PMID: 32305024; PMCID: PMC7195043. [DOI] [PMC free article] [PubMed] [Google Scholar]
- 8.Chen J, See KC. Artificial Intelligence for COVID-19: Rapid Review. J Med Internet Res. 2020. Oct 27;22(10):e21476. doi: 10.2196/21476. PMID: 32946413; PMCID: PMC7595751. [DOI] [PMC free article] [PubMed] [Google Scholar]
- 9.Khan M, Mehran MT, Haq ZU, Ullah Z, Naqvi SR, Ihsan M, Abbass H. Applications of artificial intelligence in COVID-19 pandemic: A comprehensive review. Expert Syst Appl. 2021. Dec 15;185:115695. doi: 10.1016/j.eswa.2021.115695. Epub 2021 Aug 4. PMID: 34400854; PMCID: PMC8359727. [DOI] [PMC free article] [PubMed] [Google Scholar]
- 10.Yang R, Li X, Liu H, Zhen Y, Zhang X, Xiong Q, Luo Y, Gao C, Zeng W. Chest CT Severity Score: An Imaging Tool for Assessing Severe COVID-19. Radiol Cardiothorac Imaging. 2020. Mar 30;2(2):e200047. doi: 10.1148/ryct.2020200047. PMID: 33778560; PMCID: PMC7233443. [DOI] [PMC free article] [PubMed] [Google Scholar]
- 11.Pan F, Ye T, Sun P, Gui S, Liang B, Li L, Zheng D, Wang J, Hesketh RL, Yang L, Zheng C. Time Course of Lung Changes at Chest CT during Recovery from Coronavirus Disease 2019 (COVID-19). Radiology. 2020. Jun;295(3):715-721. doi: 10.1148/radiol.2020200370. Epub 2020 Feb 13. PMID: 32053470; PMCID: PMC7233367. [DOI] [PMC free article] [PubMed] [Google Scholar]
- 12.Ronneberger O, Fischer P, Brox T, editors. U-net: Convolutional networks for biomedical image segmentation. Medical Image Computing and Computer-Assisted Intervention–MICCAI 2015: 18th International Conference, Munich, Germany, October 5-9, 2015, Proceedings, Part III 18; 2015: Springer. https://link.springer.com/book/10.1007/978-3-319-24574-4 [Google Scholar]
- 13.Zhou X, Takayama R, Wang S, Hara T, Fujita H. Deep learning of the sectional appearances of 3D CT images for anatomical structure segmentation based on an FCN voting method. Med Phys. 2017. Oct;44(10):5221-5233. doi: 10.1002/mp.12480. Epub 2017 Aug 31. PMID: 28730602. [DOI] [PubMed] [Google Scholar]
- 14.Isensee F, Petersen J, Klein A, Zimmerer D, Jaeger PF, Kohl S. Nnu-net: Self-adapting framework for u-net-based medical image segmentation. arXiv preprint arXiv:180910486. 2018. 10.48550/arXiv.1809.10486 [DOI] [Google Scholar]
- 15.Hofmanninger J, Prayer F, Pan J, Röhrich S, Prosch H, Langs G. Automatic lung segmentation in routine imaging is primarily a data diversity problem, not a methodology problem. Eur Radiol Exp. 2020. Aug 20;4(1):50. doi: 10.1186/s41747-020-00173-2. PMID: 32814998; PMCID: PMC7438418. [DOI] [PMC free article] [PubMed] [Google Scholar]
- 16.Naudé W. Artificial intelligence vs COVID-19: limitations, constraints and pitfalls. AI Soc. 2020;35(3):761-765. doi: 10.1007/s00146-020-00978-0. Epub 2020 Apr 28. PMID: 32346223; PMCID: PMC7186767. [DOI] [PMC free article] [PubMed] [Google Scholar]
- 17.Hope MD, Raptis CA, Shah A, Hammer MM, Henry TS; six signatories. A role for CT in COVID-19? What data really tell us so far. Lancet. 2020. Apr 11;395(10231):1189-1190. doi: 10.1016/S0140-6736(20)30728-5. Epub 2020 Mar 27. PMID: 32224299; PMCID: PMC7195087. [DOI] [PMC free article] [PubMed] [Google Scholar]
- 18.Ai T, Yang Z, Hou H, Zhan C, Chen C, Lv W, Tao Q, Sun Z, Xia L. Correlation of Chest CT and RT-PCR Testing for Coronavirus Disease 2019 (COVID-19) in China: A Report of 1014 Cases. Radiology. 2020. Aug;296(2):E32-E40. doi: 10.1148/radiol.2020200642. Epub 2020 Feb 26. PMID: 32101510; PMCID: PMC7233399. [DOI] [PMC free article] [PubMed] [Google Scholar]
- 19.Zhou C, Chan HP, Chughtai A, Patel S, Kuriakose J, Hadjiiski LM, Wei J, Kazerooni EA. Variabilities in Reference Standard by Radiologists and Performance Assessment in Detection of Pulmonary Embolism in CT Pulmonary Angiography. J Digit Imaging. 2019. Dec;32(6):1089-1096. doi: 10.1007/s10278-019-00228-w. PMID: 31073815; PMCID: PMC6841909. [DOI] [PMC free article] [PubMed] [Google Scholar]
- 20.Richardson S, Hirsch JS, Narasimhan M, Crawford JM, McGinn T, Davidson KW; the Northwell COVID-19 Research Consortium; Barnaby DP, Becker LB, Chelico JD, Cohen SL, Cookingham J, Coppa K, Diefenbach MA, Dominello AJ, Duer-Hefele J, Falzon L, Gitlin J, Hajizadeh N, Harvin TG, Hirschwerk DA, Kim EJ, Kozel ZM, Marrast LM, Mogavero JN, Osorio GA, Qiu M, Zanos TP. Presenting Characteristics, Comorbidities, and Outcomes Among 5700 Patients Hospitalized With COVID-19 in the New York City Area. JAMA. 2020. May 26;323(20):2052-2059. doi: 10.1001/jama.2020.6775. Erratum in: JAMA. 2020. May 26;323(20): 2098. PMID: 32320003; PMCID: PMC7177629. [DOI] [PMC free article] [PubMed] [Google Scholar]
- 21.Salman FM, Abu-Naser SS, Alajrami E, Abu-Nasser BS, Alashqar BA. Covid-19 detection using artificial intelligence. International Journal of Academic Engineering Research (IJAER). ISSN: 2643-9085. Vol. 4, Issue 3, March –. 2020, Pages: 18-252020. [Google Scholar]
- 22.Kim CK, Choi JW, Jiao Z, Wang D, Wu J, Yi TY, Halsey KC, Eweje F, Tran TML, Liu C, Wang R, Sollee J, Hsieh C, Chang K, Yang FX, Singh R, Ou JL, Huang RY, Feng C, Feldman MD, Liu T, Gong JS, Lu S, Eickhoff C, Feng X, Kamel I, Sebro R, Atalay MK, Healey T, Fan Y, Liao WH, Wang J, Bai HX. An automated COVID-19 triage pipeline using artificial intelligence based on chest radiographs and clinical data. NPJ Digit Med. 2022. Jan 14;5(1):5. doi: 10.1038/s41746-021-00546-w. PMID: 35031687; PMCID: PMC8760275. [DOI] [PMC free article] [PubMed] [Google Scholar]
- 23.Soda P, D'Amico NC, Tessadori J, Valbusa G, Guarrasi V, Bortolotto C, Akbar MU, Sicilia R, Cordelli E, Fazzini D, Cellina M, Oliva G, Callea G, Panella S, Cariati M, Cozzi D, Miele V, Stellato E, Carrafiello G, Castorani G, Simeone A, Preda L, Iannello G, Del Bue A, Tedoldi F, Alí M, Sona D, Papa S. AIforCOVID: Predicting the clinical outcomes in patients with COVID-19 applying AI to chest-X-rays. An Italian multicentre study. Med Image Anal. 2021. Dec;74:102216. doi: 10.1016/j.media.2021.102216. Epub 2021 Aug 28. PMID: 34492574; PMCID: PMC8401374. [DOI] [PMC free article] [PubMed] [Google Scholar]
- 24.Li Y, Shang K, Bian W, He L, Fan Y, Ren T, Zhang J. Prediction of disease progression in patients with COVID-19 by artificial intelligence assisted lesion quantification. Sci Rep. 2020. Dec 16;10(1):22083. doi: 10.1038/s41598-020-79097-1. PMID: 33328512; PMCID: PMC7745019. [DOI] [PMC free article] [PubMed] [Google Scholar]
- 25.Li K, Wu J, Wu F, Guo D, Chen L, Fang Z, Li C. The Clinical and Chest CT Features Associated With Severe and Critical COVID-19 Pneumonia. Invest Radiol. 2020. Jun;55(6):327-331. doi: 10.1097/RLI.0000000000000672. PMID: 32118615; PMCID: PMC7147273. [DOI] [PMC free article] [PubMed] [Google Scholar]
- 26.Lyu P, Liu X, Zhang R, Shi L, Gao J. The Performance of Chest CT in Evaluating the Clinical Severity of COVID-19 Pneumonia: Identifying Critical Cases Based on CT Characteristics. Invest Radiol. 2020. Jul;55(7):412-421. doi: 10.1097 /RLI.0000000000000689. PMID: 32304402; PMCID: PMC7173027. [DOI] [PMC free article] [PubMed] [Google Scholar]
- 27.Barton LM, Duval EJ, Stroberg E, Ghosh S, Mukhopadhyay S. COVID-19 Autopsies, Oklahoma, USA. Am J Clin Pathol. 2020. May 5;153(6):725-733. doi: 10.1093/ajcp/aqaa062. Erratum in: Am J Clin Pathol. 2020. May 5;153(6): 852. PMID: 32275742; PMCID: PMC7184436. [DOI] [PMC free article] [PubMed] [Google Scholar]
- 28.Koo HJ, Choi SH, Sung H, Choe J, Do KH. RadioGraphics Update: Radiographic and CT Features of Viral Pneumonia. Radiographics. 2020. Jul-Aug;40(4):E8-E15. doi: 10.1148/rg.20202000 97. Epub 2020 Jun 5. PMID: 32501740; PMCID: PMC7336757. [DOI] [PMC free article] [PubMed] [Google Scholar]
- 29.Ooi GC, Khong PL, Müller NL, Yiu WC, Zhou LJ, Ho JC, Lam B, Nicolaou S, Tsang KW. Severe acute respiratory syndrome: temporal lung changes at thin-section CT in 30 patients. Radiology. 2004. Mar;230(3):836-44. doi: 10.1148/radiol.230303 0853. PMID: 14990845. [DOI] [PubMed] [Google Scholar]
- 30.Ren HW, Wu Y, Dong JH, An WM, Yan T, Liu Y, Liu CC. Analysis of clinical features and imaging signs of COVID-19 with the assistance of artificial intelligence. Eur Rev Med Pharmacol Sci. 2020. Aug;24(15):8210-8218. doi: 10.26355/eurrev_20 2008_22510. PMID: 32767351. [DOI] [PubMed] [Google Scholar]
- 31.Meiler S, Schaible J, Poschenrieder F, Scharf G, Zeman F, Rennert J, Pregler B, Kleine H, Stroszczynski C, Zorger N, Hamer OW. Can CT performed in the early disease phase predict outcome of patients with COVID 19 pneumonia? Analysis of a cohort of 64 patients from Germany. Eur J Radiol. 2020. Oct;131:109256. doi: 10.1016/j.ejrad.2020.109256. Epub 2020 Aug 28. PMID: 32919265; PMCID: PMC7452844. [DOI] [PMC free article] [PubMed] [Google Scholar]
- 32.Honarmand A, Sheybani F, Aflatoonian E, Saberinia A. COVID-19 patients at referral to hospital during the first peak of disease: Common clinical findings including myalgia and fatigue. Eur J Transl Myol. 2022. Aug 12;32(3). doi: 10.4081/ejtm.2022.10731. PMID: 36036352. [DOI] [PMC free article] [PubMed] [Google Scholar]