

Abstract
Background and Aims
Studying trait variability and restricted gene flow between populations of species can reveal species dynamics. Peripheral populations commonly exhibit lower genetic diversity and trait variability due to isolation and ecological marginality, unlike central populations experiencing gene flow and optimal conditions. This study focused on Carex curvula, the dominant species in alpine acidic meadows of European mountain regions. The species is sparser in dry areas such as the Pyrenees and Balkans, compared to the Central–Eastern Alps and Carpathians. We hypothesized that distinct population groups could be identified based on their mean functional trait values and their correlation with the environment; we predicted that ecologically marginal populations would have stronger trait correlations, lower within-population trait variability (intraspecific trait variability, ITV) and lower genetic diversity than populations of optimal habitats.
Methods
Sampling was conducted in 34 populations that spanned the entire distribution range of C. curvula. We used hierarchical clustering to identify emergent functional groups of populations, defined by combinations of multiple traits associated with nutrient economy and drought tolerance (e.g. specific leaf area, anatomy). We contrasted the geographical distribution of these groups in relation to environment and genetic structure. We compared pairwise trait relationships, within-population trait variation (ITV) and neutral genetic diversity between groups.
Key Results
Our study identified emergent functional groups of populations. Those in the southernmost ranges, specifically the Pyrenees and Balkan region, showed drought-tolerant trait syndromes and correlated with indicators of limited water availability. While we noted a decline in population genetic diversity, we did not observe any significant changes in ITV in ecologically marginal (peripheral) populations.
Conclusions
Our research exemplifies the relationship between ecological marginality and geographical peripherality, which in this case study is linked to genetic depauperation but not to reduced ITV. Understanding these relationships is crucial for understanding the biogeographical factors shaping trait variation.
Keywords: Alpine plants, cluster regression, ecological marginality, European mountains, functional biogeography, intraspecific trait variability, neutral genetic diversity
INTRODUCTION
There is growing evidence that intraspecific trait variability (ITV), i.e. the variation of traits among individuals of the same species, plays a key role in determining individual and population performance, community structure and assembly (Westerband et al., 2021). The distribution of trait values in a species’ range is determined largely by environmental gradients, as changes in climate and local habitat factors mostly shape ITV (Albert et al., 2010). Research into spatial trait variability is an essential approach that can elucidate the association between plant species and their environment. This is due to the fact that plant functional traits, which encompass morphological, physiological and demographic features, play a crucial role in shaping plant fitness (e.g. Laforest-Lapointe et al., 2014; Nolting et al., 2021). However, further advancements in our understanding of how functional characteristics vary across a species’ geographical distribution are currently hampered by a lack of data on intraspecific trait values (Moran et al., 2016).
Trait variability in plants arises from phenotypic plasticity and genetic variation (Grassein et al., 2010), and research on species distributions at large scales has included exploration into the link between traits and environment (Das et al., 2021; Laughlin et al., 2021), as well as the genetic basis of phenotypic trait variation (Durufle et al., 2019; Garzón et al., 2019). The central–marginal hypothesis, a widely recognized concept in biogeography, proposes that peripheral populations located at the edge of a species’ range exhibit lower performance and genetic variation compared to central populations (Pironon et al., 2017). However, studies suggest that ecologically marginal populations may extend beyond the periphery of a species’ range and exist across extensive spatial scales due to widespread ecologically marginal conditions in some regions (Kennedy et al., 2020). In an evolutionary context, it has been hypothesized that the genetic differentiation of intraspecific traits represents a source of species adaptation capacity to climate change (Torres-Ruiz et al., 2019). Studies have shown that ecologically marginal populations of species exhibiting marked functional differentiation may play an important role within the total ITV (Tonin et al., 2020). Therefore, integrating information on trait and genetic variability within the context of broad-scale species ranges, with an emphasis on ecologically marginal conditions, can enhance our understanding of the historical factors that contribute to the present distribution patterns of ITV.
The observed variation of traits results from trade-offs among functionally related plant traits (Diaz et al., 2016). Particular suites of traits may form syndromes that better reflect the coordinated evolution and function of plant characters as a response to selective pressures (Hayes et al., 2019). For example, plants in insular systems are characterized by lower dispersal abilities and clonality compared to those in non-insular environments (Ottaviani et al., 2020). Moreover, the intraspecific leaf economics spectrum (LES), which reflects a continuum of leaf trait syndromes going from short-lived leaves with fast metabolism to the reverse syndrome, has been associated with genetic differentiation in contrasted climates across the geographical distribution range of Arabidopsis thaliana (Sartori et al., 2019). A study on Helianthus anomalus suggested that hot dry environments can selectively favour the correlated evolution of traits, indicating resource-conservative strategies, as shown by genetic neutral markers (Brouillette et al., 2014). Estimates of ITV in association with neutral genetic variation could provide insights into gene flow, isolation by distance and species phylogeography (Gauzere et al., 2020; López et al., 2020). Intraspecific trait associations have been explored for some species across gradients and large geographical scales (e.g. Richardson et al., 2013; Turtureanu et al., 2020). However, more research is required to understand whether functional syndromes and population genetic structures, as indicated by neutral markers, show consistent spatial patterns, particularly in the context of ecologically central and marginal populations.
The notion of ITV encompasses both the examination of correlation strengths between traits and the analysis of trait variation within populations. First, it has been hypothesized that correlations (phenotypic integration) between traits reflecting key dimensions of plant ecological strategies (such as the LES) increase along gradients of environmental harshness to enhance fitness (Boucher et al., 2013). Second, the variation of certain traits within populations may also improve our understanding of how plants cope with stressful conditions (Kuppler et al., 2020). In Trifolium montanum, both local habitat heterogeneity and genetic diversity were associated with within-population ITV (Karbstein et al., 2020). Due to contrasting environmental regimes, alpine species exhibit large ITV, thus providing excellent opportunities to examine how ITV varies across environmental gradients (Albert et al., 2010).
The central–marginal model suggests that populations situated on range margins tend to be more isolated and exhibit lower intrapopulation genetic diversity (Brussard, 1984), with lower levels of phenotypic variation. Moreover, the reduced genetic diversity in such populations was shown to correlate with shifts in trait values, although in certain regions, the decreased neutral genetic diversity at range margins may not hinder shifts in functional trait variation along environmental gradients (Kennedy et al., 2020). Populations near the core of a species’ range are expected to show continuity, high individual density, and increased levels of genetic and phenotypic variation, in contrast to those located on the margins or peripheries. To the best of our knowledge, no studies have been conducted to understand the association between within-population ITV and genetic diversity across a species’ complete range, which includes ecologically marginal and peripheral environments. The study by Karbstein et al. (2020), for instance, focused on investigating the ecological marginal conditions within a comparatively small geographical zone. Integrating population-level measures of ITV and neutral genetic variation across the distribution area of a species could improve our understanding of how plants respond to environmental forcings in an evolutionary context.
In this study, we focused on the alpine sedge Carex curvula, which has been previously studied in relation to its post-glacial history and neutral genetic diversity (Pușcaș et al., 2008b). Building on this significant knowledge and existing theoretical framework, we sampled populations across the Pyrenees, Alps, Carpathians and Balkan Peninsula mountains. We assume that ecological marginality is prevalent in peripheral regions such as the southernmost mountain ranges, as evidenced for example by a long-standing observation of reduced abundance of C. curvula in the South-Western Alps (Choler and Michalet, 2002). These regions are influenced by a Mediterranean climate, and the communities dominated by C. curvula are scattered and characterized by drought-tolerant alpine species because of severe summer drought. By contrast, the Central and Eastern Alps or the Carpathian Mountains are characterized by expansive alpine meadow ecosystems dominated by much denser communities (Pușcaș and Choler, 2012). Our previous studies on the phylogeographical structure of C. curvula provided evidence of two main lineages: a Western European (Alps and Pyrenees) and an Eastern European (Carpathians and Balkan Peninsula mountains), indicating an ancient isolation (Pușcaș et al., 2008a). Long-distance dispersal and long-term persistence in isolated, island-like alpine habitats have been proposed to explain the impoverished genetic diversity in the Pyrenees and the Balkan Peninsula mountains, respectively (Pușcaș et al., 2008a). In our study, we hypothesized that populations in the southernmost regions, assumed to experience ecologically marginal conditions, would exhibit distinguishable trait values for drought tolerance. We hypothesized that these emergent functional groups of populations (Kleyer et al., 2012) would possess a distinct genetic signature. We also predicted that populations situated in ecologically marginal areas would exhibit stronger trait correlation (coordination) and lower levels of within-population ITV and genetic diversity. To test these hypotheses, we measured plant height and leaf traits related to nutrient economy [e.g. leaf carbon-to-nitrogen ratio, specific leaf area (SLA)] and to drought tolerance (e.g. histological traits) (Grigore and Toma, 2017). More specifically, we addressed the following questions: (1) Can emergent functional groups of populations be identified by utilizing mean functional trait values and their optimized association with the environment? (2) Do emergent functional groups coincide with a central–peripheral geographical distribution and display a specific genetic structure? (3) Do ecologically marginal populations exhibit greater trait coordination and lower ITV and genetic diversity within populations?
MATERIALS AND METHODS
Study species and sampling design
The present study focuses on the crooked sedge C. curvula, which dominates one of the most characteristic alpine meadows of the higher mountains in temperate Europe. These grasslands can be found in the Pyrenees, the Alps, the Carpathians and in some of the Balkan Peninsula mountain ranges, where they are a typical representative of late-successional alpine belt communities on acidic substrates (Choler and Michalet, 2002; Pușcaș et al., 2008a). Carex curvula is more frequent and abundant in the central parts of its distribution (the Carpathians, the eastern and central parts of the Alps) and occurs in more fragmented and sparsely vegetated situations in the peripheral southern areas under Mediterranean influence: the Pyrenees, the Balkan region and the South-Western Alps (Pușcaș et al., 2008a; Pușcaș and Choler, 2012). Carex curvula s.l. was divided by Gilomen (1938) into two infrataxa based on their edaphic preferences: C. curvula subsp. curvula (calcifuge and present throughout the species’ range), and C. curvula subsp. rosae (confined to the Alps and Pyrenees and favouring calcicole soils, according to Chater, 1980). This investigation exclusively examined C. curvula subsp. curvula.
Sampling covered the whole distribution of C. curvula (Fig. 1) using an 80 × 80-km grid (as per the European Terrestrial Reference System – ETRS 89) and was conducted within the framework of the ODYSSEE long-term monitoring initiative (http://odyssee.granturi.ubbcluj.ro/). In each grid cell where C. curvula occurs, we sampled at least one 100-m2 site in a meadow dominated by this species (cover >25 %; Fig. 1C). A total of 34 sites were sampled (Supplementary Data Table S1).
Fig. 1.
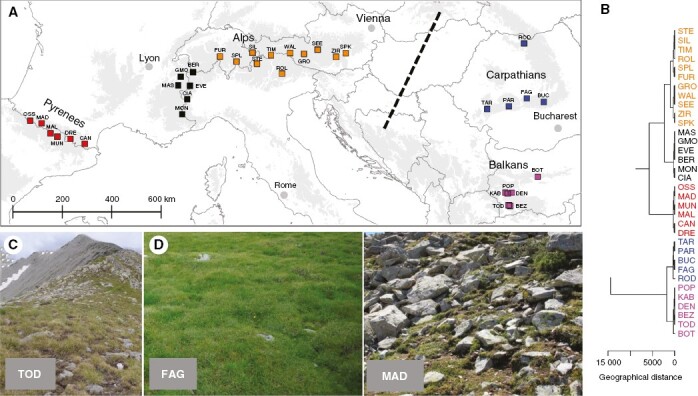
(A) Distribution of the sampling locations across the temperate European mountains. Symbols have been colour coded based on geographical region. The dashed line separates the two main genetic lineages (Western and Eastern clades) according to Pușcaș et al. (2008a). Population details can be found in Supplementary Data Table S1. (B) Hierarchical clustering of the sites based on geographical distances. (C) Sparse Carex curvula meadows in the Balkan region (Todorka, Bulgaria). (D) Two contrasting situations: a site with high cover of C. curvula (FAG – Făgăraș Mountains, Southern Carpathians, Romania) and a site with low vegetation cover (MAD – Pic de Madamète, Pyrenees, France).
Functional traits and environmental variables
Based on evidence showing that above-ground traits display a stronger and more consistent response to drought compared to root traits (Lozano et al., 2020), we have excluded the latter in this study. This decision was made in order to concentrate on critical above-ground traits that directly impact plant adaptation to drought conditions. Twenty shoots of C. curvula (Fig. 2A) were collected at random from each 100-m2 plot, storing the leaf material in wet tissues for no more than one day. (1) Vegetative height, i.e. the distance between the top of the photosynthetic tissue and the ground, was measured for all individuals in an upright position. (2) Leaf carbon and nitrogen content per unit of dry leaf mass (in mg g−1) were determined on dried leaf samples from five individuals in each population, ground with an oscillating ball mill before using the same elemental analyser that was used for soil (Flash EA1112, Thermo Fisher Scientific, USA). (3) SLA, the ratio of leaf area to leaf dry mass (cm2 g−1), was measured using leaves collected from ten individuals. The samples were dried in an oven at 60 °C for 48 h. (4) Leaf tensile strength (in N mm−1), also known as resistance to tearing, was measured on the same ten individuals using a portable lab-made tearing device (tensometer) on which the leaf samples were stretched by a handcrafted dynamometer until breaking. (5) To derive traits at the leaf anatomical level, the middle lamellae of the last fully mature leaves were collected from five individuals in each population and preserved in a mixture of formaldehyde:ethanol:acetic acid (final concentration 10 %:50 %:5 %). Leaf segments were dehydrated by immersion in baths of increasing concentrations of ethanol and butanol before embedding them in paraffin. We prepared cross-sections 15 µm in width and photographed them through an Olympus BX51 microscope equipped with a CoolSnap Pro-colour camera. Images were converted to black and white before estimating the total cross-sectional area and the area occupied by bulliform cells, which are found in monocotyledonous families such as Cyperaceae where they are involved in rolling and unrolling leaves under drought (Grigore and Toma, 2017) (Fig. 2B). The ‘bulliform cell ratio’ was calculated as the ratio of the area occupied by bulliform cells to the total leaf cross-sectional area. The trait ‘circularity’, which indicates how circular or elongated the leaf cross-section is, was calculated using the formula: which yields the circularity index (roundness) from within (0,1] where a value near zero indicates a high level of distortion while 1 corresponds to a perfect circle (Niinemets et al., 2004). In leaf blades, ‘roundness’ is a shape parameter that relates to the evaporative and heated areas of the leaf (Sosnovsky et al., 2021); it is therefore expected to increase under drought-stress conditions. Table 1 provides a summary of the traits used in this study. Images were processed using ‘raster’ (Hijmans et al., 2022) and ‘tiff’ (Urbanek and Johnson, 2013) R packages. The circularity index was calculated using the ‘stars’ (Pebesma et al., 2021b), ‘sf’ (Pebesma, 2018), ‘sp’ (Pebesma and Bivand, 2005) and ‘lwgeom’ (Pebesma et al., 2021a) R packages.
Fig. 2.
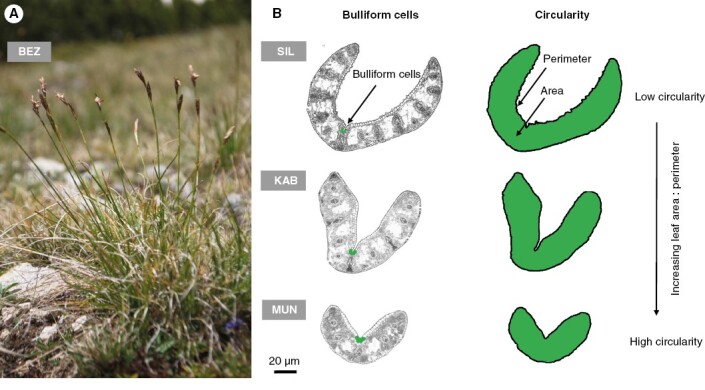
(A) Tussock of Carex curvula from the Balkan region (BEZ – Bezbog). (B) The two anatomical traits used in this study. Three examples are shown to illustrate both (1) the increasing proportion of bulliform cells forming the total leaf cross-sectional area and (2) the increasing circularity of the leaf cross-section. These examples represent samples from the Alps (SIL – Silvretta), Balkan Peninsula mountains (KAB – Kabul) and Pyrenees (MUN – Muntanyó). Population details can be found in Supplementary Data Table S1.
Table 1.
Overview, summary and variability of functional traits measured in this study.
| Trait | Description | Mean | Range | CV (%) |
|---|---|---|---|---|
| Height | Vegetative height (cm) | 10.00 | 3.90–17.15 | 33.97 |
| SLA | Specific leaf area (cm2 g−1) | 11.48 | 7.87–14.94 | 15.44 |
| Leaf strength | Leaf tensile strength (N mm−1) | 286.45 | 209.46–407.98 | 18.80 |
| LCC | Leaf carbon concentration relative to dry-mass (%) | 45.00 | 43.50–46.61 | 1.45 |
| C:N | C:N ratio | 22.10 | 15.38–29.24 | 15.04 |
| Bulliform cells | Ratio of bulliform cell area to leaf cross-sectional area (%) | 0.78 | 0.38–1.43 | 27.73 |
| Circularity | Circularity index, i.e. ratio of leaf cross-sectional area to the area of a circle with the same convex perimeter | 0.20 | 0.13–0.27 | 14.41 |
CV, coefficient of variability at the population level.
Several soil parameters were measured by collecting soil cores from five randomly chosen locations at each site, from the top 15 cm of the soil profile. This yielded composite soil samples which were sieved and air-dried before laboratory analyses. An elemental analyser (Flash EA1112, Thermo Fisher Scientific) was used to measure the total carbon and nitrogen content of ground material. Using a pH-meter (inoLab 7110, WTW, Germany), soil pH was determined in a 1:4 (w/w) mixture of soil and distilled water. Organic matter content was measured by loss on ignition analysis performed for 4 h at 550 °C. The soil thermal regime was monitored during the period 2014–2021 using miniaturized and standalone temperature data loggers (Hobo pendant UA, Onset Computer Corporation, Bourne, MA, USA) installed within the ODYSSEE field campaign. Loggers were buried at a depth of 5 cm to record near-surface ground temperatures every 2 h. Despite some incomplete time series owing to unexplained cessation of loggers or depletion of battery power, we were able to collect sufficient data to cover both winter and summer conditions for at least 1 year at each site. We used the number of days from January to March with average soil temperatures below −1 °C to characterize winter thermal conditions (freezing season length; FSL). A previous study (Choler, 2018) highlighted the relevance of this thermal indicator for characterizing alpine habitats. Soil summer thermal conditions were characterized by the mean soil temperature in July (°C; Soil.Temp.J).
The onset of snowmelt (Onset) was derived from MODIS (Moderate Resolution Imaging Spectroradiometer) Collection 6 remote sensing data with a resolution of 250 m (Myneni et al., 2002). The timing of the first day of snowmelt is critical for alpine species as it determines water availability, plant growth and productivity. The 8-d temporal resolution of the MODIS product allowed a fair estimate of Onset in snow-covered ecosystems (Choler, 2015). Collection 6 of the MOD09Q1 products was downloaded from the Land Processes Distributed Active Archive Center (https://e4ftl01.cr.usgs.gov/). We used the topographic position index (TPI) (De Reu et al., 2013) to describe the mesotopographical conditions, which play a crucial role in determining the hydrological processes that govern water balance in alpine habitats. TPI was derived from a 25-m-resolution Digital Elevation Model over Europe (EU-DEM, https://www.eea.europa.eu/data-and-maps/data/eu-dem) from the GMES RDA project with a focal window size of 3 × 3 pixels. A high/low TPI indicates a local topographic convexity/concavity (peak/valley) while a TPI near zero indicates a flat or near-continuous slope.
We used the Normalized Difference Vegetation Index (NDVI) as a remotely sensed proxy of plant cover (Fig. 1D). NDVI was estimated based on the high-resolution (10 m) images provided by the Sentinel-2 mission and processed through the MAJA algorithm (https://www.connectbycnes.fr/en/maja). The calculation was based on the NIR (band 8) and RED (band 4) reflectance. To mitigate the effect of cloud cover, which is very frequent in the alpine zone, we selected several clear images from the summer months (July–August) of the years 2015–2019 to calculate an averaged NDVI at a resolution of 3 × 3 pixels. NDVI heterogeneity was assessed through the standard deviation of NDVI over a 30 × 30-m area (NDVI.var).
Climate variables were estimated from gridded datasets of air temperature, moisture and solar irradiance, and from our own in situ records of soil temperature. The summer daily average temperature (TempAir.JJA; June–August; °C) and daily average minimum temperature during the growing season (from vegetation onset to end of July) were retrieved from WorldClim v1.4 (Hijmans et al., 2005) at a resolution of 30 arcsec (~ 1 km) for the period 1960–1990. Summer actual evapotranspiration (ET.JJA; June–August; mm) was obtained from Terraclimate at ~4-km spatial resolution for the period 1981–2010 (Abatzoglou et al., 2018). Potential evapotranspiration (PET.J; mm) was obtained from the E-OBS dataset at a resolution of 0.1° (monthly sum for July; 1980–2017; Haylock et al., 2008). The incoming shortwave radiation (Rad.J; J m–2) was obtained from the HelioClim-1 database at a resolution of ~20 km (monthly sum for July; 1985–2005; Lefevre et al., 2007). Although these gridded climate products have different spatial and temporal resolutions, they provide daily coverage of the entire study area and provide useful information about regional-scale climate variability. The habitat and climate variables used in this study are summarized in Supplementary Data Table S2 and Fig. S1.
Neutral genetic variation
To assess neutral genetic variation, we used simple sequence repeat (SSR) fingerprinting. We randomly chose 15 individuals in each population and sampled healthy, green leaves and stored them in tubes with silica gel until DNA extraction. Genomic DNA was extracted using a NucleoSpin® 96 Plant II (Macherey-Nagel, Germany) according to the manufacturer’s protocol. The DNA quality was estimated on a 1 % agarose gel stained with ethidium bromide, and the concentration was quantified using a NanoDrop 2000 spectrophotometer (Thermo Fisher Scientific). We amplified 13 microsatellite loci specifically designed for C. curvula (Șuteu et al., 2023). The 4× diluted genomic DNA was subjected to PCR amplification in a 10-μL volume containing 1× KAPA Taq Buffer A, 0.25 mm of each dNTP, 0.2 μm of each primer, 0.1 mg mL–1 BSA, and 0.4 U of KAPA Taq DNA Polymerase (Kapa Biosystems, USA). The following PCR programme was used: 94 °C for 3 min, 94 °C for 1 min, primer-specific annealing temperature for 1 min, 72 °C for 2 min, 45× steps –2–4, and final elongation at 72 °C for 7 min. The PCR products were purified on a mix of Sephadex–Sephacryl (1:1) (GE Healthcare Bio-Sciences AB) and then 10× diluted. Then, 1.5 µL from this dilution was added to a 10-µL mix (10:0.1) of HiDi formamide and GeneScan™ 500 ROX™ Size Standard (Applied Biosystems, Thermo Fisher Scientific), and then subjected to capillary electrophoresis on an ABI PRISM 3130 Genetic Analyzer (Applied Biosystems, Thermo Fisher Scientific) using a 36-cm capillary and POP-7™ polymer. GeneMapper v.4.0 software (Applied Biosystems, Thermo Fisher Scientific) was used for allele scoring. Data reliability was tested by comparing duplicates (ratio of replicates to samples was 1:10). The analysis of the 13 microsatellite polymorphic loci detected 284 alleles in 510 individuals and the number of alleles per sample and per locus ranged between one and six.
Emergent functional groups of populations
We performed trait-based hierarchical clustering to identify functional groups of populations, i.e. groups of populations that show similar suites of trait values. We followed the procedure of Kleyer et al. (2012) to cluster all trait combinations and to select a composite of several statistically stable, informative traits that exhibit a strong response to the environment. Ward’s hierarchical clustering was repeated for all combinations of traits (i.e. combinations of one to six traits). We calculated the cophenetic correlation to quantify how the clustering results correspond to the original pairwise distance matrix.
In a second step, we modelled the responses of emergent groups to the environmental variables by cutting each tree into three emergent groups of sufficient robustness to examine the response to the environment. For each group and environmental factor, univariate generalized linear models were fitted to determine the shape of the relationship (linear or hump-shaped) and its significance. We kept all significant univariate models and calculated R2 for each. Each cluster was rated for its overall responsiveness to the environment, expressed as the average goodness of fit (R2) of the significant models for all three groups of a certain trait combination. As clustering selection does not necessarily lead to a single best solution (Kleyer et al., 2012), a subset of the more suitable clusterings was chosen based on the following criteria: (1) the clustering should be based on at least three traits to capture the different dimensions of trait variation, (2) the clustering exhibits a cophenetic correlation coefficient >0.6 and (3) the mean R2 across groups was >0.2. Since we intended to focus on a single clustering that maximizes the number of traits, i.e. that combines traits characterizing both plant stature and foliage properties including leaf anatomical traits – the most innovative facet of this work – we sorted the table in descending order based on the response to environment (R2) and chose the first clustering comprising anatomical traits, height, as well as a morphological and a chemical trait. To evaluate the goodness of fit of each model, we used the Hosmer–Lemeshow test (Hosmer et al., 1997), as implemented in the pROC package (Robin et al., 2021). A P-value <0.05 suggests a lack of fit.
Spatial distribution of functional groups and genetic variation
We employed a hierarchical cluster analysis on geographical locations, population-mean trait values and genetic (microsatellite) data at the population level. This analysis was based on the Euclidean distance and was carried out with Ward’s linkage algorithm using the ‘stats’ R package (R Core Team and contributors worldwide, 2022). We evaluated the spatial distribution of the functional groups within the clustering trees by examining the placement of mountain ranges labelled with different colours and used tanglegrams to summarize the topological similarities among the trees. In addition, we calculated the cophenetic correlation between distance matrices pertaining to functional, genetic, geographical, climate and habitat dendrograms. Both the tanglegrams and the cophenetic correlations were produced with the ‘dendextend’ R package (Galili, 2015).
ITV and genetic diversity in relation to ecological marginality
To assess the strength of trait coordination among populations, we fitted pairwise trait relationships (standardized major axes; SMAs) for both the pre-defined functional groups of populations and the full dataset. To evaluate within-population ITV, we first calculated the coefficient of variation (CV) for each trait using the values measured for individuals in the same population. Then, we assessed population-wise ITV as the mean of CV from all traits (Karbstein et al., 2020). Finally, we compared the distribution of ITV of individual traits and population-wise ITV across the emergent functional groups.
Within-population genetic diversity was assessed using Nei’s genetic diversity index (Nei, 1987). We examined the distribution of Nei’s index among the emergent functional groups and constructed the phylogenetic tree with Ward’s hierarchical clustering based on the genetic distances between populations using the ‘adegenet’ R package (Jombart, 2008).
All statistical analyses for this study were performed using R.
RESULTS
Emergent functional groups of populations
Nineteen clusters of trait values met our criteria of high cophenetic correlation and strong response to the environment. The chosen clusters comprised both anatomical traits, height, SLA, leaf strength and C:N (Table 2). The relative positioning of chosen clustering is shown in Supplementary Data Fig. S2. Other combinations did not show distinct patterns. In addition, we identified the clusters showing the highest response of groups to the environment (Table S3; Fig. S3).
Table 2.
Subset of clusterings used to select the trait combination discussed in this study (in bold type). These were filtered from a full list of all possible trait combinations to comprise: at least three functional traits, cophenetic correlation coefficient >0.6, and average group R2 > 0.2. A combination involving all trait types (size, structural, chemical, anatomical) was assumed to be the most informative. Abbreviations of traits as in Table 1.
| No. of traits | Involved traits | Cophenetic correlation | No. of stable clusters | Average R2 |
|---|---|---|---|---|
| 4 | SLA, Height, Leaf strength, Circularity | 0.76 | 2 | 0.34 |
| 3 | SLA, Height, Circularity | 0.76 | 4 | 0.34 |
| 6 | C:N, LCC, SLA, Height, Leaf strength, Bulliform cells | 0.61 | 2 | 0.33 |
| 5 | LCC, SLA, Height, Leaf strength, Circularity | 0.65 | 2 | 0.32 |
| 3 | C:N, SLA, Leaf strength | 0.69 | 2 | 0.30 |
| 3 | SLA, Leaf strength, Circularity | 0.61 | 4 | 0.30 |
| 5 | C:N, SLA, Leaf strength, Bulliform cells, Circularity | 0.61 | 2 | 0.29 |
| 4 | C:N, SLA, Height, Leaf strength | 0.66 | 2 | 0.28 |
| 6 | C:N, SLA, Height, Leaf strength, Bulliform cells, Circularity | 0.63 | 2 | 0.27 |
| 3 | LCC, SLA, Circularity | 0.63 | 2 | 0.25 |
| 3 | SLA, Height, Leaf strength | 0.61 | 2 | 0.25 |
| 5 | C:N, SLA, Height, Leaf strength, Bulliform cells | 0.64 | 2 | 0.24 |
| 5 | C:N, SLA, Height, Leaf strength, Circularity | 0.7 | 2 | 0.24 |
| 4 | SLA, Height, Bulliform cells, Circularity | 0.69 | 3 | 0.24 |
| 3 | C:N, LCC, Leaf strength | 0.67 | 2 | 0.24 |
| 5 | C:N, LCC, SLA, Height, Leaf strength | 0.66 | 2 | 0.23 |
| 4 | C:N, Height, Leaf strength, Circularity | 0.67 | 2 | 0.22 |
| 4 | C:N, SLA, Leaf strength, Circularity | 0.63 | 2 | 0.21 |
| 4 | C:N, Leaf strength, Bulliform cells, Circularity | 0.62 | 2 | 0.20 |
The trait values of F3 were the most divergent among the functional groups: statistically significant lower height (6.3 ± 2.1 cm) compared to F1 (12.7 ± 2.1 cm; Tukey’s, P < 0.001), lower SLA (9.1 ± 1.3 cm g–1) compared to F1 (12.3 ± 1.4 cm2 g−1; Tukey’s, P < 0.001) and F2 (11.8 ± 1.0 cm; Tukey’s, P < 0.001), higher leaf strength (351 ± 47 N mm−1) compared to F1 (266 ± 35 N mm−1; Tukey’s, P < 0.001) and F2 (275 ± 52 N mm−1; Tukey’s, P < 0.01), higher C:N (26 ± 2.6) compared to F1 (22 ± 2.6; Tukey’s, P = 0.022) and F2 (19 ± 2.3; Tukey’s, P < 0.001), higher bulliform cell proportion (0.87 ± 0.28 %) compared to F1 (0.64 ± 0.14 %; Tukey’s, P < 0.019), and slightly elevated circularity indices (0.22 ± 0.03) compared to F1 (0.20 ± 0.03; Tukey’s, P = 0.16) and F2 (0.19 ± 0.02; Tukey’s, P = 0.12).
The response of functional groups to environmental variables is summarized in Table 3 (see also Supplementary Data Fig. S2). F3 was associated with higher summer soil temperatures (TempSoil.J) and summer evapotranspiration (ET.JJA), F2 was linked to lower minimum air temperatures during the growing season (TempAirMin.GS), while F1 was associated with a decrease in potential evapotranspiration (PET.J) (Table 3). Overall, the emergent functional groups of populations responded more to regional variables than to local factors. This was also observed in the clustering based on the combination of traits with the highest response to the environment which even showed no response at all to local factors (Table S3.). The populations from the Pyrenees (F3 group) were highly associated with TempSoil.J and ET.JJA (Table S3).
Table 3.
Environmental response of the functional groups (F1–F3) that emerged from the clustering of selected trait combinations. The coefficient of determination (R2) is provided only for the significant univariate models along with the direction of either linear (+,−) or hump-shaped relationships (∩). Abbreviations of environmental variables as in Supplementary Data Table S2. Non-significant relationships are denoted by n.s. For the following models, the Hosmer–Lemeshow goodness-of-fit test (HL; d.f. = 9) suggested a lack of fit: F1–Soil.OM (HL: 21.53; P = 0.01), F1–ET.JJA (HL: 17.33, P = 0.04).
| F1 | F2 | F3 | |
|---|---|---|---|
| Habitat variables | |||
| FSL | n.s. | n.s. | n.s. |
| Onset | n.s. | n.s. | n.s. |
| Soil.pH | n.s. | n.s. | n.s. |
| Soil.OM | 0.17 (+) | n.s. | n.s. |
| Soil.CN | 0.31 (+) | n.s. | n.s. |
| TPI | n.s. | n.s. | n.s. |
| NDVI | 0.24 (+) | 0.14 (−) | n.s. |
| NDVI.var | n.s. | n.s. | n.s. |
| Climate variables | |||
| TempSoil.J | 0.25 (-) | n.s. | 0.55 (+) |
| TempAir.JJA | n.s. | 0.15 (−) | 0.18 (+) |
| Rad.J | 0.26 (−) | n.s. | n.s. |
| TempAirMin.GS | n.s. | 0.40 (−) | 0.18 (+) |
| ET.JJA | 0.33 (∩) | n.s. | 0.48 (+) |
| PET.J | 0.40 (-) | 0.17 (+) | n.s. |
Spatial distribution of functional groups and genetic variation
The dendrogram based on geographical distances revealed clusters that closely match the main mountain ranges, i.e. the Pyrenees, Alps, Carpathians and Balkan Peninsula. The Alps were divided into two distinct groups, with the South-Western Alps being separated from the remaining areas of the range (Fig. 1A, B).
The trait structure also displayed a well-defined spatial pattern (Fig. 3A). The three emerging functional groups (F1–F3, Fig. 3A) exhibited a clear geographical structure. While F1 comprised only populations from the Alps and Carpathians, and a few from the South-Western Alps, F2 comprised all the Balkan Peninsula populations and the remaining populations from the South-Western Alps. The most distinguishable group was F3, which included all Pyrenean populations.
Fig. 3.

(A) Hierarchical clustering of the sites based on the selected combination of traits, namely height, SLA, leaf strength, C:N, bulliform cells and circularity. Three functional groups (F1–F3) were derived from the dendrogram to identify the main trait syndromes. Colour codes as in Fig. 1. (B) Distribution of population means for different traits according to the three functional groups obtained from the hierarchical clustering. Different letters indicate significant differences between populations (post hoc Tukey’s test; P < 0.05). Abbreviations of traits as in Table 1.
The genetic structure displayed a marked west–east gradient (Supplementary Data Fig. S4) with populations from the Balkan Peninsula and Carpathians grouped together, while the Pyrenean populations had a clearly distinct genetic signature within the cluster including the populations from the South-Western and Central Alps, indicating a notable contrast between the Pyrenees and Balkan Peninsula in terms of genetic structure.
The tanglegram showed a strong correspondence between the functional and genetic structure for the Pyrenean populations (Supplementary Data Fig. S4). Overall, the functional structure had the highest values of cophenetic correlation with the genetic structure and climate (Supplementary Data Fig. S5).
ITV and genetic diversity in relation to ecological marginality
The results of pairwise SMAs between traits within the functional groups F1 and F2 + F3 provided little evidence for higher coordination in marginal populations. Only three out of 15 trait pairs showed significant SMAs for F2 + F3 but not for F1 (Fig. 4): height–C:N (slope: −0.60, P = 0.040), SLA–leaf strength (slope: −0.02, P = 0.018) and leaf strength–proportion of bulliform cells (slope: −310.00, P = 0.045).
Fig. 4.
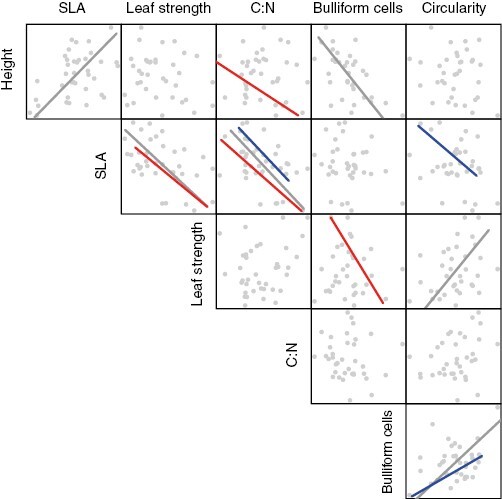
Coordination among traits assessed by bivariate relationships using standardized major axis (SMA) regressions. Coloured lines indicate significant linear relationships for populations in functional group F1 (blue) or F2 + F3 (red). Grey lines indicate significant relationships for the full dataset. Abbreviations of traits as in Table 1.
In terms of ITV in marginal populations, the only notable difference observed between the groups was in the CV of height. The mean CVs of height in F3 (1.19 ± 0.59) and F2 (0.87 ± 0.23) were higher compared to that of F1 (0.57 ± 0.11), as indicated by Tukey’s P < 0.001 and P = 0.045, respectively. None of the traits showed any significant within-population CV for F3 and F2, nor were there any population-wise ITV differences (Fig. 5A).
Fig. 5.

(A) Distribution of the within-population coefficient of variation (CV) of traits according to the three functional groups obtained from the hierarchical clustering. Abbreviations of traits as in Table 1. (B) Distribution of within-population Nei’s genetic diversity index across the three functional groups. The same letters indicate non-significant differences among groups (post hoc Tukey’s test; P < 0.05).
Population genetic diversity was strikingly depauperate in the Pyrenean populations, i.e. F3 (Nei’s genetic diversity index = 0.028 ± 0.024) compared to F1 (0.081 ± 0.011; Tukey’s, P < 0.001) and F2 (0.073 ± 0.011; Tukey’s, P < 0.001). However, there were no significant differences in ITV for this functional group of populations, as shown in Fig. 5B.
DISCUSSION
Our study provided a unique evaluation of the ITV of a keystone species, performed comprehensively across its entire continental-scale distribution range, and in a well-defined phylogeographical context. First, our research revealed the emergence of unique functional groups of populations characterized by multiple trait values. Notably, the proportion of bulliform cells, a syndrome of leaf traits, exhibited an increase in marginal populations of the Balkan Peninsula and Pyrenees. These findings brought novel insights into the significance of underrepresented anatomical traits on a large biogeographical scale (Bachle and Nippert, 2021). Second, the outcomes of our study revealed the presence of a marked geographical signature expressed in the variation of trait values in C. curvula. Our study is thoroughly documented from a phylogeographical perspective as it revealed a robust geographical pattern in the genetic structure of populations that corresponded to the trait structure. Third, we provided evidence that neither coordination between traits nor within-population ITV is higher in marginal conditions. Lower within-population ITV did not correspond to genetically depauperate populations.
Ecological marginality-associated trait syndromes coincide with geographical periphery and genetic depletion
We identified several factors indicative of ecologically marginal situations, such as higher summer soil temperatures, dry climate and reduced vegetation cover measured by the NDVI. Our results suggested a consistency between local- and regional-scale factors as indicators of ecological marginality at biogeographical scales. The severe summer drought, especially in the Pyrenees (Ninot et al., 2017), cascades into a less dense vegetation cover of communities dominated by C. curvula. Our results on ITV agreed with previous studies on C. curvula in the South-Western Alps showing that optimal conditions are infrequent in the southernmost regions where this taxon mostly occupies ecologically marginal habitats (Choler and Michalet, 2002). The optimal conditions for C. curvula are found in cold and humid mountain climates, e.g. in the Central and Eastern Alps or in the Carpathians, where it forms extensive swards (Pușcaș and Choler, 2012). In warmer climates, competition for light with taller low-alpine species such as Carex sempervirens is a limiting factor (Guisan et al., 1998).
In our study, we detected two distinct trait syndromes among the populations analysed. The populations in the Pyrenees region, compared to those in the Balkan region and South-Western Alps, exhibited a more pronounced conservative syndrome associated with marginal environmental conditions. Our approach distinguished these two trait syndromes based on multiple trait values, including histological traits that are usually overlooked in such studies (Westerband et al., 2021). Although there are previous investigations focusing on bulliform cells in C. curvula (Codignola et al., 1987), none has explored this trait across large spatial scales. Second, the increased leaf circularity in the Pyrenees, but not in the Balkan Peninsula, may be considered a drought adaptation specific for this range. The closely related taxon C. curvula subsp. rosae, which occupies calcareous outcrops in the South-Western Alps and Pyrenees, but not in the Balkans, is characterized by similar rounded transverse leaf-sections (Gilomen, 1938; Choler et al., 2004). Further studies should examine whether this trait similarity results from convergent evolution or phylogenetic conservatism. Thus, our results clearly indicate the relevance of measuring intraspecific anatomical traits to decipher alpine species’ functional strategies (e.g. García-Cervigón et al., 2021). Complementary developments in measuring less-reported anatomical traits at an intraspecific level are also promising to yield additional insights into the response of species to a different future climate. The current climatic trends call into question whether marginal populations of C. curvula will be able to cope with more frequent and more intense summer heatwaves in European mountains. Other traits, such as lower height, lower SLA, and higher leaf strength (particularly in the Pyrenean populations) are related to high investment in structural tissues, which allow plants to maintain leaf turgor under drought, as shown at the intraspecific level in alpine species for SLA (Scheepens et al., 2010), or in other species for leaf strength (Kazakou et al., 2019) and plant height (Tardella et al., 2017).
The clustering of C. curvula populations based on the combination of five functional traits observed in our study concurs with previous research that identified geographically recognizable patterns of trait variation, such as in North American trees (Rueda et al., 2018). Only a few studies have been able to identify spatially structured trait syndromes within species (e.g. Kennedy et al., 2020; Camps et al., 2021), while others did not find any marked differentiation due to an important proportion of ITV occurring at a local scale, particularly when the considered contrasting environmental conditions resulted from a disturbance (Kumordzi et al., 2019). In our study, trait variation co-varies with a drought gradient that extends from the northern to the southern ranges, while incongruence between traits and geography is due to site-specific characteristics (Kemppinen and Niittynen, 2022). As an example, the Bucegi Mountains (Carpathians) are home to a low-stature form of C. curvula referred to as C. curvula f. pygmaea (Şerbănescu and Nyárády, 1966), which is typically found on wind-exposed plateaus and on carbonate-rich bedrock, where it forms dry fell-field communities (our personal observations). These plants therefore exhibit traits (e.g. low height) that are more similar to those found in populations of the Balkan Peninsula or South-Western Alps.
With respect to the correspondence between the functional and genetic structures, we found that the Pyrenean populations are highly congruent and form a genetically distinct group (see also Pușcaș et al., 2008a), probably due to a recent long-distance colonization from the South-Western Alps coupled with an overall decline in intrapopulation diversity.
ITV is not affected by ecological marginality
Contrary to our expectations, we found that coordination among traits was not lower in marginal populations. Earlier studies have found the within-species correlation among traits to be rather variable and to exhibit unexpected patterns. For example, Carvalho et al. (2020) found more integrated phenotypes in Pinus sylvestris at higher elevations in more stressful environments, while Boucher et al. (2013) found the strongest degree of phenotypic integration in Polygonum viviparum in sites with intermediate temperatures. In our case, marginal populations at range edges may be subject to genetic drift, leading to inefficient selection and thus low integration (Sexton et al., 2009). However, for those trait pairs that contributed highly to the conservative syndrome, coordination was higher in marginal populations, suggesting either a high phenotypic plasticity or sufficient genetic variation for an efficient trait selection. The two factors cannot be mutually exclusive. While there were significant shifts in the mean trait values in marginal populations, within-population ITV was not lower. Harsher conditions are expected to provide fewer opportunities for individuals to occupy micro-habitats (i.e. decrease the breadth of the available niche). This has been shown for elevation (Boucher et al., 2013; Carvalho et al., 2020), although a different study found an increased functional trait diversity in alpine tundra (for some traits) at both ends of the elevation gradient (Spasojevic and Suding, 2012). Only a few studies have compared population trait means and ITV in marginal conditions. A notable exception is the study by Liu et al. (2019) who focused on Brachypodium hybridum and showed that plant geographical distributions could be shaped by interactions between ITV (rather than trait means) and environmental resource availability. Karbstein et al. (2020) showed that within-habitat heterogeneity was related to ITV in Trifolium montanum. In the present study, ITV was higher for height in marginal populations, which could suggest that plant communities are structured by differentiated interspecific competition (diversity of competitors) in contrasting within-site conditions, as confirmed by the increased number of vascular species (results not shown). Marginal habitats, displaying higher NDVI heterogeneity, are characterized by contrasting local conditions due to the presence of rocks and bare soil.
Inconsistency between ITV and genetic diversity
The lack of ITV differentiation in marginal populations was not mirrored by neutral genetic diversity, which was much lower in the Pyrenees, as previously outlined by Pușcaș et al. (2008a). Karbstein et al. (2020) found in Trifolium montanum that neutral genetic diversity was not as good a predictor of ITV as within-habitat heterogeneity at the plot scale. Since neutral markers used in our study are not related to genes responsive for traits, we could not have anticipated strong relationships with ITV. Neutral genetic diversity is expected to be driven by gene flow and/or drift, whereas phenotypic diversity is determined by local environmental factors (Fourtune et al., 2018). A further inconsistency lies in the lower genetic diversity and higher species richness found in the Pyrenees and South-Western Alps, as observed previously (Pușcaș et al., 2008b).
CONCLUSIONS
In contrast to prior studies that have predominantly investigated the correlation between ITV and the environment (e.g. Shimono and Kudo, 2003; Rixen et al., 2022), our investigation provides a more in-depth understanding of the spatial patterns of ITV by integrating marginal and peripheral populations within a well-defined phylogeographical context across the European mountains. We highlighted the relevance of using a combination of morphological and anatomical traits across a range of genetic pools to seek patterns of plant adaptation to marginal conditions. Our study identified genetically distinct areas where populations of C. curvula were clustered according to trait values associated with drought tolerance. An important consideration arising from this research is that while population-mean trait shifts occur in these marginal situations, ITV and species richness remain high, even if genetic diversity is low. Therefore, the study of ITV, population genetic structure and habitat conditions may reveal response mechanisms that provide marginal populations with adaptive potential, and these factors should be considered to refine our current models of species distribution and to anticipate range shifts in response to global change.
SUPPLEMENTARY DATA
Supplementary data are available online at https://academic.oup.com/aob and consist of the following.
Table S1: The sampled sites and functional traits used in this study. Table S2: Summary and descriptive statistics for the full set of environmental factors. Table S3: Environmental response of the functional groups that emerged from the clustering with the combination of traits that showed the largest response to the environment. Figure S1: Correlation matrices of the variables related to functional traits, habitat and climate. Figure S2: Distribution of the average R2 of the clusterings that resulted from all trait combinations. Figure S3: Hierarchical clustering of the sites based on the combination of traits with the maximum responsiveness to the environment. Figure S4: Tanglegram showing the functional clustering based on the chosen trait combination and phylogenetic clustering. Figure S5: Correlation matrix of the cophenetic distance of the genetic, geographical, functional, climate and habitat trees.
ACKNOWLEDGEMENTS
Thanks are due to Olivier Tarpin, Maxime Bouclier and Lambert Bourdenet for field assistance, to Ioan Coroiu for the microtome and to Arthur Bayle for advice on Sentinel-2. We are grateful to the administration of Central Balkan National Park and National Park of Mercantour for facilitating access to several sites. P.C. and M.P. conceived the study. P.C., M.P., P.D.T., A.S., B.I.H., S.B. and A.N. conducted the fieldwork. Z.R.B. and D.P. made the leaf cross-sections and performed measurements for the anatomical traits. A.S. and P.D.T. prepared the samples for chemical analyses. D.Ș., M.P. and I.B. performed the genetic analyses. R.J. built the online ODYSSEE project database. P.C. and P.D.T. performed the statistical and image analyses. P.D.T. wrote the manuscript, with input and training from P.C. We extend our thanks to the anonymous referees for their contribution to the manuscript’s improvement. All authors contributed substantially to the draft. The ODYSSEE project database is available at https://odyssee.osug.fr/login. The authors have no conflict of interest to declare.
Contributor Information
Pavel Dan Turtureanu, A. Borza Botanic Garden, Babeș-Bolyai University, 42 Republicii Street, 400015 Cluj-Napoca, Romania; Centre for Systems Biology, Biodiversity and Bioresources (3B), Babeș-Bolyai University, 3-5 Clinicilor Street, 400006 Cluj-Napoca, Romania; Emil G. Racoviță Institute, Babeș-Bolyai University, 5-7 Clinicilor Street, 400006 Cluj-Napoca, Romania.
Mihai Pușcaș, A. Borza Botanic Garden, Babeș-Bolyai University, 42 Republicii Street, 400015 Cluj-Napoca, Romania; Centre for Systems Biology, Biodiversity and Bioresources (3B), Babeș-Bolyai University, 3-5 Clinicilor Street, 400006 Cluj-Napoca, Romania; Emil G. Racoviță Institute, Babeș-Bolyai University, 5-7 Clinicilor Street, 400006 Cluj-Napoca, Romania; Faculty of Biology and Geology, Babeș-Bolyai University, 44 Republicii Street, 400015 Cluj-Napoca, Romania.
Dorina Podar, Centre for Systems Biology, Biodiversity and Bioresources (3B), Babeș-Bolyai University, 3-5 Clinicilor Street, 400006 Cluj-Napoca, Romania; Faculty of Biology and Geology, Babeș-Bolyai University, 44 Republicii Street, 400015 Cluj-Napoca, Romania.
Zoltán Robert Balázs, Centre for Systems Biology, Biodiversity and Bioresources (3B), Babeș-Bolyai University, 3-5 Clinicilor Street, 400006 Cluj-Napoca, Romania; Faculty of Biology and Geology, Babeș-Bolyai University, 44 Republicii Street, 400015 Cluj-Napoca, Romania; Doctoral School of Integrative Biology, Babeș-Bolyai University, 1 Kogălniceanu Street, 400084 Cluj-Napoca, Romania.
Bogdan-Iuliu Hurdu, Institute of Biological Research, National Institute of Research and Development for Biological Sciences, 48 Republicii Street, 400015, Cluj-Napoca, Romania.
Andriy Novikov, Department of Biosystematics and Evolution, State Museum of Natural History of the NAS of Ukraine, 18 Teatralna Street, 79008 Lviv, Ukraine.
Julien Renaud, Univ. Grenoble Alpes, Univ. Savoie Mont Blanc, CNRS, LECA, F-38000 Grenoble, France.
Amélie Saillard, Univ. Grenoble Alpes, Univ. Savoie Mont Blanc, CNRS, LECA, F-38000 Grenoble, France.
Stéphane Bec, Univ. Grenoble Alpes, Univ. Savoie Mont Blanc, CNRS, LECA, F-38000 Grenoble, France.
Dana Șuteu, Institute of Biological Research, National Institute of Research and Development for Biological Sciences, 48 Republicii Street, 400015, Cluj-Napoca, Romania.
Ioan Băcilă, Institute of Biological Research, National Institute of Research and Development for Biological Sciences, 48 Republicii Street, 400015, Cluj-Napoca, Romania.
Philippe Choler, Univ. Grenoble Alpes, Univ. Savoie Mont Blanc, CNRS, LECA, F-38000 Grenoble, France.
FUNDING
This work was supported by the French National Research Agency [ODYSSEE project ANR-13-ISV7-0004 to P.C., BRANCUSI project No. 32660WB to P.C.], the Executive Agency for Higher Education, Research, Development and Innovation Funding in Romania [ODYSSEE project PN-II-ID-JRP-RO-FR-2012 to M.P., BioDivMount project PN-II-CT-ROFR-2014-2-0011 to M.P. and MEMOIRE project PN-III-P1-1.1-PD2016-0925 to P.D.T.], and the French Government [TRAIT-FUN scholarship 874390H to P.D.T.].
LITERATURE CITED
- Abatzoglou JT, Dobrowski SZ, Parks SA, Hegewisch KC.. 2018. Data Descriptor: TerraClimate, a high-resolution global dataset of monthly climate and climatic water balance from 1958–2015. Scientific Data 5: 170191. doi: 10.1038/sdata.2017.191. [DOI] [PMC free article] [PubMed] [Google Scholar]
- Albert CH, Thuiller W, Yoccoz NG, et al. 2010. Intraspecific functional variability: extent, structure and sources of variation. Journal of Ecology 98: 604–613. doi: 10.1111/j.1365-2745.2010.01651.x. [DOI] [Google Scholar]
- Bachle S, Nippert JB.. 2021. Microanatomical traits track climate gradients for a dominant C4 grass species across the Great Plains, USA. Annals of Botany 127: 451–459. doi: 10.1093/aob/mcaa146. [DOI] [PMC free article] [PubMed] [Google Scholar]
- Boucher FC, Thuiller W, Arnoldi C, Albert CH, Lavergne S.. 2013. Unravelling the architecture of functional variability in wild populations of Polygonum viviparum L. Functional Ecology 27: 382–391. doi: 10.1111/1365-2435.12034. [DOI] [PMC free article] [PubMed] [Google Scholar]
- Brouillette LC, Mason CM, Shirk RY, Donovan LA.. 2014. Adaptive differentiation of traits related to resource use in a desert annual along a resource gradient. New Phytologist 201: 1316–1327. doi: 10.1111/nph.12628. [DOI] [PubMed] [Google Scholar]
- Brussard PF. 1984. Geographic patterns and environmental gradients – the central–marginal model in Drosophila revisited. Annual Review of Ecology and Systematics 15: 25–64. doi: 10.1146/annurev.es.15.110184.000325. [DOI] [Google Scholar]
- Camps GA, Cosacov A, Sersic AN.. 2021. Centre–periphery approaches based on geography, ecology and historical climate stability: what explains the variation in morphological traits of Bulnesia sarmientoi? Annals of Botany 127: 943–955. doi: 10.1093/aob/mcab034. [DOI] [PMC free article] [PubMed] [Google Scholar]
- Carvalho B, Bastias CC, Escudero A, Valladares F, Benavides R.. 2020. Intraspecific perspective of phenotypic coordination of functional traits in Scots pine. PLoS One 15: e0228539. doi: 10.1371/journal.pone.0228539. [DOI] [PMC free article] [PubMed] [Google Scholar]
- Chater AO. 1980. Carex L. In: Tutin TG, Heywood VH, Burges NA. et al. eds. Flora Europaea. Cambridge: Cambridge University Press, 290–323. [Google Scholar]
- Choler P. 2015. Growth response of temperate mountain grasslands to inter-annual variations in snow cover duration. Biogeosciences 12: 3885–3897. doi: 10.5194/bg-12-3885-2015. [DOI] [Google Scholar]
- Choler P. 2018. Winter soil temperature dependence of alpine plant distribution: Implications for anticipating vegetation changes under a warming climate. Perspectives in Plant Ecology Evolution and Systematics 30: 6–15. doi: 10.1016/j.ppees.2017.11.002. [DOI] [Google Scholar]
- Choler P, Erschbamer B, Tribsch A, Gielly L, Taberlet P.. 2004. Genetic introgression as a potential to widen a species’ niche: Insights from alpine Carex curvula. Proceedings of the National Academy of Sciences of the United States of America 101: 171–176. doi: 10.1073/pnas.2237235100. [DOI] [PMC free article] [PubMed] [Google Scholar]
- Choler P, Michalet R.. 2002. Niche differentiation and distribution of Carex curvula along a bioclimatic gradient in the southwestern Alps. Journal of Vegetation Science 13: 851–858. doi: 10.1658/1100-9233(2002)013[0851:ndadoc]2.0.co;2. [DOI] [Google Scholar]
- Codignola A, Maffei M, Fusconi A, Fieschi M.. 1987. Leaf anatomy of alpine plants as related to altitudinal stress. Nordic Journal of Botany 7: 673–685. doi: 10.1111/j.1756-1051.1987.tb02036.x. [DOI] [Google Scholar]
- Das A, Prakash A, Dedon N, Doty A, Siddiqui M, Preston JC.. 2021. Variation in climatic tolerance, but not stomatal traits, partially explains Pooideae grass species distributions. Annals of Botany 128: 83–95. doi: 10.1093/aob/mcab046. [DOI] [PMC free article] [PubMed] [Google Scholar]
- De Reu J, Bourgeois J, Bats M, et al. 2013. Application of the topographic position index to heterogeneous landscapes. Geomorphology 186: 39–49. doi: 10.1016/j.geomorph.2012.12.015. [DOI] [Google Scholar]
- Diaz S, Kattge J, Cornelissen JHC, et al. 2016. The global spectrum of plant form and function. Nature 529: 167–171. doi: 10.1038/nature16489. [DOI] [PubMed] [Google Scholar]
- Durufle H, Ranocha P, Mbadinga DLM, et al. 2019. Phenotypic trait variation as a response to altitude-related constraints in Arabidopsis populations. Frontiers in Plant Science 10: 430. doi: 10.3389/fpls.2019.00430. [DOI] [PMC free article] [PubMed] [Google Scholar]
- Fourtune L, Prunier JG, Mathieu-Bégné E, et al. 2018. Intraspecific genetic and phenotypic diversity: parallel processes and correlated patterns? BioRxiv 2018: 288357. doi: 10.1101/288357. [DOI] [Google Scholar]
- Galili T. 2015. dendextend: an R package for visualizing, adjusting and comparing trees of hierarchical clustering. Bioinformatics 31: 3718–3720. doi: 10.1093/bioinformatics/btv428. [DOI] [PMC free article] [PubMed] [Google Scholar]
- García-Cervigón AI, García-López MA, Pistón N, Pugnaire FI, Olano JM.. 2021. Co-ordination between xylem anatomy, plant architecture and leaf functional traits in response to abiotic and biotic drivers in a nurse cushion plant. Annals of Botany 127: 919–929. doi: 10.1093/aob/mcab036. [DOI] [PMC free article] [PubMed] [Google Scholar]
- Garzón MB, Robson TM, Hampe A.. 2019. ΔTraitSDMs: species distribution models that account for local adaptation and phenotypic plasticity. New Phytologist 222: 1757–1765. doi: 10.1111/nph.15716. [DOI] [PubMed] [Google Scholar]
- Gauzere J, Klein EK, Brendel O, Davi H, Oddou-Muratorio S.. 2020. Microgeographic adaptation and the effect of pollen flow on the adaptive potential of a temperate tree species. New Phytologist 227: 641–653. doi: 10.1111/nph.16537. [DOI] [PubMed] [Google Scholar]
- Gilomen H. 1938. Carex curvula All. ssp. nov. rosae (Kalk-Krummsegge). Bericht über das Geobotanische Forschungsinstitut Rübel in Zürich 1937: 77–104. [Google Scholar]
- Grassein F, Till-Bottraud I, Lavorel S.. 2010. Plant resource-use strategies: the importance of phenotypic plasticity in response to a productivity gradient for two subalpine species. Annals of Botany 106: 637–645. doi: 10.1093/aob/mcq154. [DOI] [PMC free article] [PubMed] [Google Scholar]
- Grigore M-N, Toma C.. 2017. Anatomical adaptations of halophytes. Cham: Springer. doi: 10.1007/978-3-319-66480-4 [DOI] [Google Scholar]
- Guisan A, Theurillat JP, Kienast F.. 1998. Predicting the potential distribution of plant species in an alpine environment. Journal of Vegetation Science 9: 65–74. doi: 10.2307/3237224. [DOI] [Google Scholar]
- Hayes FJ, Buchanan SW, Coleman B, et al. 2019. Intraspecific variation in soy across the leaf economics spectrum. Annals of Botany 123: 107–120. doi: 10.1093/aob/mcy147. [DOI] [PMC free article] [PubMed] [Google Scholar]
- Haylock MR, Hofstra N, Tank A, Klok EJ, Jones PD, New M.. 2008. A European daily high-resolution gridded data set of surface temperature and precipitation for 1950–2006. Journal of Geophysical Research-Atmospheres 113: D20119. doi: 10.1029/2008JD010201. [DOI] [Google Scholar]
- Hijmans RJ, Cameron SE, Parra JL, Jones PG, Jarvis A.. 2005. Very high resolution interpolated climate surfaces for global land areas. International Journal of Climatology 25: 1965–1978. doi: 10.1002/joc.1276. [DOI] [Google Scholar]
- Hijmans RJ, van Etten J, Sumner M, et al. 2022. Raster: Geographic data analysis and modeling. R package version 3.6-3. https://cran.r-project.org/web/packages/raster/
- Hosmer DW, Hosmer T, Le Cessie S, Lemeshow S.. 1997. A comparison of goodness-of-fit tests for the logistic regression model. Statistics in Medicine 16: 965–980. doi:. [DOI] [PubMed] [Google Scholar]
- Jombart T. 2008. adegenet: a R package for the multivariate analysis of genetic markers. Bioinformatics 24: 1403–1405. doi: 10.1093/bioinformatics/btn129. [DOI] [PubMed] [Google Scholar]
- Karbstein K, Prinz K, Hellwig F, Roemermann C.. 2020. Plant intraspecific functional trait variation is related to within-habitat heterogeneity and genetic diversity in Trifolium montanum L. Ecology and Evolution 10: 5015–5033. doi: 10.1002/ece3.6255. [DOI] [PMC free article] [PubMed] [Google Scholar]
- Kazakou E, Vasseur F, Sartori K, Baron E, Rowe N, Vile D.. 2019. Secondary metabolites have more influence than morphophysiological traits on litter decomposability across genotypes of Arabidopsis thaliana. New Phytologist 224: 1532–1543. doi: 10.1111/nph.15983. [DOI] [PubMed] [Google Scholar]
- Kemppinen J, Niittynen P.. 2022. Microclimate relationships of intraspecific trait variation in sub-Arctic plants. Oikos 2022: e09507. [Google Scholar]
- Kennedy JP, Preziosi RF, Rowntree JK, Feller IC.. 2020. Is the central–marginal hypothesis a general rule? Evidence from three distributions of an expanding mangrove species, Avicennia germinans (L.) L. Molecular Ecology 29: 704–719. doi: 10.1111/mec.15365. [DOI] [PMC free article] [PubMed] [Google Scholar]
- Kleyer M, Dray S, de Bello F, et al. 2012. Assessing species and community functional responses to environmental gradients: which multivariate methods? Journal of Vegetation Science 23: 805–821. doi: 10.1111/j.1654-1103.2012.01402.x. [DOI] [Google Scholar]
- Kumordzi BB, Aubin I, Cardou F, et al. 2019. Geographic scale and disturbance influence intraspecific trait variability in leaves and roots of North American understorey plants. Functional Ecology 33: 1771–1784. doi: 10.1111/1365-2435.13402. [DOI] [Google Scholar]
- Kuppler J, Albert CH, Ames GM, et al. 2020. Global gradients in intraspecific variation in vegetative and floral traits are partially associated with climate and species richness. Global Ecology and Biogeography 29: 992–1007. doi: 10.1111/geb.13077. [DOI] [Google Scholar]
- Laforest-Lapointe I, Martínez-Vilalta J, Retana J.. 2014. Intraspecific variability in functional traits matters: case study of Scots pine. Oecologia 175: 1337–1348. doi: 10.1007/s00442-014-2967-x. [DOI] [PubMed] [Google Scholar]
- Laughlin DC, Mommer L, Sabatini FM, et al. 2021. Root traits explain plant species distributions along climatic gradients yet challenge the nature of ecological trade-offs. Nature Ecology & Evolution 5: 1123–1134. doi: 10.1038/s41559-021-01471-7. [DOI] [PubMed] [Google Scholar]
- Lefevre M, Wald L, Diabete L.. 2007. Using reduced data sets ISCCP-B2 from the Meteosat satellites to assess surface solar irradiance. Solar Energy 81: 240–253. doi: 10.1016/j.solener.2006.03.008. [DOI] [Google Scholar]
- Liu S, Streich J, Borevitz JO, et al. 2019. Environmental resource deficit may drive the evolution of intraspecific trait variation in invasive plant populations. Oikos 128: 171–184. doi: 10.1111/oik.05548. [DOI] [Google Scholar]
- López AS, López DR, Caballé G, Siffredi GL, Marchelli P.. 2020. Local adaptation along a sharp rainfall gradient occurs in a native Patagonian grass, Festuca pallescens, regardless of extensive gene flow. Environmental and Experimental Botany 171: 103933. doi: 10.1016/j.envexpbot.2019.103933. [DOI] [Google Scholar]
- Lozano YM, Aguilar‐Trigueros CA, Flaig IC, Rillig MC.. 2020. Root trait responses to drought are more heterogeneous than leaf trait responses. Functional Ecology 34: 2224–2235. doi: 10.1111/1365-2435.13656. [DOI] [Google Scholar]
- Moran EV, Hartig F, Bell DM.. 2016. Intraspecific trait variation across scales: implications for understanding global change responses. Global Change Biology 22: 137–150. doi: 10.1111/gcb.13000. [DOI] [PubMed] [Google Scholar]
- Myneni RB, Hoffman S, Knyazikhin Y, et al. 2002. Global products of vegetation leaf area and fraction absorbed PAR from year one of MODIS data. Remote Sensing of Environment 83: 214–231. doi: 10.1016/s0034-4257(02)00074-3. [DOI] [Google Scholar]
- Nei M. 1987. Molecular evolutionary genetics. New York: Columbia University Press. [Google Scholar]
- Niinemets U, Cescatti A, Christian R.. 2004. Constraints on light interception efficiency due to shoot architecture in broad-leaved Nothofagus species. Tree Physiology 24: 617–630. doi: 10.1093/treephys/24.6.617. [DOI] [PubMed] [Google Scholar]
- Ninot JM, Carrillo E, Ferré A.. 2017. The Pyrenees. In: Loidi J, ed. The vegetation of the Iberian Peninsula, Vol. 12. Cham: Springer. doi: 10.1007/978-3-319-54784-8_8 [DOI] [Google Scholar]
- Nolting KM, Prunier R, Midgley GF, Holsinger KE.. 2021. Intraspecific trait variation influences physiological performance and fitness in the South Africa shrub genus Protea (Proteaceae). Annals of Botany 127: 519–531. doi: 10.1093/aob/mcaa060. [DOI] [PMC free article] [PubMed] [Google Scholar]
- Ottaviani G, Keppel G, Götzenberger L, et al. 2020. Linking plant functional ecology to island biogeography. Trends in Plant Science 25: 329–339. doi: 10.1016/j.tplants.2019.12.022. [DOI] [PubMed] [Google Scholar]
- Pebesma E. 2018. Simple features for R: Standardized support for spatial vector data. R Journal 10: 439–446. doi: 10.32614/rj-2018-009. [DOI] [Google Scholar]
- Pebesma E, Bivand RS.. 2005. S classes and methods for spatial data: the sp package. R News 5: 9–13. [Google Scholar]
- Pebesma E, Rundel C, Teucher A, liblwgeom developers. 2021a. lwgeom: Bindings to selected ‘liblwgeom’ functions for simple features. R package version 0.2-9. https://cran.r-project.org/web/packages/lwgeom.
- Pebesma E, Sumner M, Racine EB, Fantini A, Blodgett D.. 2021b. stars: Spatiotemporal arrays, raster and vector data cubes. R package version 0.5-6. https://cran.r-project.org/web/packages/stars/
- Pironon S, Papuga G, Villellas J, Angert AL, García MB, Thompson JD.. 2017. Geographic variation in genetic and demographic performance: new insights from an old biogeographical paradigm. Biological Reviews 92: 1877–1909. doi: 10.1111/brv.12313. [DOI] [PubMed] [Google Scholar]
- Pușcaș M, Choler P.. 2012. A biogeographic delineation of the European Alpine System based on a cluster analysis of Carex curvula-dominated grasslands. Flora 207: 168–178. doi: 10.1016/j.flora.2012.01.002. [DOI] [Google Scholar]
- Pușcaș M, Choler P, Tribsch A, et al. 2008a. Post-glacial history of the dominant alpine sedge Carex curvula in the European Alpine System inferred from nuclear and chloroplast markers. Molecular Ecology 17: 2417–2429. doi: 10.1111/j.1365-294X.2008.03751.x. [DOI] [PubMed] [Google Scholar]
- Pușcaș M, Taberlet P, Choler P.. 2008b. No positive correlation between species and genetic diversity in European alpine grasslands dominated by Carex curvula. Diversity and Distributions 14: 852–861. doi: 10.1111/j.1472-4642.2008.00489.x. [DOI] [Google Scholar]
- R Core Team and contributors worldwide. 2022. The R Stats Package. R package version 4.4.0. https://stat.ethz.ch/R-manual/R-devel/library/stats/html/00Index.html
- Richardson SJ, Allen RB, Buxton RP, et al. 2013. Intraspecific relationships among wood density, leaf structural traits and environment in four co-occurring species of Nothofagus in New Zealand. PLoS One 8: e58878. doi: 10.1371/journal.pone.0058878. [DOI] [PMC free article] [PubMed] [Google Scholar]
- Rixen C, Wipf S, Rumpf SB, et al. 2022. Intraspecific trait variation in alpine plants relates to their elevational distribution. Journal of Ecology 110: 860–875. doi: 10.1111/1365-2745.13848. [DOI] [Google Scholar]
- Robin X, Turck N, Hainard A, et al. 2021. pROC: display and analyze ROC curves. R package version 1.18.0. https://cran.r-project.org/web/packages/pROC/index.html
- Rueda M, Godoy O, Hawkins BA.. 2018. Trait syndromes among North American trees are evolutionarily conserved and show adaptive value over broad geographic scales. Ecography 41: 540–550. doi: 10.1111/ecog.03008. [DOI] [Google Scholar]
- Sartori K, Vasseur F, Violle C, et al. 2019. Leaf economics and slow–fast adaptation across the geographic range of Arabidopsis thaliana. Scientific Reports 9: 10758. doi: 10.1038/s41598-019-46878-2. [DOI] [PMC free article] [PubMed] [Google Scholar]
- Scheepens JF, Frei ES, Stöcklin J.. 2010. Genotypic and environmental variation in specific leaf area in a widespread Alpine plant after transplantation to different altitudes. Oecologia 164: 141–150. doi: 10.1007/s00442-010-1650-0. [DOI] [PubMed] [Google Scholar]
- Sexton JP, McIntyre PJ, Angert AL, Rice KJ.. 2009. Evolution and ecology of species range limits. Annual Review of Ecology, Evolution, and Systematics 40: 415–436. doi: 10.1146/annurev.ecolsys.110308.120317. [DOI] [Google Scholar]
- Shimono Y, Kudo G.. 2003. Intraspecific variations in seedling emergence and survival of Potentilla matsumurae (Rosaceae) between alpine fellfield and snowbed habitats. Annals of Botany 91: 21–29. doi: 10.1093/aob/mcg002. [DOI] [PMC free article] [PubMed] [Google Scholar]
- Sosnovsky Y, Nachychko V, Prokopiv A, Honcharenko V.. 2021. Leaf anatomical trends in a temperate evergreen dwarf shrub, Rhododendron myrtifolium (Ericaceae) along elevational and exposure gradients in the northeastern Carpathian Mountains. Folia Geobotanica 56: 27–42. doi: 10.1007/s12224-021-09387-7. [DOI] [Google Scholar]
- Spasojevic MJ, Suding KN.. 2012. Inferring community assembly mechanisms from functional diversity patterns: the importance of multiple assembly processes. Journal of Ecology 100: 652–661. doi: 10.1111/j.1365-2745.2011.01945.x. [DOI] [Google Scholar]
- Şerbănescu I, Nyárády EI.. 1966. Genul 648. Carex L. In: Nyárády EI, ed. Flora Republicii Socialiste România, Vol. XI. Bucharest: Editura Academiei Republicii Socialiste România, 690–848. [Google Scholar]
- Șuteu D, Pușcaș M, Băcilă I, Miclăuș M, Balázs ZR, Choler P.. 2023. Development of SSR markers for Carex curvula (Cyperaceae) and their importance in investigating the species genetic structure. Molecular Biology Reports 50: 4729–4733. doi: 10.1007/s11033-023-08362-z. [DOI] [PubMed] [Google Scholar]
- Tardella FM, Bricca A, Piermarteri K, Postiglione N, Catorci A.. 2017. Context-dependent variation of SLA and plant height of a dominant, invasive tall grass (Brachypodium genuense) in sub-Mediterranean grasslands. Flora 229: 116–123. doi: 10.1016/j.flora.2017.02.022. [DOI] [Google Scholar]
- Tonin R, Gerdol R, Wellstein C.. 2020. Intraspecific functional differences of subalpine plant species growing in low-altitude microrefugia and high-altitude habitats. Plant Ecology 221: 155–166. doi: 10.1007/s11258-020-01001-8. [DOI] [Google Scholar]
- Torres-Ruiz JM, Kremer A, Carins-Murphy MR, et al. 2019. Genetic differentiation in functional traits among European sessile oak populations. Tree Physiology 39: 1736–1749. doi: 10.1093/treephys/tpz090. [DOI] [PMC free article] [PubMed] [Google Scholar]
- Turtureanu PD, Barros C, Bec S, et al. 2020. Biogeography of intraspecific trait variability in matgrass (Nardus stricta): High phenotypic variation at the local scale exceeds large scale variability patterns. Perspectives in Plant Ecology Evolution and Systematics 46: 125555. doi: 10.1016/j.ppees.2020.125555. [DOI] [Google Scholar]
- Urbanek S, Johnson K.. 2013. Tiff: Read and write TIFF images. R package version 0.1-11. https://cran.r-project.org/web/packages/tiff
- Westerband AC, Funk JL, Barton KE.. 2021. Intraspecific trait variation in plants: a renewed focus on its role in ecological processes. Annals of Botany 127: 397–410. doi: 10.1093/aob/mcab011. [DOI] [PMC free article] [PubMed] [Google Scholar]
Associated Data
This section collects any data citations, data availability statements, or supplementary materials included in this article.