

Abstract
Background and Aims
In dryland ecosystems, conifer species are threatened by more frequent and severe droughts, which can push species beyond their physiological limits. Adequate seedling establishment will be critical for future resilience to global change. We used a common garden glasshouse experiment to determine how seedling functional trait expression and plasticity varied among seed sources in response to a gradient of water availability, focusing on a foundational dryland tree species of the western USA, Pinus monophylla. We hypothesized that the expression of growth-related seedling traits would show patterns consistent with local adaptation, given clinal variation among seed source environments.
Methods
We collected P. monophylla seeds from 23 sites distributed across rangewide gradients of aridity and seasonal moisture availability. A total of 3320 seedlings were propagated with four watering treatments representing progressively decreasing water availability. Above- and below-ground growth-related traits of first-year seedlings were measured. Trait values and trait plasticity, here representing the degree of variation among watering treatments, were modelled as a function of watering treatment and environmental conditions at the seed source locations (i.e. water availability, precipitation seasonality).
Key Results
We found that, under all treatments, seedlings from more arid climates had larger above- and below-ground biomass compared to seedlings from sites experiencing lower growing-season water limitation, even after accounting for differences in seed size. Additionally, trait plasticity in response to watering treatments was greatest for seedlings from summer-wet sites that experience periodic monsoonal rain events.
Conclusions
Our results show that P. monophylla seedlings respond to drought through plasticity in multiple traits, but variation in trait responses suggests that different populations are likely to respond uniquely to changes in local climate. Such trait diversity will probably influence the potential for future seedling recruitment in woodlands that are projected to experience extensive drought-related tree mortality.
Keywords: Common garden, forest and woodland recovery, drought effects, dryland woodlands, phenotypic plasticity, Pinus monophylla, pinyon pine, precipitation seasonality, intraspecific trait variation, seedling traits, tree regeneration
INTRODUCTION
Seedling recruitment is critical for the long-term persistence of tree species (Lloret et al., 2009), yet recruitment is often considered a bottleneck for plant populations due to high rates of mortality during the first months following emergence (Fenner, 1987; Lloret et al., 2004). Having minimal carbon storage capacity and limited root systems, seedlings are more vulnerable to climate variability than mature plants (Lenoir et al., 2009; Lloret et al., 2009; Matías et al., 2017). Interacting climate change factors have amplified both climate variability and the severity and duration of droughts (Niinemets, 2010), causing tree mortality worldwide (Allen et al., 2010; Anderegg et al., 2019). Forest and woodland ecosystem recovery depends on future stand replacement by seedling establishment (Redmond et al., 2015; Andivia et al., 2018). Thus, understanding early-stage phenotypic traits that enhance survival across environmental gradients can inform predictions of forest resilience to rapidly changing conditions (Ramírez-Valiente et al., 2021).
Tree seedling growth-related traits, both above and below ground, influence drought tolerance by affecting seedlings’ ability to acquire and store resources (Sánchez-Gómez et al., 2010). Many studies on pine species have found that seedlings from drier climates invest more growth in their roots when water resources are limited (Richter et al., 2012; Moser et al., 2015; Kolb et al., 2016), and grow fewer needles to reduce water loss (Sánchez-Gómez et al., 2010). Increasing the investment in roots relative to shoots (i.e. higher root mass fraction; increased root biomass allocation) can enhance access to water and nutrients (Markesteijn and Poorter, 2009; Poorter et al., 2012; Freschet et al., 2015). Likewise, high specific root length, or the ratio of root length to dry mass of roots, tends to increase uptake rates and is considered the below-ground analogue for specific leaf area (Ostonen et al., 2007).
Dryland tree species inhabit environments that are water limited with high interannual precipitation variability and are characterized by infrequent, episodic precipitation events during the growing season (D’Odorico and Bhattachan, 2012). Plastic phenotypic trait variation, the ability of an individual to alter its phenotype in response to the environment (Albert et al., 2011; Klingenberg, 2019), represents an important strategy for coping with fluctuating conditions (Ghalambor et al., 2007; Matesanz et al., 2010; Nicotra et al., 2010; Lázaro-Nogal et al., 2015) and is known to have a heritable genetic basis (Scheiner, 1993). An adaptive strategy for seedlings of some species in variable environments is to increase above-ground growth during periods of high water availability while reducing growth during periods of water stress (Richter et al., 2012). Episodic precipitation events can thus have significant effects on plant development and survival (Gillespie and Loik, 2004) and can contribute to the evolution of plasticity in particular seedling traits (Pratt and Mooney, 2013).
For species that occupy a large geographical range, differences in the environmental conditions experienced by distinct populations may influence trait values and plasticity patterns and produce locally adapted phenotypes (Lázaro-Nogal et al., 2015). In general, populations experiencing the greatest environmental heterogeneity are expected to be more plastic in their traits, which may allow them to better manage abiotic stress (Pratt and Mooney, 2013; Valladares et al., 2014; Lázaro-Nogal et al., 2015). Populations occurring in more stressful locations, such as trailing-edge populations, have also been shown to have more plasticity (Chevin and Lande, 2011; Lázaro-Nogal et al., 2015). The ability to quickly respond to changing conditions can confer a fitness advantage in marginally suitable environments (Valladares et al., 2014; Larson and Funk, 2016). In the context of long-lived tree species, which are likely to evolve at a slower pace than the more rapid rate of climate change (Savolainen et al., 2007), the degree of plasticity in trait expression is critical for future persistence (Rehfeldt et al., 2002; Aitken et al., 2008; Oddou-Muratorio and Davi, 2014).
Pinus monophylla is a foundational tree species that occupies a large geographical area in the western USA, spanning broad climatic gradients across elevation and latitude (Ziffer-Berger et al., 2014). Recently, a regional drought between 2013 and 2015 in the Great Basin caused extensive dieback of this species (Flake and Weisberg, 2019). Recruitment of P. monophylla seedlings is expected to impose a bottleneck period for woodland stand recovery due to short-lived seeds that are dependent on favourable growing seasons and lack of available nurse shrubs for critical microhabitat (Miller et al., 2019; Urza et al., 2019). While previous research has shown that adult trait variation (e.g. seed size and needle morphology) corresponds to regional-scale climate gradients (Vasey et al., 2022), we currently lack basic knowledge on seedling phenotypic trait variation for P. monophylla, and on whether seedling responses to drought differ among seed sources.
To this aim, we conducted a common garden glasshouse experiment for P. monophylla to explore how seedling growth strategies respond to water availability. Seedlings were propagated from seeds collected from 23 elevationally distributed sites within nine distinct mountain ranges that encompassed the large gradients of temperature and seasonality of precipitation across P. monophylla’s range. We applied four watering treatments, representing a drought-stress gradient, to the seedlings and measured above- and below-ground growth-related traits and biomass allocation ratios. We quantified trait plasticity across watering treatments by comparing seedling offspring from each maternal tree. We asked the following questions: (i) How do functional traits and biomass allocation ratios of seedlings from different seed source environments respond to a gradient of water availability? (ii) How is phenotypic trait plasticity, as indicated by response to water availability, related to seed source environment?
We hypothesized that the trait values and plasticity of growth-related seedling traits would show patterns consistent with local adaptation, given clinal variation among seed source environments. For our first question, we predicted that seedlings from drier sites (high water deficit) would respond to moisture-limited treatments by growing longer and heavier roots and producing less above-ground biomass than seedlings from more mesic sites, a strategy that can reduce water stress. Conversely, we predicted that seedlings from wetter sites (both summer-wet and winter-wet) would invest more in above-ground growth than seedlings from drier sites when grown in wetter treatments. Seedlings from wetter sites, adapted to longer periods of growing season water availability, were predicted to produce greater leaf area, which would allow them to assimilate more carbon. For our second question on trait plasticity, we predicted that seedlings from hotter and drier environments and from sites that experience more temporal variation in environmental conditions, such as those that experience episodic pulses of summer precipitation, would exhibit more plasticity. We expected these seedlings to have greater capacity to shift growth strategies in response to water availability, from rapid growth rates in the well-watered treatments to slower, more conservative growth strategies in the moisture-limited treatments. An understanding of trait variation and plasticity in seedling responses to water availability provides information on probable woodland recovery following drought-induced overstorey mortality events across the range of P. monophylla.
MATERIALS AND METHODS
Study species, seed collection and seed stratification
Pinus monophylla, or singleleaf pinyon pine, is a widespread dryland tree species of the Great Basin, extending into upper-montane environments of the adjoining Mojave Desert. Pinus monophylla often co-occurs with Juniperus tree species, and pinyon–juniper woodlands are one of the most important vegetation types within the western USA, occupying >100 million acres (Romme et al., 2009). Pinus monophylla generally ranges in elevation between 1000 and 2800 m, with low-elevation sites neighbouring shrubland and grassland communities, and high-elevation sites intermixing with mesic shrubland and subalpine forest communities (Meeuwig et al., 1990). As one of the most drought-tolerant tree species globally, it grows in areas that receive 200–460 mm of precipitation annually (Meeuwig et al., 1990). It is considered a foundation species, providing habitat and food for many animals, critical ecosystem structure, and primary productivity (Lanner, 1981).
To investigate trait variation across the largest possible range of environmental conditions for P. monophylla, we stratified our sampling locations using PRISM 30-year climate normals (Daly et al., 1994) of three mean annual precipitation × three monsoonal categories. We then selected nine mountain ranges that represented each combination of these categories and were distributed relatively evenly in geographical space (Fig. 1; Vasey et al., 2022) (Supplementary Data Table S1). At each mountain range, we aimed to establish three sampling sites along an elevational gradient, separated by at least 200 m (low, middle and high). The low-elevation site for each mountain range was selected based on first detection of cone-bearing P. monophylla trees, while the high-elevation site represented the highest elevation of cone-bearing trees accessible from a road. The middle-elevation site was located at the elevational midpoint between the other two sites. In three of the mountain ranges, sampling was limited to one or two sites due to narrow elevation ranges or a lack of available cones. The sampling site elevations varied from 1515 to 2611 m, with a total of 23 sites (Fig. 1; Table S1).
Fig. 1.

(A) Seed collection sites. Seeds were collected from 23 elevationally distributed sites (symbols) in nine mountain ranges (two-letter codes: Pine Nut Mountains ‘PN’, Desatoya Mountains ‘DM’, Pequop Mountains ‘PM’, Schell Creek Mountains ‘SC’, Beaver Dam Mountains ‘BD’, Mount Irish ‘MI’, Mount Charleston ‘MC’, San Bernardino Mountains ‘SB’ and Rock Creek ‘RC’). Pinus monophylla species distribution shown in shaded areas, coloured according to climatic water deficit (red = higher water deficit; blue = lower water deficit), overlaid with contour lines representing monsoonality (i.e. the percentage of annual precipitation received in July, August and September). (B) Relationship between 30-year normals of summer precipitation and cumulative climatic water deficit for the seed collection sites. (C) Relationship between 30-year normals of winter precipitation and cumulative climatic water deficit for the seed collection sites.
At each site, we selected six maternal trees representative of the stand (based on tree size and cone production), and for each tree we harvested at least 30 mature cones in autumn 2019. After the cones opened, we removed the seeds and tested for viability using the acoustic method, following Chambers (2001). We then weighed 20 seeds (fresh weight) per tree to determine mean maternal seed mass. Up to 70 seeds per maternal tree were put into cold, moist stratification for 65 d. Seeds were flushed with running water for 36 h to imbibe the seeds (Kildisheva et al., 2012) and rinse away pathogens (James and Genz, 1981), then placed in plastic bags with wetted vermiculite and stratified in a refrigerator with an average temperature of 5 °C. Seeds were checked weekly, and when 10 % of the seeds had grown radicles, planting was initiated in the common garden glasshouse experiment in February 2020.
Common garden experimental design and glasshouse methods
Our common garden experiment took place in a climate-controlled glasshouse in Reno, NV, USA. We used a randomized block experimental design, with four watering treatments and three replicate blocks of each treatment for a total of 12 treatment blocks. Each block contained two or three replicates of stratified seeds from each of the 137 maternal trees (N = 3740). Each block had 300–320 planting cells consisting of 2.7-inch-diameter × 14-inch-tall heavy deepot cells (D60H; Stuewe & Sons, Inc.) filled with a locally obtained potting mix that was selected as being similar to native pinyon–juniper woodland soils (Triple mix; Reno Rock, Reno, NV, USA). Two stratified seeds from a randomly assigned maternal tree and seed collection site were planted into each cell to a depth of 3 cm (Chambers, 2001).
Seedlings were grown in four watering treatments that represented a gradient of soil water availability (Supplementary Data Fig. S1). To assign the watering treatments, we used a gravimetric method to track soil water content (Dumroese et al., 2015). We first selected five filled containers per treatment block that were of comparable weight at saturation (within 10 g). We then dried the soil from one of the five containers at 110 °C to obtain the oven-dry soil weight, which we used to convert the remaining deepot cells’ weight to gravimetric water content (GWC). We developed a soil water release curve for six fine soil (0.065 mm) subsamples across a range of known GWCs, allowing us to determine field capacity (maximum saturation) at 40 % GWC and permanent wilting point (−1.5 MPa) at 10 % GWC (WP4C water potential meter). All seedlings were given the wettest treatment for 1.5 months until most of the seedlings had emerged, after which we used a gradual dry-down process to achieve target GWC ranges for the watering treatments: ‘Wettest’ (34–40 % GWC), ‘Wet’ (22–28 % GWC), ‘Dry’ (10–16 % GWC) and ‘Driest’ (no addition of water following the initial seedling emergence period). Selected deepot cells were weighed daily, and irrigation was initiated for the different watering treatments when they reached the low end of the assigned GWC range (Fig. S1). Seedlings were irrigated with inverted rotor spray mini sprinklers using a fine mist. For deepot cells that had two seedlings emerge, we removed one of the seedlings to avoid competition. Trays were rotated within treatment blocks before each watering treatment to account for minor variability within each block. Temperatures in the glasshouse were maintained between 12 and 27 °C, within the diurnal range of summer temperatures experienced by naturally occurring P. monophylla seedlings across an elevational gradient (Urza et al., 2019). The experiment was concluded at the end of August 2020, following 4.5 months of treatment and 6 months of total growth.
Measurements of morphological and performance traits
Biweekly checks for status (not emerged, emerged and dead) began 3 weeks following planting at the first sign of emergence, and continued for the rest of the experiment. In total, 3320 seedlings emerged and survived, 91 emerged and died, and 329 never emerged.
Thirteen phenotypic traits were measured at the end of the experiment. Above-ground traits included height (mm), canopy area (mm2), stem diameter (mm), above-ground dried biomass (g) and number of branches. Below-ground traits included dried root biomass (g), root length (cm), specific root length (m g−1), root volume (cm3) and root surface area (cm2). We calculated three biomass allocation ratios (Poorter et al., 2012) from the above- and below-ground dry weights, including needle mass fraction (NMF, ratio of leaf biomass to total biomass of the seedling), stem mass fraction (SMF, ratio of stem biomass to total biomass of the seedling) and root mass fraction (RMF, ratio of root biomass to total biomass of seedling).
Height, canopy area and number of branches were measured at the end of the experiment for all surviving seedlings (N = 3320). Height was measured using a transparent metric ruler (1-mm precision) from the soil surface to the top of the plant. Canopy diameter at its widest point (da) and perpendicular to its widest point (db) was measured using a ruler (1-mm precision), and canopy area was calculated using the equation for an ellipse. Number of branches was counted as the number of lateral shoots growing off the main stem.
Biomass was measured using destructive methods for approximately one-third of the seedlings (N = 1113). Following root extraction and cleaning, stem diameter was measured at the level of the soil surface using a digital caliper, and above- and below-ground tissues were separated. Using a dual-light flatbed scanner (Epson Expression 1100XL; Seiko Epson, Suwa, Japan), fresh roots were scanned to obtain high-resolution imagery (1200 dpi) to measure root length, root volume and root surface area (WinRhizo; Regent Instruments, Quebec, Canada). Above- and below-ground tissues were dried at 70 °C for 4 h prior to weighing (100 g × 0.001 g scale). Needles, twigs and stems were separated and weighed individually to obtain the different above-ground biomass components for biomass allocation ratios. To calculate specific root length, root length was divided by root biomass for each seedling.
Environmental variables
Four environmental variables were derived for each seed collection site from existing spatial data layers: cumulative climatic water deficit (CumlCWD, mm), soil available water storage capacity (AWC, cm), winter precipitation (mm) and summer precipitation (mm) (Supplementary Data Table S1). Correlations among these variables were <0.41. In the Intermountain West, these environmental variables are strongly associated with water balance and help to define the lower climatic tree limit of pinyon and juniper woodlands (Urza et al., 2020), and they are correlated with P. monophylla adult tree traits (Vasey et al., 2022).
CumlCWD was calculated using a Thornthwaite water balance model (Lutz et al., 2010), which incorporates 30-year monthly normals (800-m cell size) of temperature and precipitation, elevation, and soil water holding capacity, using methods described by Dilts et al. (2015). Often considered a proxy for aridity, CumlCWD is calculated as the difference between potential evapotranspiration and actual evapotranspiration (Stephenson, 1990). It represents the evaporative demand not met by available water. In our Great Basin study area, CumlCWD is negatively associated with increasing elevation (i.e. higher elevations are wetter by this metric; Dilts et al., 2015).
AWC was obtained from the POLARIS soil map at 90-m cell size resolution (Chaney et al., 2016). Low AWC is generally associated with coarser, sandy soils with increased permeability. Water in low-AWC soils thus collects in deep soil pools (Noy-Meir, 1973), which is potentially problematic for seedlings with small roots (Redmond and Barger, 2013).
Winter precipitation (sum of precipitation in December, January and February) and summer precipitation (sum of precipitation in June, July and August) were calculated using 30-year normal (1981–2010) gridded PRISM climate data (PRISM Climate Group 2015) with 800-m cell size (Daly et al., 1994). Seasonal precipitation patterns vary across the range of P. monophylla: populations in western and northwestern areas receive most of their annual precipitation as winter snow, whereas populations in more eastern and southeastern areas experience both winter and summer precipitation due to weak monsoonal patterns (Adams and Comrie, 1997). This difference in timing affects the seasonality of growth. Populations depending exclusively on winter snowmelt grow from late spring to early summer, whereas populations receiving summer precipitation can have bimodal patterns of growth between late spring and early summer, and then again from late summer to early autumn (Notaro et al., 2010).
Statistical analysis
Modelling of traits.
To evaluate how seedling growth-related traits varied in response to watering treatment and seed source environment, we assessed each trait using linear mixed-effects models fit with maximum likelihood using the ‘lme4’ package in R Studio (Bates et al., 2015; R Core Team, 2020). The fixed effects included watering treatment, seed source environmental variables, and the interaction of treatment and seed source environment. To control for differences at the start of the experiment, we also included fixed effects for seedling emergence time (in days) and mean seed mass for each maternal tree. The random effects included block, maternal tree and mountain range. All fixed effects were standardized using z-scores. To evaluate the statistical significance of the fixed effects, we calculated analysis of variance tables with F-tests and P-values using Satterthwaite approximated degrees of freedom using the package ‘lmerTest’ (Kuznetsova et al., 2017). To visualize the marginal effects of seed source environmental variables, or predictions generated by the model when holding the non-focal variables constant and varying the focal variable, we used the ‘ggpredict’ function from the ‘ggeffects’ package in R (Lüdecke, 2018) and plotted results using ggplot2 (Wickham, 2016).
Calculating and modelling phenotypic plasticity.
Because the effect of watering treatment was non-linear, we evaluated plasticity as a trait using a relativized metric, the Relative Distance Plasticity Index (RDPI) (Valladares et al., 2006). We computed trait plasticity for each maternal tree by calculating the relative trait distance between individual seedlings for each pairwise treatment combination. This allowed us to quantify drought-related phenotypic plasticities for each variable as independent traits that varied between different source environments.
To calculate the RDPI values for each maternal tree, we used the ‘Plasticity’ package in R (Ameztegui, 2017). Each phenotypic distance was calculated by taking the absolute value of the difference between phenotypic trait values of seedlings from the same maternal trees in different watering treatments divided by the sum of those phenotypic trait values [e.g. |TraitWettest − TraitWet|/(TraitWettest + TraitWet)]. This was calculated for all combinations of treatment pairs, and final RDPI values were calculated as the average of the normalized treatment differences for each maternal tree. This non-parametric index provides a relativized value that ranges between 0 (no plasticity) and 1 (maximal plasticity), providing a consistent basis for comparison across different populations and traits.
From these outputs, we developed linear mixed-effects models with RDPI of each trait as the dependent variable as a function of fixed effects (seed source environmental variables, emergence time and seed mass) and random effects (maternal tree and mountain range). We used the same R packages for the plasticity analysis as were used in the trait analysis.
RESULTS
Above-ground traits, below-ground traits and allocation ratios
After accounting for seed mass and emergence time, seedling traits and allocation ratios remained strongly influenced by the environmental variables characterizing the seed source habitat (Table 1). Seedlings from drier climates (higher cumulative climatic water deficit), coarse or shallow soils (lower soil available water capacity) and greater precipitation in the summer months (higher summer precipitation) tended to produce larger above-ground structures. Overall, above-ground growth was smallest in the dry and driest watering treatments, while the optimal treatment for above-ground growth was the wet treatment (Supplementary Data Fig. S2: 22–28 % GWC) suggesting that more moisture increases above-ground growth only to a threshold level and that the wettest treatment was probably too moist for seedlings of this drought-tolerant species.
Table 1.
Linear mixed-effect model outputs (F-test and P-value) for seedling above-ground traits, below-ground traits and biomass allocation ratios. For each trait and fixed effect (watering treatment, environmental conditions in seed source locations, emergence time, seed mass, and the interaction of treatment and seed source environment) the F-statistic is reported in the top row, with P-values listed directly below. P-values <0.05 are in bold type.
| Trait | Fixed effects predictions | |||||||||||
|---|---|---|---|---|---|---|---|---|---|---|---|---|
| Interaction term | ||||||||||||
| F-test/P-value | Watering treatment (TRT) | Climatic water deficit | Summer precipitation | Winter precipitation | Available water storage capacity | Emergence time | Seed weight | Climatic water deficit × TRT | Summer precipitation × TRT | Winter precipitation × TRT | Available water storage × TRT | |
| Above-ground | ||||||||||||
| Height (mm) | F | 49.6 | 4.2 | 2.2 | 1.2 | 1.6 | 14.8 | 31.3 | 1.6 | 4.2 | 2.2 | 3.1 |
| P | 0.001 | 0.05 | 0.16 | 0.28 | 0.21 | 0.001 | 0.001 | 0.19 | 0.01 | 0.09 | 0.03 | |
| Canopy area (mm2) | F | 1.5 | 14.4 | 10.6 | 4.8 | 0.2 | 28.6 | 28.4 | 4.3 | 4.6 | 2.0 | 0.3 |
| P | 0.28 | 0.001 | 0.001 | 0.03 | 0.66 | 0.001 | 0.001 | 0.001 | 0.001 | 0.12 | 0.85 | |
| Stem diameter (mm) | F | 267.9 | 30.8 | 9.8 | 0.8 | 1.8 | 28.9 | 99.6 | 0.7 | 0.1 | 0.1 | 0.9 |
| P | 0.001 | 0.001 | 0.04 | 0.41 | 0.20 | 0.001 | 0.001 | 0.54 | 0.95 | 0.93 | 0.43 | |
| Above-ground biomass (g) | F | 316.7 | 8.9 | 5.7 | 0.1 | 2.5 | 43.3 | 65.3 | 1.9 | 1.0 | 1.1 | 2.1 |
| P | 0.001 | 0.01 | 0.06 | 0.75 | 0.14 | 0.001 | 0.001 | 0.12 | 0.38 | 0.34 | 0.09 | |
| Number of branches | F | 4.3 | 1.3 | 13.6 | 1.9 | 2.2 | 16.0 | 8.3 | 4.0 | 9.4 | 1.2 | 1.9 |
| P | 0.03 | 0.26 | 0.001 | 0.19 | 0.15 | 0.001 | 0.001 | 0.01 | 0.001 | 0.31 | 0.13 | |
| Below-ground | ||||||||||||
| Root biomass (log; g) | F | 269.4 | 8.2 | 1.8 | 2.6 | 0.8 | 35.3 | 120.2 | 1.37 | 0.3 | 0.6 | 0.1 |
| P | 0.001 | 0.001 | 0.18 | 0.11 | 0.39 | 0.001 | 0.001 | 0.25 | 0.82 | 0.62 | 0.97 | |
| Root length (cm) | F | 231.3 | 0.1 | 0.1 | 1.7 | 0.00 | 37.4 | 41.9 | 1.1 | 2.2 | 1.8 | 0.1 |
| P | 0.001 | 0.77 | 0.74 | 0.19 | 1.00 | 0.001 | 0.001 | 0.33 | 0.09 | 0.14 | 0.97 | |
| Specific root length (m g–1) | F | 26.0 | 11.9 | 3.4 | 2.0 | 0.2 | 0.3 | 22.3 | 0.6 | 2.0 | 1.1 | 0.7 |
| P | 0.001 | 0.001 | 0.12 | 0.19 | 0.70 | 0.57 | 0.001 | 0.60 | 0.11 | 0.35 | 0.58 | |
| Root volume (log; cm3) | F | 446.6 | 2.7 | 1.8 | 2.7 | 1.1 | 23.5 | 102.7 | 1.5 | 0.7 | 1.5 | 0.1 |
| P | 0.001 | 0.10 | 0.26 | 0.11 | 0.30 | 0.001 | 0.001 | 0.21 | 0.57 | 0.21 | 0.98 | |
| Root surface area (cm2) | F | 212.6 | 0.0 | 0.0 | 3.3 | 0.0 | 28.0 | 37.8 | 0.9 | 1.7 | 1.7 | 0.1 |
| P | 0.001 | 0.90 | 0.91 | 0.07 | 0.86 | 0.001 | 0.001 | 0.43 | 0.16 | 0.16 | 0.98 | |
| Allocation ratios | ||||||||||||
| Needle mass fraction | F | 48.8 | 5.7 | 1.4 | 1.0 | 5.6 | 2.3 | 4.5 | 0.4 | 2.4 | 0.5 | 2.0 |
| P | 0.001 | 0.02 | 0.27 | 0.34 | 0.03 | 0.13 | 0.04 | 0.77 | 0.07 | 0.66 | 0.11 | |
| Stem mass fraction (log) | F | 160.2 | 0.1 | 0.5 | 0.8 | 0.3 | 16.2 | 0.0 | 0.2 | 0.5 | 1.5 | 0.6 |
| P | 0.001 | 0.82 | 0.48 | 0.38 | 0.57 | 0.001 | 0.86 | 0.93 | 0.65 | 0.21 | 0.61 | |
| Root mass fraction | F | 77.5 | 1.4 | 2.0 | 0.9 | 0.1 | 0.3 | 5.4 | 1.1 | 1.3 | 0.3 | 0.9 |
| P | 0.001 | 0.25 | 0.19 | 0.35 | 0.80 | 0.61 | 0.02 | 0.37 | 0.29 | 0.84 | 0.45 | |
Within all treatment groups, seedling heights were greatest from sites with higher climatic water deficit (Table 1, Fig. 2A). Seedlings receiving the two driest treatments responded similarly to water availability regardless of summer precipitation of the source environment, whereas summer precipitation was positively associated with height growth for seedlings receiving the wettest treatments [Fig. 2B; p (summer precipitation × treatment [T]) = 0.01]. Similarly, soil available water capacity of the seed source was most strongly negatively related to seedling height in the wettest treatments [Fig. 2C; p (soil available water capacity × T) = 0.03]. Seedling canopy area was largest for seed sources associated with higher climatic water deficit and greater summer precipitation for all treatments (Table 1, Fig. 2D, E), and both seed source environmental variables had significant interactions with treatment (Table 1). Stem diameter was greater for seed sources from higher climatic water deficit and summer precipitation under all treatments (Table 1, Fig. 2G, H). Seedling total above-ground biomass was greater with seed sources from higher climatic water deficit (Table 1, Fig. 2I). Seedlings from drier sources (higher climatic water deficit) grew more branches than seedlings from wetter sources in the two wet treatments, but seedlings from all seed sources grew similar numbers of branches in the two dry treatments (Table 1, Fig. 2J). The dependence of branches on seed source was even stronger for summer precipitation, but, in this case, seedlings with wetter summers (higher summer precipitation) grew more branches in the wet treatments than seedlings with drier summers (Table 1, Fig. 2K).
Fig. 2.
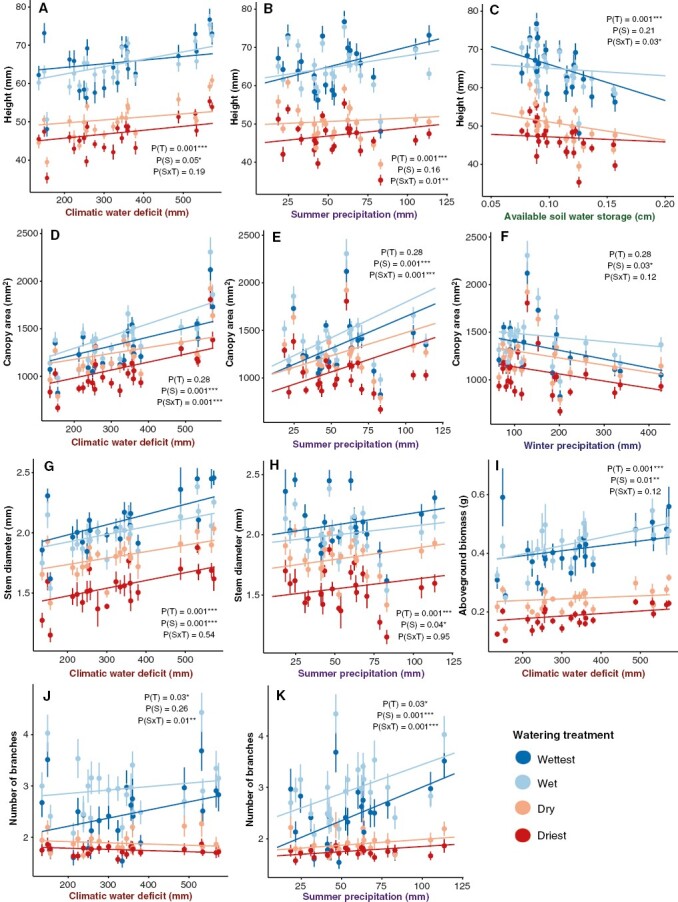
Partial effects plots for models of above-ground seedling trait values. Points represent mean trait values and standard errors for each seed source as a function of watering treatment (T) and seed source environmental conditions (S). Lines represent the partial effects of the environmental variable and its interaction with watering treatment. The four colours represent the different watering treatments: wettest = dark blue, wet = light blue, dry = peach and driest = red. Only traits with significant (P < 0.05) effects of seed source environment (S) or seed source environment × treatment (S × T) interactions are shown.
Root traits had fewer significant relationships with seed source environmental variables overall, and source environment and watering treatment had no significant interactions. However, all root traits were significantly affected by watering treatment (Table 1), decreasing in growth under the drier watering treatments (Supplementary Data Fig. S3). Seedling root biomass was greater for seed sources with higher climatic water deficit in all treatments (Table 1, Fig. 3A). Conversely, specific root length decreased for seed sources with higher climatic water deficit (Table 1, Fig. 3B).
Fig. 3.
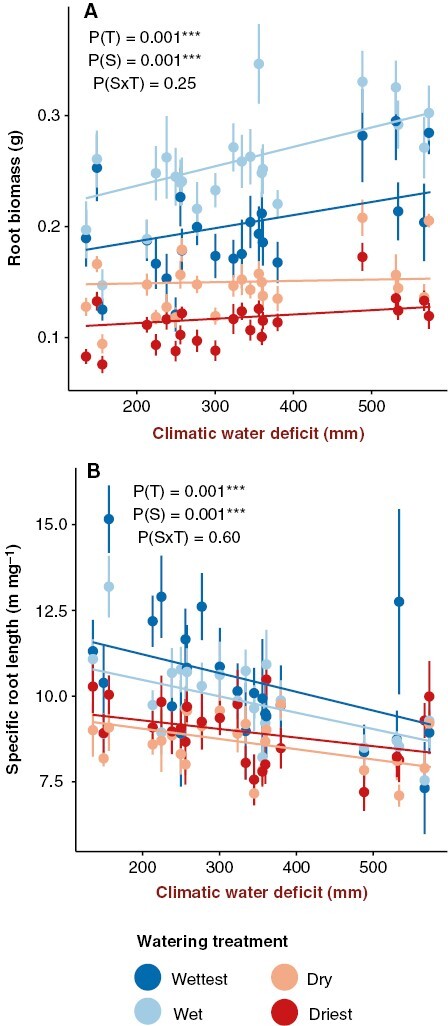
Partial effects plots for models of below-ground seedling trait values. Points represent mean trait values and standard errors for each seed source as a function of watering treatment (T) and seed source environmental conditions (S). Lines represent the partial effects of the environmental variable and its interaction with watering treatment. The four colours represent the different watering treatments: wettest = dark blue, wet = light blue, dry = peach and driest = red. Only traits with significant (P < 0.05) effects of seed source environment (S) or seed source environment × treatment (S × T) interactions are shown.
Although all biomass allocation ratios were significantly affected by watering treatment, only needle mass fraction had significant seed source environmental effects (Table 1, Fig. 4). Needle mass fraction had a weak positive relationship with climatic water deficit and soil available water capacity of the seed source environment (Table 1, Fig. 4A, B). Overall, the drier watering treatments produced seedlings with lower needle mass and with higher stem mass fraction and root mass fraction (Supplementary Data Fig. S4). None of the biomass allocation ratios had significant interactions with seed source environment and watering treatment.
Fig. 4.
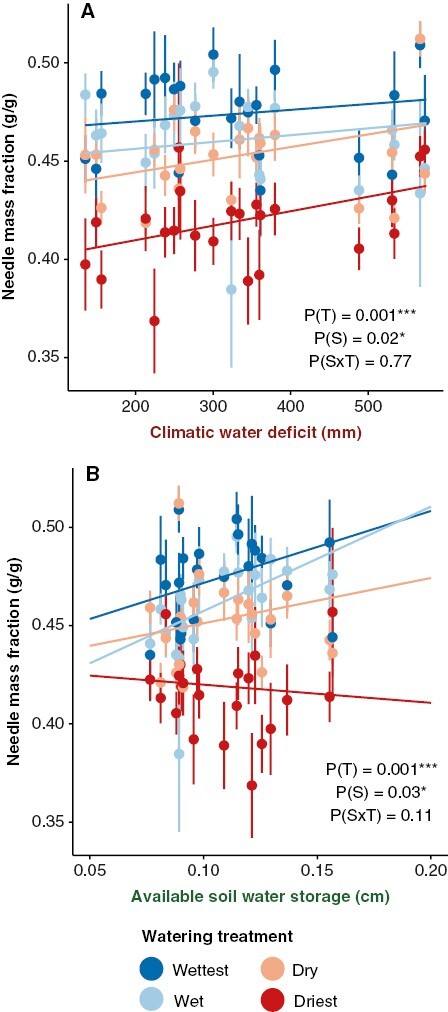
Partial effects plots for models of seedling biomass allocation ratios. Points represent mean trait values and standard errors for each seed source as a function of watering treatment (T) and seed source environmental conditions (S). Lines represent the partial effects of the environmental variable and its interaction with watering treatment. The four colours represent the different watering treatments: wettest = dark blue, wet = light blue, dry = peach and driest = red. Only traits with significant (P < 0.05) effects of seed source environment (S) or seed source environment × treatment (S × T) interactions are shown.
Plasticity
Plasticity in certain traits varied depending on the seed source environment and was most strongly related to the magnitude of summer precipitation (Supplementary Data Figs S5–S7). Above-ground biomass plasticity ranged from 0 to 0.92 and was greatest for seed sources with greater climatic water deficit, summer precipitation and winter precipitation, with the strongest effects of summer precipitation (Table 2, Fig. 5A–C). Plasticity in number of branches (0–1) was greatest for seed sources with greater summer precipitation (Table 2, Fig. 5D). Plasticity in biomass allocation ratios also did not vary with seed source environment (Table 2; Fig. S7).
Table 2.
Linear mixed-effects model outputs for RDPI values as the dependent variables. For each trait the F-statistic is shown in the top row and the associated P-value directly below. P-values <0.05 are in bold type. Trait plasticity in six models had significant relationships with seed source environment.
| Trait | Fixed effects predictions | ||||||
|---|---|---|---|---|---|---|---|
| F-test/P-value | Climatic water deficit | Summer precipitation | Winter precipitation | Available soil water storage | Emergence time | Seed mass | |
| Above-ground | |||||||
| Height plasticity | F | 0.0 | 2.5 | 0.0 | 0.9 | 1.2 | 0.3 |
| P | 0.99 | 0.12 | 0.96 | 0.36 | 0.28 | 0.58 | |
| Canopy area plasticity | F | 2.6 | 0.4 | 1.5 | 0.5 | 0.6 | 7.7 |
| P | 0.11 | 0.51 | 0.23 | 0.49 | 0.45 | 0.01 | |
| Stem diameter plasticity | F | 0.0 | 0.1 | 0.0 | 0.1 | 1.9 | 0.5 |
| P | 0.97 | 0.76 | 0.93 | 0.73 | 0.17 | 0.49 | |
| Total above-ground biomass plasticity | F | 3.9 | 16.5 | 4.2 | 0.1 | 0.8 | 3.1 |
| P | 0.05 | <0.001 | 0.04 | 0.74 | 0.36 | 0.08 | |
| Number of branches plasticity | F | 0.2 | 9.9 | 1.0 | 1.6 | 0.2 | 0.0 |
| P | 0.70 | <0.001 | 0.33 | 0.21 | 0.70 | 0.98 | |
| Below-ground | |||||||
| Root biomass plasticity | F | 7.1 | 7.1 | 3.2 | 2.3 | 2.9 | 0.1 |
| P | 0.01 | 0.01 | 0.08 | 0.13 | 0.09 | 0.82 | |
| Root length plasticity | F | 2.4 | 7.1 | 4.5 | 1.5 | 0.0 | 0.1 |
| P | 0.13 | 0.03 | 0.06 | 0.24 | 0.99 | 0.81 | |
| Specific root length plasticity | F | 0.3 | 1.1 | 1.1 | 0.6 | 1.8 | 0.4 |
| P | 0.6 | 0.3 | 0.3 | 0.4 | 0.2 | 0.5 | |
| Root volume plasticity | F | 0.00 | 2.96 | 2.31 | 0.45 | 1.40 | 0.74 |
| P | 1.0 | 0.1 | 0.2 | 0.5 | 0.2 | 0.4 | |
| Root surface area plasticity | F | 0.9 | 5.5 | 4.4 | 1.5 | 0.4 | 0.5 |
| P | 0.35 | 0.04 | 0.06 | 0.24 | 0.54 | 0.46 | |
| Allocation ratios | |||||||
| Needle mass fraction plasticity | F | 0.6 | 0.1 | 0.1 | 0.1 | 0.9 | 6.8 |
| P | 0.43 | 0.71 | 0.81 | 0.72 | 0.33 | 0.01 | |
| Stem mass fraction plasticity | F | 2.3 | 3.1 | 0.0 | 0.1 | 0.1 | 4.0 |
| P | 0.13 | 0.08 | 0.92 | 0.75 | 0.77 | 0.05 | |
| Root mass fraction plasticity | F | 0.4 | 0.3 | 2.5 | 0.5 | 0.8 | 3.4 |
| P | 0.53 | 0.57 | 0.12 | 0.49 | 0.38 | 0.07 | |
Fig. 5.
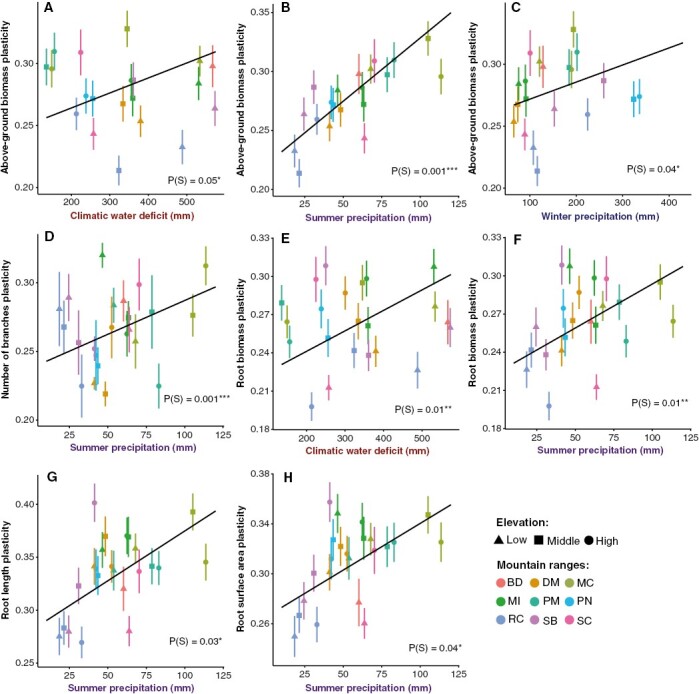
Partial effects plots for models of trait plasticity in response to watering treatments (calculated as RDPI). Points represent mean plasticity values and standard errors for each seed source as a function of seed source environmental conditions (S). Lines represent the partial effect of the environmental variable. Colours represent mountain ranges, and symbols represent elevation categories for each site. Only traits with significant (P < 0.05) effects of seed source environment (S) are shown.
Interestingly, although root mean traits showed little variation with seed source environment, root trait plasticity showed consistent patterns of variation (Supplementary Data Fig. S6). Root biomass plasticity (0–0.86) was greatest for seed sources with higher climatic water deficit and greater summer precipitation (Table 1, Fig. 5E, F). Root length plasticity (0–0.92) was greatest for seed sources with greater summer precipitation (Table 2, Fig. 5G). Lastly, root surface area plasticity (0–0.86) was greatest for seed sources with greater summer precipitation (Table 2, Fig. 5H). Trait plasticity in response to watering treatments did not vary significantly with soil available water capacity of the seed source (Table 2).
DISCUSSION
Seedling trait values vary along seed source environmental gradients
Our findings showed that seedling trait values varied with watering treatment, and that these responses differed depending on the environmental conditions associated with the seed sources. Contrary to our predictions, seedlings sourced from drier climates (higher cumulative climatic water deficit) or from sites with greater summer precipitation grew more above ground in all treatments compared to seedlings sourced from wetter sites. In general, the influence of water deficit on above-ground seedling traits was of greater magnitude than the influence of summer precipitation. Root traits followed the expected trend, with seedlings from drier climates producing higher root biomass and lower specific root length than seedlings from wetter climates. Notably, seedling growth was strongly related to climatic water deficit even after accounting for the effect of seed mass, which for P. monophylla has been shown to be greater in more arid sites (Vasey et al., 2022). Overall, clinal variation in traits that correspond to environmental gradients is consistent with local adaptation, supporting our hypothesis.
Our results suggest that seedlings from areas with greater water deficits, where good water years are scarce, have developed adaptations that enable greater above- and below-ground growth when water is available. Seedlings from drier environments grew taller, with larger canopy area, thicker stems and greater root biomass, compared to seedlings from more mesic environments. Contrary to our prediction that seedlings from the drier seed sources would only establish larger root systems, we found that overall growth of these seedlings was greater both above- and below-ground than seedlings from wetter environments. This strategy of rapid growth can increase carbon gain at the start of establishment and help ensure resource reserves for later use (Li et al., 2020), while also producing more extensive root systems to minimize drought stress in the long run. Allocating more resources to above-ground biomass, however, can increase the risk of mortality (e.g. hydraulic failure), particularly when resources become limited (Augustine and Reinhardt, 2019; Shen et al., 2019).
It is adaptive for seedlings under drought stress to increase root biomass via root diameter (i.e. thicker roots), a strategy that can increase survival in dry environments, defend against pests and pathogens, and maintain transport capacity and stability (Poorter and Ryser, 2015; Larson and Funk, 2016; Shen et al., 2019). High specific root length, or having long, thin roots, is less expensive to produce and allows greater resource acquisition (i.e. greater absorptive length per unit biomass), but comes at the cost of being less stress-tolerant (Withington et al., 2006; Larson and Funk, 2016). We found that seedlings sourced from drier locations within the range of P. monophylla consistently had the greatest root biomass and lower specific root length, potentially allowing seedlings to withstand greater environmental stress. In contrast, seedlings sourced from wetter locations generally had thinner and longer roots that are well suited for resource acquisition during the growing season when moisture is available. However, the relationship between root biomass and seed source environment was weaker in the driest watering treatments, suggesting that the capacity for seedlings to express phenotypic variation may be reduced under extreme stress (Diethelm et al., 2022).
Consistent with prior studies (Jose et al., 2003; Padilla et al., 2007; Poorter et al., 2012), our study found that under watering treatments that simulate extreme drought conditions, seedlings increased their biomass allocations to stems and roots while reducing their needle allocation regardless of seed source environment. Because shoot and root biomass showed similar relationships across seed source environments, biomass allocation ratios responded primarily to watering treatment, and the proportion of biomass allocated towards shoots vs. roots did not vary as a function of seed source environment. Although we had predicted that seedlings from drier climates would invest more in below-ground biomass than seedlings from wetter climates, low variability in allocation ratios across seed sources was probably due to plant requirements to maintain balanced performance among leaves, stems and roots (Poorter et al., 2012).
Trait plasticity is related to seed source summer precipitation
In general, the results support our prediction that populations which experience more episodic summer precipitation are more plastic in their trait expressions (Pratt and Mooney, 2013). A trade-off exists between optimizing growth during favourable conditions vs. growing more slowly to avoid subsequent mortality when conditions become more stressful later (Grime, 2006; Martinez-Villata et al., 2010). Populations from across the range of P. monophylla face relatively high growing season water deficits; however, some of these populations (i.e. ‘summer-wet’ populations) also experience periodic summer precipitation from monsoonal weather events which, if supplying sufficient moisture, can signal species in arid and semi-arid climates to initiate growth (Noy-Meir, 1973; Gillespie and Loik, 2004; Walck et al., 2011). Pinus monophylla is characterized as an isohydric species that loses its ability to assimilate carbon below a leaf water potential of −2 MPa (Nowak et al., 1999). It is therefore important for this species to utilize infrequent periods of increased soil moisture for carbon gain before closing stomata to prevent water loss during extended dry periods (West, 2006). Thus, our finding that seedlings from summer-wet environments exhibited greater growth plasticity in response to watering is consistent with our hypothesis of local adaptation.
Having greater capacity to quickly respond to changing environmental conditions (i.e. higher trait plasticity) can confer a fitness advantage, particularly in environments that are more resource-limited (Valladares et al., 2014; Larson and Funk, 2016). With less developed root systems, tree seedlings in semi-arid environments mainly have access to the shallow surface soil layer, which is subject to more variable soil moisture conditions (Matías et al., 2012). Although nutrients essential for plant growth are concentrated within this soil layer, soil drying due to drought reduces diffusivity and mass flow of nutrients (Ryel et al., 2008), and precipitation-induced nutrient pulses are only available to roots in contact with the surface layers (Hodge, 2004; Ryel et al., 2008). Thus, greater root plasticity at the recruitment stage could favour uptake of essential nutrients during periods of increased soil moisture (Vizcaíno-Palomar et al., 2020). Although we could not evaluate trait-associated differences in seedling survival because few seedlings died during our study, we found that root biomass plasticity, root length plasticity and root surface area plasticity were highest for seedlings from summer-wet environments, potentially allowing a faster growth response to infrequent resource pulses (Ushio et al., 2015; Vizcaíno-Palomar et al., 2020).
CONCLUSIONS
Tree species worldwide are facing increasingly severe and frequent drought events associated with climate change (Allen et al., 2010). Our study provides insights into how drought stress may affect seedling recruitment in different environments throughout the range of a widespread tree species. Variation in trait expression corresponded to seed source environmental conditions and was structured along regional gradients of precipitation seasonality, as well as more local, elevational gradients of water availability.
Local adaptation in seedling traits – suggested by environmentally structured clinal variation in both trait values and trait plasticity – is expected to influence the ability of P. monophylla to adapt in situ and establish in future hotter and drier environments. Populations from the drier environments within its range are predicted to be disproportionally affected by increased future drought (Anderegg et al., 2019). Our findings suggest that seedlings from these populations have adaptations that may allow them to survive more stressful environmental conditions, including efficient growth that increases carbon assimilation, resource storage pools and structural support.
We found that summer precipitation was strongly related to seedling trait responses, suggesting that shifts in precipitation seasonality, and not only changes in total annual water availability, may affect P. monophylla populations in future climates. Greater trait plasticity of summer-wet seedlings indicates that plastic growth strategies may have evolved from exposure to infrequent periods of increased soil moisture. Phenotypic plasticity involves non-genetic changes in traits, yet plasticity itself is heritable and can vary among populations and species (Scheiner, 1993). While phenotypic plasticity is generally thought to be adaptive for plant populations experiencing rapid environmental change (Nicotra et al., 2010), it has also been suggested that adaptation to changing climate may be inhibited for phenotypically plastic traits (Westerband et al., 2021). Our results suggest that in the short term, recruitment in trailing-edge (e.g. low-elevation) populations from the summer-dry portions of the range of P. monophylla may be negatively impacted by the limited capacity of seedlings to respond plastically to increasing aridity. Because slow-growing, dryland tree species such as P. monophylla can spend decades in the juvenile stage, the capacity of seedlings for plasticity in response to environmental stress will be particularly important under ongoing climatic change.
SUPPLEMENTARY DATA
Supplementary data are available online at https://academic.oup.com/aob and consist of the following.
Table S1: Site information for each seed source. Fig. S1: Graph of watering treatments over the course of the experiment using gravimetric methods. Fig. S2: Partial effects plots for all above-ground traits. Fig. S3: Partial effects plots for all below-ground traits. Fig. S4: Partial effects plots for all biomass allocation ratios. Fig. S5: Partial effects plots for all above-ground trait plasticities. Fig S6: Partial effects plots for all below-ground trait plasticities. Fig. S7: Partial effects plots for all biomass allocation ratio trait plasticities.
ACKNOWLEDGEMENTS
We thank Scott Huber for providing glasshouse space and for installing irrigation, as well as Sarah Bisbing for providing access to the optical scanner and WinRhizo program. We additionally thank Kasten Dumroese and Elizabeth Leger for their guidance in the glasshouse experimental design. We are grateful to Erica Sutherland, Spencer Cortright, the UNR Great Basin Landscape Ecology Lab, and affiliated volunteers for assisting with the experimental set-up and data collection. The findings and conclusions in this publication are those of the authors and should not be construed to represent any official USDA or U.S. Government determination or policy. P.W., A.U., J.C. and G.V. conceived and designed the study; G.V. conducted the experiment, led data collection and performed the analysis, with support from A.U. and J.C.; G.V. wrote the first draft of the manuscript; P.W., A.U., J.C., E.P. and G.V. wrote the subsequent drafts and final version.
Contributor Information
Georgia L Vasey, Department of Natural Resources and Environmental Science, University of Nevada Reno, 1664 N. Virginia Street, Mail Stop 186, Reno, NV 89557, USA.
Alexandra K Urza, USDA Forest Service, Rocky Mountain Research Station, 920 Valley Road, Reno, NV 89512, USA.
Jeanne C Chambers, USDA Forest Service, Rocky Mountain Research Station, 920 Valley Road, Reno, NV 89512, USA.
Elizabeth G Pringle, Department of Biology, Program in Ecology, Evolution and Conservation Biology, University of Nevada Reno, 1664 N. Virginia Street, Mail Stop 0314, Reno, NV 89557, USA.
Peter J Weisberg, Department of Natural Resources and Environmental Science, University of Nevada Reno, 1664 N. Virginia Street, Mail Stop 186, Reno, NV 89557, USA.
FUNDING
This work was supported by the United States Department of Agriculture (USDA) National Institute of Food and Agriculture [Hatch grant 1019902]; by the Nevada Agricultural Experiment Station; and by the USDA Forest Service, Rocky Mountain Research Station. Support to E.P. was provided by the National Science Foundation Division of Environmental Biology [NSF DEB 21-45757].
LITERATURE CITED
- Adams DK, Comrie AC.. 1997. The North American monsoon. Bulletin of the American Meteorological Society 78: 2197–2213. doi:. [DOI] [Google Scholar]
- Aitken SN, Yeaman S, Holliday JA, Wang T, Curtis-McLane S.. 2008. Adaptation, migration or extirpation: climate change outcomes for tree populations. Evolutionary Applications 1: 95–111. doi: 10.1111/j.1752-4571.2007.00013.x. [DOI] [PMC free article] [PubMed] [Google Scholar]
- Albert CH, Grassein F, Schurr FM, Vieilledent G, Violle C.. 2011. When and how should intraspecific variability be considered in trait-based plant ecology? Perspectives in Plant Ecology, Evolution and Systematics 13: 217–225. doi: 10.1016/j.ppees.2011.04.003. [DOI] [Google Scholar]
- Allen CD, Macalady AK, Chenchouni H, et al. 2010. A global overview of drought and heat-induced tree mortality reveals emerging climate change risks for forests. Forest Ecology and Management 259: 660–684. doi: 10.1016/j.foreco.2009.09.001. [DOI] [Google Scholar]
- Ameztegui, A. 2017. Plasticity: An R package to determine several plasticity indices. https://github.com/ameztegui/Plasticity (accessed 8 October 2022).
- Anderegg WR, Anderegg LD, Kerr KL, Trugman AT.. 2019. Widespread drought-induced tree mortality at dry range edges indicates that climate stress exceeds species’ compensating mechanisms. Global Change Biology 25: 3793–3802. [DOI] [PubMed] [Google Scholar]
- Andivia E, Madrigal-González J, Villar-Salvador P, Zavala MA.. 2018. Do adult trees increase conspecific juvenile resilience to recurrent droughts? Implications for forest regeneration. Ecosphere 9: e02282. doi: 10.1002/ecs2.2282. [DOI] [Google Scholar]
- Augustine SP, Reinhardt K.. 2019. Differences in morphological and physiological plasticity in two species of first-year conifer seedlings exposed to drought result in distinct survivorship patterns. Tree Physiology 39: 1446–1460. doi: 10.1093/treephys/tpz048. [DOI] [PubMed] [Google Scholar]
- Bates D, Mächler M, Bolker B, Walker S.. 2015. Fitting linear mixed-effects models using lme4. Journal of Statistical Software 67: 1–48. [Google Scholar]
- Chambers JC. 2001. Pinus monophylla establishment in an expanding Pinus–Juniperus woodland: environmental conditions, facilitation and interacting factors. Journal of Vegetation Science 12: 27–40. doi: 10.2307/3236671. [DOI] [Google Scholar]
- Chaney NW, Wood EF, McBratney AB, et al. 2016. POLARIS: A 30-meter probabilistic soil series map of the contiguous United States. Geoderma 274: 54–67. doi: 10.1016/j.geoderma.2016.03.025. [DOI] [Google Scholar]
- Chevin LM, Lande R.. 2011. Adaptation to marginal habitats by evolution of increased phenotypic plasticity. Journal of Evolutionary Biology 24: 1462–1476. doi: 10.1111/j.1420-9101.2011.02279.x. [DOI] [PubMed] [Google Scholar]
- D’Odorico P, Bhattachan A.. 2012. Hydrologic variability in dryland regions: impacts on ecosystem dynamics and food security. Philosophical Transactions of the Royal Society B: Biological Sciences 367: 3145–3157. [DOI] [PMC free article] [PubMed] [Google Scholar]
- Daly C, Neilson RP, Phillips DL.. 1994. A statistical-topographic model for mapping climatological precipitation over mountainous terrain. Journal of Applied Meteorology 33: 140–158. doi:. [DOI] [Google Scholar]
- Diethelm AC, Reichelt M, Dilts TE, Farlin JP, Marlar A, Pringle EG.. 2022. Climatic history, constraints, and the plasticity of phytochemical traits under water stress. Ecosphere 13: e4167. [Google Scholar]
- Dilts TE, Weisberg PJ, Dencker CM, Chambers JC.. 2015. Functionally relevant climate variables for arid lands: a climatic water deficit approach for modelling desert shrub distributions. Journal of Biogeography 42: 1986–1997. doi: 10.1111/jbi.12561. [DOI] [Google Scholar]
- Dumroese RK, Pinto JR, Montville ME.. 2015. Using container weights to determine irrigation needs: a simple method. Native Plants Journal 16: 67–71. doi: 10.3368/npj.16.1.67. [DOI] [Google Scholar]
- Fenner M. 1987. Seedlings. New Phytologist 106: 35–47. [Google Scholar]
- Flake SW, Weisberg PJ.. 2019. Fine-scale stand structure mediates drought-induced tree mortality in pinyon–juniper woodlands. Ecological Applications 29: e018131. [DOI] [PubMed] [Google Scholar]
- Freschet GT, Swart EM, Cornelissen JHC.. 2015. Integrated plant phenotypic responses to contrasting above- and below-ground resources: key roles of specific leaf area and root mass fraction. New Phytologist 206: 1247–1260. doi: 10.1111/nph.13352. [DOI] [PubMed] [Google Scholar]
- Ghalambor CK, McKay JK, Carroll SP, Reznick DN.. 2007. Adaptive versus non-adaptive phenotypic plasticity and the potential for contemporary adaptation in new environments. Functional Ecology 21: 394–407. doi: 10.1111/j.1365-2435.2007.01283.x. [DOI] [Google Scholar]
- Gillespie IG, Loik ME.. 2004. Pulse events in Great Basin Desert shrublands: physiological responses of Artemisia tridentata and Purshia tridentata seedlings to increased summer precipitation. Journal of Arid Environments 59: 41–57. doi: 10.1016/j.jaridenv.2004.01.007. [DOI] [Google Scholar]
- Grime, PJ. 2006. Plant strategies, vegetation processes, and ecosystem properties. Chichester: John Wiley and Sons. [Google Scholar]
- Hodge A. 2004. The plastic plant: root responses to heterogeneous supplies of nutrients. New Phytologist 162: 9–24. doi: 10.1111/j.1469-8137.2004.01015.x. [DOI] [Google Scholar]
- James, RL, Genz, D.. 1981. Ponderosa pine seed treatments: effects on seed germination and disease incidence. USDA Forest Service. 16. Vol. 81. Missoula, MT. Northern Region Report. [Google Scholar]
- Jose S, Merritt S, Ramsey CL.. 2003. Growth, nutrition, photosynthesis and transpiration responses of longleaf pine seedlings to light, water and nitrogen. Forest Ecology and Management 180: 335–344. doi: 10.1016/s0378-1127(02)00583-2. [DOI] [Google Scholar]
- Kildisheva OA, Regan DJ, Davis AS.. 2012. Seed treatments for container seedling production at the University of Idaho. Lincoln (NE): USDA Forest Service. Forest Nursery Notes 32: 10–15. [Google Scholar]
- Klingenberg CP. 2019. Phenotypic plasticity, developmental instability and robustness: the concepts and how they are connected. Frontiers in Ecology and Evolution 7: 56. [Google Scholar]
- Kolb TE, Grady KC, McEttrick MP, Herrero A.. 2016. Local-scale drought adaptation of ponderosa pine seedlings at habitat ecotones. Forest Science 62: 641–651. doi: 10.5849/forsci.16-049. [DOI] [Google Scholar]
- Kuznetsova A, Brockhoff PB, Christensen RHB.. 2017. lmerTest package: tests in linear mixed effects models. Journal of Statistical Software 82: 1–26. [Google Scholar]
- Lanner, RM. 1981. The piñon pine: a natural and cultural history. Reno, NV: University of Nevada Press. [Google Scholar]
- Larson JE, Funk JL.. 2016. Seedling root responses to soil moisture and the identification of a belowground trait spectrum across three growth forms. New Phytologist 210: 827–838. doi: 10.1111/nph.13829. [DOI] [PubMed] [Google Scholar]
- Lázaro-Nogal A, Matesanz S, Godoy A, Pérez-Trautman F, Gianoli E, Valladares F.. 2015. Environmental heterogeneity leads to higher plasticity in dry-edge populations of a semi-arid Chilean shrub: insights into climate change responses. Journal of Ecology 103: 338–350. doi: 10.1111/1365-2745.12372. [DOI] [Google Scholar]
- Lenoir J, Gégout JC, Pierrat JC, Bontemps JD, Dhôte JF.. 2009. Differences between tree species seedling and adult altitudinal distribution in mountain forests during the recent warm period (1986–2006). Ecography 32: 765–777. doi: 10.1111/j.1600-0587.2009.05791.x. [DOI] [Google Scholar]
- Li Q, Zhao M, Wang N, et al. 2020. Water use strategies and drought intensity define the relative contributions of hydraulic failure and carbohydrate depletion during seedling mortality. Plant Physiology and Biochemistry 153: 106–118. doi: 10.1016/j.plaphy.2020.05.023. [DOI] [PubMed] [Google Scholar]
- Lloret F, Peñuelas J, Estiarte M.. 2004. Experimental evidence of reduced diversity of seedlings due to climate modification in a Mediterranean-type community. Global Change Biology 10: 248–258. doi: 10.1111/j.1365-2486.2004.00725.x. [DOI] [Google Scholar]
- Lloret F, Peñuelas J, Prieto P, Llorens L, Estiarte M.. 2009. Plant community changes induced by experimental climate change: Seedling and adult species composition. Perspectives in Plant Ecology, Evolution and Systematics 11: 53–63. doi: 10.1016/j.ppees.2008.09.001. [DOI] [Google Scholar]
- Lüdecke D. 2018. ggeffects: Tidy data frames of marginal effects from regression models. Journal of Open Source Software 3: 772. doi: 10.21105/joss.00772. [DOI] [Google Scholar]
- Lutz JA, van Wagtendonk JW, Franklin JF.. 2010. Climatic water deficit, tree species ranges, and climate change in Yosemite National Park. Journal of Biogeography 37: 936–950. [Google Scholar]
- Markesteijn L, Poorter L.. 2009. Seedling root morphology and biomass allocation of 62 tropical tree species in relation to drought- and shade-tolerance. Journal of Ecology 97: 311–325. doi: 10.1111/j.1365-2745.2008.01466.x. [DOI] [Google Scholar]
- Martínez-Vilalta J, Mencuccini M, Vayreda J, Retana J.. 2010. Interspecific variation in functional traits, not climatic differences among species ranges, determines demographic rates across 44 temperate and Mediterranean tree species. Journal of Ecology 98: 1462–1475. doi: 10.1111/j.1365-2745.2010.01718.x. [DOI] [Google Scholar]
- Matesanz S, Gianoli E, Valladares F.. 2010. Global change and the evolution of phenotypic plasticity in plants. Annals of the New York Academy of Science 1206: 35–55. [DOI] [PubMed] [Google Scholar]
- Matías L, Zamora R, Castro J.. 2012. Sporadic rainy events are more critical than increasing of drought intensity for woody species recruitment in a Mediterranean community. Oecologia 169: 833–844. doi: 10.1007/s00442-011-2234-3. [DOI] [PubMed] [Google Scholar]
- Matías L, Castro J, Villar-Salvador P, Quero JL, Jump AS.. 2017. Differential impact of hotter drought on seedling performance of five ecologically distinct pine species. Plant Ecology 218: 201–212. [Google Scholar]
- Meeuwig RO, Budy JD, Everett RL.. 1990. Pinus monophylla Torr. & Frem., singleleaf pinyon pine. Silvics of North America: Conifers 1: 380–384. [Google Scholar]
- Miller RF, Chambers JC, Evers L, et al. 2019. The ecology, history, ecohydrology, and management of pinyon and juniper woodlands in the Great Basin and Northern Colorado Plateau of the western United States. Gen. Tech. Rep. RMRS-GTR-403. Fort Collins, CO: US Department of Agriculture, Forest Service, Rocky Mountain Research Station 284: 403. [Google Scholar]
- Moser B, Kipfer T, Richter S, Egli S, Wohlgemuth T.. 2015. Drought resistance of Pinus sylvestris seedlings conferred by plastic root architecture rather than ectomycorrhizal colonisation. Annals of Forest Science 72: 303–309. [Google Scholar]
- Nicotra AB, Atkin OK, Bonser SP, et al. 2010. Plant phenotypic plasticity in a changing climate. Trends in Plant Science 15: 684–692. doi: 10.1016/j.tplants.2010.09.008. [DOI] [PubMed] [Google Scholar]
- Niinemets U. 2010. Responses of forest trees to single and multiple environmental stresses from seedlings to mature plants: Past stress history, stress interactions, tolerance and acclimation. Forest Ecology and Management 260: 1623–1639. doi: 10.1016/j.foreco.2010.07.054. [DOI] [Google Scholar]
- Notaro M, Liu Z, Gallimore RG, Williams JW, Gutzler DS, Collins S.. 2010. Complex seasonal cycle of ecohydrology in the Southwest United States. Journal of Geophysical Research, Biogeosciences 115: G4. [Google Scholar]
- Nowak RS, Moore DJ, Tausch RJ.. 1999. Ecophysiological patterns of pinyon and juniper. In: Monsen SB, Stevens R, eds., Ecology and Management of Pinyon-Juniper Communities within the Interior West. Utah: Rocky Mountain Research Station (N037), USDA Forest Service, Ogden, 35–46. [Google Scholar]
- Noy-Meir I. 1973. Desert ecosystems: environment and producers. Annual Review of Ecology and Systematics 4: 25–51. doi: 10.1146/annurev.es.04.110173.000325. [DOI] [Google Scholar]
- Oddou-Muratorio S, Davi H.. 2014. Simulating local adaptation to climate of forest trees with a Physio-Demo-Genetics model. Evolutionary Applications 7: 453–467. doi: 10.1111/eva.12143. [DOI] [PMC free article] [PubMed] [Google Scholar]
- Ostonen I, Püttsepp U, Biel C, et al. 2007. Specific root length as an indicator of environmental change. Plant Biosystems 141: 426–442. [Google Scholar]
- Padilla FM, Miranda JDD, Pugnaire FI.. 2007. Early root growth plasticity in seedlings of three Mediterranean woody species. Plant and Soil 296: 103–113. [Google Scholar]
- Poorter H, Ryser P.. 2015. The limits to leaf and root plasticity: what is so special about specific root length? New Phytologist 206: 1188–1190. doi: 10.1111/nph.13438. [DOI] [PubMed] [Google Scholar]
- Poorter H, Niklas KJ, Reich PB, Oleksyn J, Poot P, Mommer L.. 2012. Biomass allocation to leaves, stems and roots: meta-analyses of interspecific variation and environmental control. New Phytologist 193: 30–50. [DOI] [PubMed] [Google Scholar]
- Pratt JD, Mooney KA.. 2013. Clinal adaptation and adaptive plasticity in Artemisia californica: implications for the response of a foundation species to predicted climate change. Global Change Biology 19: 2454–2466. doi: 10.1111/gcb.12199. [DOI] [PubMed] [Google Scholar]
- PRISM Group. 2015. PRISM climatological normal, 1981–2010. The PRISM Group, Oregon State University. [Google Scholar]
- R Core Team. 2020. R: a language and environment for statistical computing r. foundation for statistical computing version 4.0.2. https://www.R-project.org/ (8 October 2022).
- Ramírez-Valiente JA, Solé-Medina A, Pyhäjärvi T, et al. 2021. Selection patterns on early-life phenotypic traits in Pinus sylvestris are associated with precipitation and temperature along a climatic gradient in Europe. New Phytologist 229: 3009–3025. [DOI] [PubMed] [Google Scholar]
- Redmond MD, Barger NN.. 2013. Tree regeneration following drought- and insect-induced mortality in piñon–juniper woodlands. New Phytologist 200: 402–412. doi: 10.1111/nph.12366. [DOI] [PubMed] [Google Scholar]
- Redmond MD, Cobb NS, Clifford MJ, Barger NN.. 2015. Woodland recovery following drought-induced tree mortality across an environmental stress gradient. Global Change Biology 21: 3685–3695. doi: 10.1111/gcb.12976. [DOI] [PubMed] [Google Scholar]
- Rehfeldt GE, Tchebakova NM, Parfenova YI, Wykoff WR, Kuzmina NA, Milyutin LI.. 2002. Intraspecific responses to climate in Pinus sylvestris. Global Change Biology 8: 912–929. doi: 10.1046/j.1365-2486.2002.00516.x. [DOI] [Google Scholar]
- Richter S, Kipfer T, Wohlgemuth T, Calderón Guerrero C, Ghazoul J, Moser B.. 2012. Phenotypic plasticity facilitates resistance to climate change in a highly variable environment. Oecologia 169: 269–279. [DOI] [PubMed] [Google Scholar]
- Romme WH, Allen CD, Bailey JD, et al. 2009. Historical and modern disturbance regimes, stand structures, and landscape dynamics in pinon–juniper vegetation of the western United States. Rangeland Ecology & Management 62: 203–222. [Google Scholar]
- Ryel, RJ, Ivans, CY, Peek, MS, Leffler, AJ.. 2008. Functional differences in soil water pools: a new perspective on plant water use in water-limited ecosystems. In: Lüttge U, Beyschlag W, Murata J, eds. Progress in botany. Berlin: Springer, 397–422. doi: 10.1007/978-3-540-72954-9_16 [DOI] [Google Scholar]
- Sánchez-Gómez D, Majada J, Alía R, Feito I, Aranda I.. 2010. Intraspecific variation in growth and allocation patterns in seedlings of Pinus pinaster Ait. submitted to contrasting watering regimes: can water availability explain regional variation? Annals of Forest Science 67: 505–504. doi: 10.1051/forest/2010007. [DOI] [Google Scholar]
- Savolainen O, Pyhäjärvi T, Knürr T.. 2007. Gene flow and local adaptation in trees. Annual Review of Ecology, Evolution, and Systematics 38: 595–619. doi: 10.1146/annurev.ecolsys.38.091206.095646. [DOI] [Google Scholar]
- Scheiner SM. 1993. Genetics and evolution of phenotypic plasticity. Annual Review of Ecology and Systematics 24: 35–68. doi: 10.1146/annurev.es.24.110193.000343. [DOI] [Google Scholar]
- Shen Y, Umaña MN, Li W, et al. 2019. Coordination of leaf, stem and root traits in determining seedling mortality in a subtropical forest. Forest Ecology and Management 446: 285–292. doi: 10.1016/j.foreco.2019.05.032. [DOI] [Google Scholar]
- Stephenson NL. 1990. Climatic control of vegetation distribution: the role of the water balance. The American Naturalist 135: 649–670. doi: 10.1086/285067. [DOI] [Google Scholar]
- Urza AK, Weisberg PJ, Chambers JC, Sullivan BW.. 2019. Shrub facilitation of tree establishment varies with ontogenetic stage across environmental gradients. New Phytologist 223: 1795–1808. doi: 10.1111/nph.15957. [DOI] [PubMed] [Google Scholar]
- Urza AK, Weisberg PJ, Dilts T.. 2020. Evidence of widespread topoclimatic limitation for lower treelines of the Intermountain West, United States. Ecological Applications 30: e02158. [DOI] [PubMed] [Google Scholar]
- Ushio M, Fujiki Y, Hidaka A, Kitayama K.. 2015. Linkage of root physiology and morphology as an adaptation to soil phosphorus impoverishment in tropical montane forests. Functional Ecology 29: 1235–1245. doi: 10.1111/1365-2435.12424. [DOI] [Google Scholar]
- Valladares F, Sánchez-Gómez D, Zavala M.. 2006. Quantitative estimation of phenotypic plasticity: bridging the gap between the evolutionary concept and its ecological applications. Journal of Ecology 94: 1103–1116. [Google Scholar]
- Valladares F, Matesanz S, Guilhaumon F, et al. 2014. The effects of phenotypic plasticity and local adaptation on forecasts of species range shifts under climate change. Ecology Letters 17: 1351–1364. doi: 10.1111/ele.12348. [DOI] [PubMed] [Google Scholar]
- Vasey GL, Weisberg PJ, Urza AK.. 2022. Intraspecific trait variation in a dryland tree species corresponds to regional climate gradients. Journal of Biogeography 49: 2309–2320. doi: 10.1111/jbi.14515. [DOI] [Google Scholar]
- Vizcaíno-Palomar N, Fady B, Alía R, Raffin A, Mutke S, Garzón MB.. 2020. The legacy of climate variability over the last century on populations’ phenotypic variation in tree height. Science of the Total Environment 749: 141454. [DOI] [PubMed] [Google Scholar]
- Walck JL, Hidayati SN, Dixon KW, Thompson KEN, Poschlod P.. 2011. Climate change and plant regeneration from seed. Global Change Biology 17: 2145–2161. doi: 10.1111/j.1365-2486.2010.02368.x. [DOI] [Google Scholar]
- West, AG. 2006. The influence of seasonality of precipitation on transpiration in piñon–juniper woodlands. PhD Thesis, University of Utah, USA. [Google Scholar]
- Westerband AC, Funk JL, Barton KE.. 2021. Intraspecific trait variation in plants: a renewed focus on its role in ecological processes. Annals of Botany 127: 397–410. doi: 10.1093/aob/mcab011. [DOI] [PMC free article] [PubMed] [Google Scholar]
- Wickham, H. 2016. Data analysis in ggplot2: elegant graphics for data analysis. New York: Springer, 189–201. [Google Scholar]
- Withington JM, Reich PB, Oleksyn J, Eissenstat DM.. 2006. Comparisons of structure and life span in roots and leaves among temperate trees. Ecological Monographs 76: 381–397. doi: 10.1890/0012-9615(2006)076[0381:cosals]2.0.co;2. [DOI] [Google Scholar]
- Ziffer-Berger J, Weisberg PJ, Cablk ME, Osem Y.. 2014. Spatial patterns provide support for the stress-gradient hypothesis over a range-wide aridity gradient. Journal of Arid Environments 102: 27–33. doi: 10.1016/j.jaridenv.2013.11.006. [DOI] [Google Scholar]
Associated Data
This section collects any data citations, data availability statements, or supplementary materials included in this article.