

Abstract

Functionalization of thymol (Thy) on nanocarriers is a key step in achieving prolonged antimicrobial activity. This requires nanomaterials with uniform particle diameters and suitable thymol sorption. Herein, hollow carbon (HC) and SiO2-carbon core–shell (SiO2@C) were investigated due to their diverse morphologies and ease of surface modification. HC (14 ± 1 nm size) and SiO2@C (10 ± 1.5 nm size) were synthesized by the Stöber method before thymol was loaded by incipient wetness impregnation. Nanoparticle physicochemical properties were characterized by advanced techniques, including X-ray photoelectron spectroscopy (XPS) and near-edge X-ray absorption fine structure (NEXAFS). Adsorption energies of thymol on the carbon and SiO2 surfaces were elucidated by density functional theory (DFT) simulations. Moreover, the in vitro thymol release profiles and antibacterial activity were evaluated. The experimental results indicated that the oxy-carbon surface species of HC led to longer thymol release profiles than the –OH group of SiO2@C. The DFT calculations revealed that the weaker physical interaction of thymol on HC was better for drug release than that on SiO2@C. Thus, a longer thymol release profile of HC with hollow structures showed better antibacterial performance against Gram-positive bacteria Staphylococcus aureus than that of SiO2@C with core–shell structures. This work confirms the important role of carbon morphology and specific functional groups in thymol release profiles for the further development of inhibition products.
Keywords: SiO2-carbon core–shell, hollow carbon, thymol, DFT, antibacterial activity
1. Introduction
Silica (SiO2) nanoparticles have been widely used as drug-delivering materials. However, a desirable rate of drug release is difficultly controlled by using a single SiO2 support. Recently, carbon nanomaterials, including carbon nanotubes (CNTs),1 SiO2-carbon core–shell (SiO2@C),2 carbon dots (CDs),3 graphene oxide nanoblades,4 nanodarts,5 and hollow carbon (HC),6 have become preferable candidates for antibacterial applications because of their surface functional groups, intrinsic chemical inertness, and physical robustness.7 Among the different kinds of these nanosized carbons mentioned earlier, carbon-based nanospheres have drawn the most attention because their shapes and sizes can be tuned by adjusting synthesis conditions to achieve suitable drug carriers for medical and pharmaceutical applications.8−10
For instance, curcumin-derived CDs with quaternary ammonium species exhibited strong attachment to the cell membrane of the porcine epidemic diarrhea virus, resulting in a loss of integrity and death.3 Rose petal-derived CD nanocarriers with thymol reduced arthritic activity in rats.11 In addition, vancomycin-loaded HC provided better inhibition of Escherichia coli and Staphylococcus epidermidis, compared to both free vancomycin and its parent one.6 Although these carbon nanospheres show superior bacterial inhibition, their morphological effects, e.g., spheres of the same size with different structural properties and surface functionalities, have rarely been compared.
In the past, Beranová et al.12 clarified the morphological impact of diamond nanoparticles (DNPs), 5–50 nm in size, on a Gram-negative bacterium (E. coli) and a Gram-positive bacterium (Bacillus subtilis). The DNPs of 5 nm size were most effective against E. coli, while the DNPs of 18–50 nm sizes had higher antibacterial activity against B. subtilis. Norouzi et al.13 reported how size, surface chemistry, and the aggregation behavior of nanodiamonds of 18–125 nm sizes affected the inhibition of E. coli, Staphylococcus aureus, and S. epidermidis. The smallest nanodiamond at 500 μg/mL inhibited the growth of both S. aureus and S. epidermidis in a full bacterial medium. However, none of the nanodiamonds terminated the colony-forming ability of E. coli due to their low surface affinity for attachment on bacterial surfaces. Recently, Zhang et al.7 studied the effects of carbon-like diamonds (CLDs), including micro-, nano-, and ultrananocrystalline sizes, on their antibacterial activity against E. coli and B. subtilis. Among these materials, the CLD sample with microcrystalline-sized particles showed significant antibacterial activity against both E. coli and B. subtilis. Hence, this reveals that the carbon morphology influences the antibacterial properties.
Although previous research has shown that carbon nanospheres containing various antibacterial agents are active, their interfacial interactions have rarely been evaluated by a combination of experimental and theoretical methods. To the best of our knowledge, there has been no report comparing the morphological effect of carbon nanospheres with thymol on the inhibition of the same bacteria. Consequently, the aim of this work is to prepare carbon nanospheres with different morphologies, including hollow carbon and SiO2@C core–shell structures, and to modify their surfaces with thymol by incipient wetness impregnation. The adsorption of thymol on the nanosphere surfaces was confirmed with a combined experimental and density functional theory (DFT) study. In addition, both in vitro thymol release tests and antibacterial performance against S. aureus were also performed. This investigation not only demonstrates precise protocols for assessing materials with targeted adsorption properties but also provides new insights into the adsorption behavior of an alternative material for future nanocarrier applications.
2. Results and Discussion
2.1. Characterization of Carbon Nanospheres
Transmission electron microscopy (TEM) images and the particle size distributions of SiO2@C and HC are shown in Figure 1a,b, respectively. The SiO2@C core–shell is irregularly spherical, with an average particle size of 10 ± 1.5 nm (see the inset) and some agglomeration. The carbon shell of the core–shell nanosphere could be rarely observed by TEM, possibly due to its ultrathin carbon-shell thickness according to the previous observation by Niu et al.14 A hollow structure is observed for the HC nanosphere, with an average particle size of 14 ± 1 nm, corresponding to a previous report by Zhao et al.8 Comparing the carbon wall thickness, the micrographs suggested that the wall structure of HC was significantly thicker than that of the core–shell. These results confirmed that carbon nanospheres with different morphologies, including core–shell and hollow structures, were successfully prepared and ready to be used as nanocarriers by the incipient wetness impregnation of thymol.
Figure 1.

TEM image with the particle size distribution (inset) of (a) SiO2@C nanospheres and (b) hollow carbon.
X-ray diffraction (XRD) patterns of the obtained nanospheres with and without thymol are shown in Figure 2. The core–shell shows a broad peak at approximately 22°, related to a characteristic of amorphous carbon and silica.15,16 However, the XRD pattern of the HC sample shows a peak shift to ∼24°, corresponding to graphitic carbon (graphite).8 The result indicates that the HC sample achieved some carbon graphitization, while the core–shell did not, in agreement with the wall thickness in the TEM results. Additionally, the XRD patterns from both samples with thymol were similar to those of their parents, indicating the high stability of the nanosphere structures.
Figure 2.

XRD patterns of carbon nanospheres with thymol compared to those of the parents.
The N2 adsorption–desorption isotherms of all samples are shown in Figure 3. Both parent nanospheres exhibit a combined type I(b) and IV(a) isotherm according to the IUPAC classification, implying the appearance of micropores and mesopores with small external surfaces.17,18 The isotherms also show a type H4 hysteresis loop caused by micropore filling with N2 at a low relative pressure, suggesting agglomerated nanospheres of micromesoporous carbons,17 consistent with the TEM results. Remarkably, the size of the hysteresis loop from HC was larger than that from SiO2@C, implying a larger pore volume. In addition, the specific surface areas, nonlinear density functional theory (NLDFT) pore volumes, and diameters of carbon nanospheres are summarized in Table 1. The HC nanospheres had larger surface areas and pore volumes than the core–shell. However, HC had a larger pore diameter than the other samples, possibly due to the etching effect of base species during silica core removal. This result could suggest that the carbon nanospheres had distinctive surfaces and porosities and had a different mode of antibacterial activity after thymol impregnation.
Figure 3.

N2 adsorption–desorption isotherms of (a) SiO2@C nanospheres and (b) hollow carbon.
Table 1. Specific Surface Areas, NLDFT Pore Volumes, and Diameters of the Carbon Nanospheres.
| sample | specific surface areaa (m2/g) | pore volumeb (cm3/g) | pore diameterb (nm) |
|---|---|---|---|
| SiO2@C | 76 | 0.11 | 2.58 |
| HC | 405 | 1.48 | 3.79 |
Specific surface area was calculated with the Brunauer–Emmett–Teller (BET) method.
Both pore volume and diameter were evaluated with the NLDFT method.
The Fourier transform infrared (FTIR) spectra of SiO2@C and HC against their parent samples are depicted in Figure 4. SiO2@C showed vibration peaks at 1100–1080, 760, and 450 cm–1 assigned to the asymmetric and symmetric stretching and bending modes of Si–O–Si, respectively, as the characteristics of the silica core.19 After removing the silica core of HC by NaOH etching, these silica characteristics were completely invisible by FTIR, indicating the successful removal of the silica core.20,21 After the impregnation of thymol on the nanosphere surfaces, vibrational bands were observed at 1417 and 804 cm–1, related to the phenyl ring.22 This FTIR result indicated that thymol was successfully introduced onto the surfaces of the carbon-based nanospheres.
Figure 4.

FTIR spectra of SiO2@C and HC with thymol compared to those of the parents.
To further ensure the appearance of the carbon structure from both core–shell and hollow structures, the Raman spectra of the nanospheres with and without thymol loading are collected and shown in Figure 5. All samples show two intense peaks at approximately 1355 and 1600 cm–1, corresponding to the D band from structural disorder and the G band from graphitic carbon with sp3 and sp2 hybridization.23 Moreover, the intensity ratio between the D and G bands (ID/IG) can define the degree of graphitization for these carbon nanospheres.24 A comparison of both parents shows that HC has a ratio half that of SiO2@C, indicating a higher degree of graphitization.25 Interestingly, the G band from both samples with thymol shows a red shift, namely, from 1602 to 1590 cm–1 for Thy-SiO2@C and from 1605 to 1597 cm–1 for Thy-HC, possibly due to their surface interactions with thymol molecules. In addition, they had a higher ID/IG value than their parents, suggesting an increase in defect states in the sp2 graphene planes.25 Thus, the presence of thymol moieties could alter the degree of graphitization of these carbon nanospheres.
Figure 5.
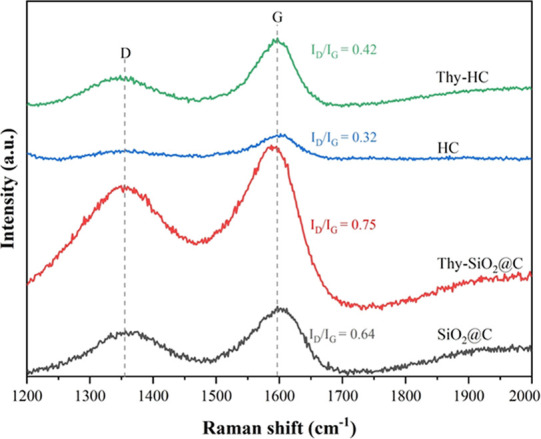
Raman spectra of carbon nanospheres with thymol compared to their parents.
To further elucidate the chemical species on the sample surfaces, XPS analysis was employed. The C 1s and O 1s XPS spectra from all samples are depicted in Figure 6a,b, respectively. The HC samples display an intense C 1s peak rather than another peak due to a thicker carbon wall and higher graphitic carbon based on the TEM and Raman results, respectively. In contrast, the O 1s peak intensity from SiO2@C is higher than that from HC, which was possibly the result of either the SiO2 core or surface oxygen species. Based on the results of deconvoluted C 1s and O 1s XPS peaks, the binding energies (BE) and peak area percentages of all surface species are summarized in Table 2. These suggested surface species on the carbon nanospheres containing C–C/C–H, C–O, C=O, and C–O–Si moieties (only belonging to SiO2@C).10,18,26,27 Satellite peaks could be found in all carbon samples. The C–O–Si and Si–O–H species from the core–shell are observed at approximately 291 and 535 eV, respectively, indicating interfacial bonding between the carbon shells and the SiO2 core.27 However, the C 1s peak area of the C–C/C–H species from HC is higher than that from the core–shell because of a higher graphitic carbon content. After thymol loading, both the C 1s and the O 1s peaks shifted slightly to higher binding energies. This could be from the interfacial interaction of thymol molecules with the sp2-hybridized carbon and available oxygen functional groups, in agreement with the Raman results. Therefore, the finding confirmed the presence of thymol molecules on the sample surfaces.
Figure 6.

XPS spectra of carbon nanospheres impregnated with thymol compared to the parent core–shells: (a) C 1s and (b) O 1s spectra.
Table 2. Comparisons of Carbon Nanospheres with and without Thymol Were Based on Binding Energies and Peak Areas from Deconvolution of the XPS Spectra.
| SiO2@C |
Thy-SiO2@C |
HC |
Thy-HC |
ref | |||||
|---|---|---|---|---|---|---|---|---|---|
| surface species | BE (eV) | area (%) | BE (eV) | area (%) | BE (eV) | area (%) | BE (eV) | area (%) | |
| C 1s | |||||||||
| C–C/C–H | 284.59 | 47.92 | 284.89 | 50.49 | 284.81 | 72.24 | 284.86 | 78.88 | (10,18,26) |
| C–O | 286.18 | 23.66 | 286.79 | 7.79 | 286.32 | 16.57 | 286.47 | 14.66 | (10,18,26) |
| C=O | 288.37 | 15.17 | 289.12 | 29.72 | 288.04 | 6.63 | 288.08 | 5.99 | (10,18,26) |
| C–O–Si/satellite | 291.31 | 13.25 | 291.10 | 12.00 | 289.56 | 4.55 | 289.67 | 4.46 | (27) |
| O 1s | |||||||||
| C=O | 530.93 | 12.74 | 530.95 | 10.12 | 531.80 | 47.40 | 531.82 | 49.97 | (10,26) |
| C–O–C/C–O–H/Si–O–Si | 532.85 | 85.99 | 533.08 | 88.87 | 533.44 | 52.60 | 533.61 | 50.03 | (10,18,26) |
| Si–O–H/adsorbed H2O | 535.38 | 1.27 | 536.32 | 1.01 | nda | nd | nd | nd | (18,26) |
nd = Not detectable.
In addition, the chemical states associated with local electronic structures were determined with NEXAFS. The C and O K-edge spectra and peak assignments for the nanospheres with and without thymol are shown in Figure 7a,b, respectively. Both core–shells show the C K-edge peaks at approximately 284 and 292 eV, corresponding to the transition states of 1s → π* (C=C)28 and 1s → σ* (C–O/C–C),29 respectively. Moreover, the peak at ∼288 eV from the 1s → π* (C=O) transition28 is from amorphous carbon.30 In comparison, the parent HC shows an intense peak at approximately 285.4 eV, assigned to the 1s → π* (C=C) transition, which originated from graphitic carbon,30 while the peak for amorphous carbon at 288 eV is rarely observed. This verified that the HC sample had graphitic carbon rather than SiO2@C. However, the amorphous carbon peak from Thy-HC increased with thymol loading. In addition, the O 1s → π* (O=C) transition of both the O K-edge peaks31 from Thy-SiO2@C and Thy-HC (see Figure 6b) increased with thymol loading. These results confirmed that thymol was located on the sample surfaces, consistent with the Raman and XPS results.
Figure 7.

NEXAFS of (a) C K-edge and (b) O K-edge spectra for SiO2@C and HC with and without thymol.
2.2. In Vitro Thymol Release Profile
The thymol release profile from both Thy-SiO2@C and Thy-HC via the in vitro method in phosphate buffer (pH 7.4) at 25 °C with different time intervals is shown in Figure 8. More interestingly, the Thy-HC sample quickly reached a cumulative thymol release of ∼70 wt % within an hour, while another sample showed approximately 40 wt %. When the release time was extended to 72 h, the obtained release from Thy-SiO2@C approached 50 wt %. The observation suggested that the hollow structure consisting of only carbon functional groups (with a higher surface area) could provide faster thymol desorption than the core–shell structure with a combination of carbon and silica species. The surface interaction and adsorption energy between the carbon nanospheres and thymol moieties were further investigated with the DFT method, and their inhibitory activity was also evaluated.
Figure 8.

Thymol release profiles for Thy-SiO2@C and Thy-HC, determined in phosphate buffer (pH 7.4) at 25 °C.
2.3. Adsorptive Interactions of Thymol on Silica and Carbon Surfaces
To confirm the behavior and/or mechanism of thymol adsorption on the HC surface, we modeled the surface of HC by the decoration of hydroxy (–OH), carbonyl (–COOH), and epoxy (-O–) groups on a graphene-like sheet in DFT calculations. The adsorption energies for thymol adsorption on each model are illustrated in Table 3. Our calculations revealed that the interactions between thymol and the carbon surfaces without functional groups involved physisorption with Eads values of −0.75 eV for the π–π interactions of the aromatic carbon surface and the six-membered ring of thymol. The distances between the thymol arene rings and the HC surfaces are approximately 2.94 and 3.34 Å, as demonstrated in Figure 9. In addition, the adsorption mechanism involving π–π interactions between the six-membered ring of thymol and the functionalized hydroxy (–OH) and epoxy (-O–) groups on the HC surfaces was found to have Eads values of −0.45 and −0.40 eV, respectively. In contrast, thymol adsorption via hydrogen bonding between the OH group of thymol and the –COOH group of HC was observed with distances of 1.91 and 2.20 Å, respectively. Moreover, we compared thymol adsorption on silica surfaces. Remarkably, SiO2 has a greater thymol adsorption strength than HC surfaces, with an adsorption energy of −0.87 eV, which is in good agreement with the thymol release profiles.
Table 3. Adsorption Energy (Eads) of Thymol, H2O, Ethanol, and Coadsorbed Thymol and Ethanol on the HC and SiO2 Surfaces.
| adsorption
energy (eV) |
|||||
|---|---|---|---|---|---|
| models | HC | COOH-HC | O-HC | OH-HC | SiO2 |
| thymol adsorption | –0.75 | –0.49 | –0.45 | –0.40 | –0.87 |
| H2O adsorption | –0.14 | –0.55 | –0.21 | –0.32 | –0.67 |
| ethanol adsorption | –0.24 | –0.61 | –0.24 | –0.23 | –0.88 |
| thymol and ethanol coadsorption | –1.22 | –1.00 | –1.04 | –1.24 | –1.61 |
Figure 9.

(a) Geometrical optimizations of thymol adsorption on the HC and SiO2 surfaces. (b) Adsorption energy diagram of thymol, H2O, ethanol, and coadsorbed thymol and ethanol on the HC and SiO2 surfaces.
Moreover, the coadsorption of thymol and ethanol was investigated to determine the effect of thymol adsorption in the presence of ethanol. The Eads values on HC are in the range of −1.00 to −1.24 eV, while the adsorption on SiO2 is found to yield −1.61 eV. The results showed that the coadsorption energy on SiO2 is higher than that on the HC surfaces, corresponding to the results of thymol adsorption. Interestingly, the coadsorption energy on either HC or SiO2 is higher than that of single-molecule adsorption due to the H-bonding interactions between thymol and ethanol.
2.4. Antibacterial Activity of Thymol-Impregnated Carbon Nanospheres
A qualitative assessment of in vitro antibacterial activity against S. aureus ATCC 25923, a Gram-positive bacterium, was performed based on measurements of the inhibition zones of the carbon nanospheres with and without thymol. The results are depicted in Figure 10 and summarized in Table 4. Both free thymol and gentamicin had wider inhibition zones against S. aureus than 95% ethanol, and the parents, SiO2@C and HC (see Figure 10c,b), were inactive. Although both the carbon nanospheres with thymol were active, the inhibition zone of Thy-HC was wider than that of Thy-SiO2@C (see Table 4). The result indicated that the carbon with a hollow structure type was a better carrier of thymol than that with a core–shell structure due to a larger surface area and suitable physisorption between thymol and the surface, based on the in vitro release profiles and the DFT study. Thymol and released thymol showed clear inhibition zones against S. aureus. This phenomenon might be due to the antibacterial mechanism of thymol that directly disrupted the outer and inner membranes as well as destabilized the DNA, leading to a depletion of protein expression and an increase in bacterial cell death.32−36 This finding confirmed that the carbon nanospheres with thymol from this work were sufficiently active against S. aureus and were comparable to carbon-based materials reported elsewhere.22,37,38 In addition, all of the results showed promising beneficial materials for wound dressing applications. However, fabrication processes as well as in vivo assessments of biocompatibility are still needed.39−42 Therefore, carbon nanospheres should be further developed and utilized in preventive healthcare and medical devices, e.g., as drug nanocarriers and inhibition products.
Figure 10.

Antibacterial performance of carbon nanospheres with and without thymol against S. aureus compared to the control. Inhibition zones with (a) thymol and 95% ethanol, (b) gentamicin, (c) SiO2@C and Thy-SiO2@C, and (d) HC and Thy-HC after 20 h of incubation.
Table 4. Diameter of Inhibition Zones Against S. aureus of Thymol, SiO2@C, and HC with and without Thymol.
| samples | diameter of inhibition zones (mm ± SD) |
|---|---|
| SiO2@C | nda |
| Thy-SiO2@C | 10.12 ± 1.06 |
| HC | nda |
| Thy-HC | 18.93 ± 0.03 |
| thymol | 23.73 ± 0.24 |
| gentamicin | 22.81 ± 0.15 |
| 95% ethanol | nda |
nd = An inhibition zone was not detectable.
3. Materials and Methods
3.1. Chemicals
All chemicals were commercially available and used as received without any purification, including 3-(aminopropyl)triethoxysilane (APTES, NH2C3H6Si(C2H5O)3, 98.0%, Sigma-Aldrich), ammonia solution (NH3.H2O, 28–30%, RANKEM), anhydrous ethanol (C2H5OH, 99.9%, RCI Labscan), anhydrous disodium hydrogen phosphate (Na2HPO4, 99.5%, EMSURE, Merck), Brij56 ((C2H4O)n.C16H34O, molecular weight 623, Spectrum Chemical MFG Corp), cyclohexane (C6H12, 99%, Sigma-Aldrich), ethylene carbonate ((CH2O)2CO, 99.0%, TCI), isopropanol (C3H7OH, 99.8%, Fisher Chemical), orthophosphoric acid (H3PO4, 85%, LobaChemie Pvt. Ltd.), potassium chloride (KCl, 99.5%, EMSURE, Merck), potassium dihydrogen phosphate (KH2PO4, 99.5%, EMSURE ISO, Merck), sodium chloride (NaCl, 99.5%, EMSURE ACS, ISO, Merck), sodium hydroxide pellets (NaOH, 99.0%, EMSURE, Merck), sulfuric acid (H2SO4, 98%, RCI Labscan), tetraethyl orthosilicate (TEOS, Si(OC2H5)4, 98%, Thermo Scientific), and thymol (C10H14O, 98.0%, TCI).
3.2. Nanosphere Synthesis and Incipient Wetness Impregnation with Thymol
A nanosized SiO2@C core–shell was synthesized using the 20 v/v % ethanol solution, as described in detail from our previous report.2 The as-prepared HC sample was synthesized according to a previous report.8 Brij56 (2.12 g) and cyclohexane (7.5 mL) were stirred at a rate of 400 rpm at 50 °C in a two-neck round-bottom flask equipped with a condenser. After a clear solution was obtained, deionized water (0.2 mL) was injected under stirring. Ammonia solution (0.57 mL) and TEOS (0.2 mL) were added in sequence, and the mixture was stirred for another 2 h. APTES (50 μL) was then injected into the clear solution, and the mixture was stirred overnight. To prepare a resin precursor, resorcinol (0.25 g), formaldehyde (0.35 mL), and ethanol (3 mL) were mixed and stirred for 10 min at room temperature. The resin precursor (1 mL) and ammonia solution (0.8 mL) were then added dropwise, and the mixture was further stirred for 24 h at 50 °C. Subsequently, TEOS (2 mL) was slowly dropped to the suspension, and the mixture was stirred for another 12 h. The obtained dark brown resultant was centrifuged, washed with 2-propanol and water, and freeze-dried in a CHRIST laboratory freeze-dryer at −60 °C for 24 h. The obtained powder was carbonized with a Nabertherm high-temperature tube furnace at 600 °C for 3 h with a N2 flow rate of 10 mL/min. Finally, the resulting black powder was etched with 2 M NaOH (50 mL) at 50 °C for 24 h to remove silica. The black resultant mixture was washed with water and freeze-dried at −60 °C for 24 h.
Incipient wetness impregnation of HC and SiO2@C core–shell with thymol (Thy) solution (10 g/L) was carried out according to our previous literature.2 The HC and SiO2@C samples impregnated with thymol were called Thy-HC and Thy-SiO2@C, respectively.
3.3. Material Characterization
The shape and particle size were measured by high-resolution transmission electron microscopy (JEM 2100, JEOL) at a voltage of 200 kV. Structural characteristics based on X-ray diffraction (XRD) patterns were obtained with a Bruker D8 advanced X-ray diffractometer using Cu Kα radiation operating at a voltage of 40 kV and a current of 40 mA. The specific surface area, pore volume, and diameter were measured by nitrogen sorption with a NOVA e-Series instrument operating at −196 °C. The predried sample powder was degassed at 250 °C for 3 h. The specific surface area and pore size were calculated with the Brunauer–Emmett–Teller (BET) method, and the volume was calculated with nonlinear density functional theory (NLDFT) methods.
The functional groups of all of the samples were analyzed by an NT-MDT confocal Raman spectrometer using an excitation wavelength of 633 nm, ranging from 50 to 2000 cm–1 with a scan number of 12 and a scan rate of 10 s/scan. At beamline BL5.3 (SLRI-NANOTEC-SUT), X-ray photoelectron spectroscopy (XPS) was used to identify surface species using a ULVAC-PHI PHI5000 VersaProbe II with Al Kα radiation. The XPS spectra were performed with CasaXPS software and calibrated with the C 1s peak at 284.8 eV. The XPS peak deconvolution was obtained using Shirley background subtraction and Gaussian–Lorentzian line shape combinations. At beamline BL3.2 in the partial electron yield mode, chemical states were studied by near-edge X-ray absorption fine structure (NEXAFS). Highly oriented pyrolytic graphite was used to calibrate the K-edge spectra of both C and O atoms. Both beamlines were at the Synchrotron Light Research Institute, Nakhon Ratchasima, Thailand.
3.4. In Vitro Thymol Release Study
An in vitro thymol release study of the prepared nanospheres was performed with the method from our recent work.2 In brief, 66.7 w/v % of the sample in the mixed solution of phosphate-buffered saline (PBS, pH ∼ 7.4) and 40 v/v % ethanol was shaken at 25 °C with various operation times. Finally, the releasing thymol in the filtered solution was analyzed by using a PerkinElmer Lambda 650 UV–vis spectrophotometer at a wavelength of 275 nm. The cumulative thymol release (wt %) was obtained from eq 1.
| 1 |
3.5. DFT Method and Models
DFT calculations were performed with the Vienna ab initio simulation package (VASP). The electron exchange–correlation was represented by the Perdew–Burke–Ernzerhof (PBE) functional with generalized gradient approximation (GGA).44 The interaction between ion cores and valence electrons was assigned by the projector augmented wave (PAW) method,45 and we used Grimme’s dispersion correction (DFT-D3)46 to account for the van der Waals force. The kinetic energy cutoff for plane wave expansions was set to 450 eV, and the reciprocal space was sampled by using 3 × 3 × 1 k-point grids in Monkhorst–Pack meshes for structural optimization. The convergence criteria were 1 × 10⁻⁵ eV energy differences for the electronic wave function for structure optimization calculations. All atomic coordinates were converged to within 0.02 eV/Å for the maximal components of forces.
We modeled a 7 × 7 supercell lattice of a hollow carbon structure containing 98 carbon atoms called hollow carbon (graphene-like sheet). As seen in Figure 9, the optimized lattice parameters were a = b = 2.46 Å, corresponding to the experimental values.47 To simulate the surface of the HC model, functional groups such as hydroxy (–OH), carbonyl (–COOH), and epoxy (–O–) were applied to the graphene-like sheet. The structure of the bulk SiO2 was also simulated. Then, the SiO2 (001) plane was sequentially modeled by a 2 × 2 periodic supercell (80 atoms) composed of a two-layer slab to represent a silica surface. The vacuum space was set to 15 Å to separate the layers and prevent interaction between the layers. The adsorption energy (Eads) of thymol was computed from eq 2.
| 2 |
where Ecomplex is the energy of the adsorption complex. Esubstrate and EThy are the energies of the substrate and the individually adsorbed thymol, respectively. A higher negative value of Eads indicates stronger thymol adsorption.
3.6. In Vitro Antibacterial Activity Assays
In vitro antibacterial activity assays by the Kirby–Bauer disk diffusion susceptibility test method49 against S. aureus ATCC 25923 as a Gram-positive bacterium was studied using a procedure from our recent report.2 The S. aureus suspension was spread onto Mueller–Hinton agar (Difco). The solution of thymol in ethanol (6 w/v %) was dropped into a sterile paper disk (Sigma-Aldrich) with a 6 mm diameter. Ethanol was dropped onto a paper disk as the control. A standard gentamicin disk (BD BBL) was used as a positive control. These prepared disks were placed on an inoculated agar plate and kept at 37 °C for 20 h. After the course of testing, the obtained inhibition zones were determined with a Mitutoyo Vernier caliper.
4. Conclusions
Carbon nanospheres with different morphologies, including hollow and core–shell structures, were successfully prepared and modified with thymol by incipient wetness impregnation. Hollow carbon (HC, 14 ± 1 nm) had a larger surface area and a higher degree of graphitization than core–shell carbon (SiO2@C, 10 ± 1.5 nm). In the in vitro thymol release test, HC showed 70 wt % release within an hour, while the rest approached 50 wt % at 72 h. The DFT studies revealed that the weak physisorption of the thymol moiety on the HC surface resulted in faster and easier desorption. Remarkably, thymol-containing HC exhibited a better inhibitory behavior against S. aureus than the other thymol additives. Therefore, carbon nanospheres are promising candidates for inhibition products for medical and pharmaceutical applications.
Author Contributions
Conceptualization: S.S. and P.K.; methodology: N.S., J.P., N.Y., and Y.S.; software: S.Y. and S.N.; validation: N.S., J.P., N.Y., S.N., Y.S., W.W., S.S., and P.K.; formal analysis: N.S., J.P., and N.Y.; investigation: S.N., W.W., T.B., S.S., and P.K.; resources: H.N. and R.S.; data curation: N.S., J.P., S.Y., T.B., H.N., and R.S.; writing—original draft preparation: N.S., J.P., and N.Y.; writing—review and editing: S.N., W.W., S.S., and P.K.; visualization: N.S., J.P., N.Y., Y.S., and S.Y.; supervision: S.S. and P.K.; project administration: S.S. and P.K.; and funding acquisition: S.S. and P.K. All authors have read and agreed to the published version of the manuscript.
This research is funded by the Thailand Science Research and Innovation Fund Chulalongkorn University [BCG66330002], the National Nanotechnology Center [Grant No. P2151026], and the NSRF via the Program Management Unit for Human Resources & Institutional Development, Research and Innovation (PMU-B) [Grant No. B01F640054].
The authors declare no competing financial interest.
References
- Koch C.; Reichling J.; Schneele J.; Schnitzler P. Inhibitory effect of essential oils against herpes simplex virus type 2. Phytomedicine 2008, 15 (1–2), 71–78. 10.1016/j.phymed.2007.09.003. [DOI] [PubMed] [Google Scholar]
- Khemthong P.; Phanthasri J.; Youngjan S.; Wanmolee W.; Samun Y.; Sosa N.; Rungnim C.; Kraithong W.; Sangkhun W.; Parnthong J.; Butburee T.; Thanee K.; Nakajima H.; Supruangnet R.; Towiwat P.; Chanvorachote P.; Sukrong S. Effect of the ethanol-to-water ratio on the properties of silica–carbon core–shell materials for prolonged antibacterial activity of thymol. Appl. Surf. Sci. 2023, 635, 157716 10.1016/j.apsusc.2023.157716. [DOI] [Google Scholar]
- Ting D.; Dong N.; Fang L.; Lu J.; Bi J.; Xiao S.; Han H. Multisite inhibitors for enteric coronavirus: antiviral cationic carbon dots based on curcumin. ACS Appl. Nano Mater. 2018, 1 (10), 5451–5459. 10.1021/acsanm.8b00779. [DOI] [PubMed] [Google Scholar]
- Akhavan O.; Ghaderi E. Toxicity of graphene and graphene oxide nanowalls against bacteria. ACS Nano 2010, 4 (10), 5731–5736. 10.1021/nn101390x. [DOI] [PubMed] [Google Scholar]
- Liu S.; Wei L.; Hao L.; Fang N.; Chang M. W.; Xu R.; Yang Y.; Chen Y. Sharper and faster “nano darts” kill more bacteria: A study of antibacterial activity of individually dispersed pristine single-walled carbon nanotube. ACS Nano 2009, 3 (12), 3891–3902. 10.1021/nn901252r. [DOI] [PubMed] [Google Scholar]
- Ahmad Nor Y.; Zhang H.; Purwajanti S.; Song H.; Meka A. K.; Wang Y.; Mitter N.; Mahony D.; Yu C. Hollow mesoporous carbon nanocarriers for vancomycin delivery: understanding the structure–release relationship for prolonged antibacterial performance. J. Mater. Chem. B 2016, 4 (43), 7014–7021. 10.1039/C6TB01778A. [DOI] [PubMed] [Google Scholar]
- Zhang R.; Zheng Y.; Liu J.; Li C.; Chen C.; Hu X.; Li J.; Liu R.; Ye H. Morphology-dependent antibacterial properties of diamond coatings. Funct. Diamond 2022, 2 (1), 204–214. 10.1080/26941112.2022.2157225. [DOI] [Google Scholar]
- Zhao H.; Zhang F.; Zhang S.; He S.; Shen F.; Han X.; Yin Y.; Gao C. Scalable synthesis of sub-100 nm hollow carbon nanospheres for energy storage applications. Nano Res. 2018, 11 (4), 1822–1833. 10.1007/s12274-017-1800-3. [DOI] [Google Scholar]
- Zhang S.; Guan L.; Jiang Y.; Zhao F.; Zhou X.; Liu Z. Resolving structure dimension for SiO2@C Core-shell nanoparticles by three-step modeling of ellipsometry. Mater. Sci. Eng., B 2022, 286, 116040 10.1016/j.mseb.2022.116040. [DOI] [Google Scholar]
- Jiang Y.; Wen J.; Ding Z.; Ren Y.; Liu Z.; Chen X.; Zhou X. Li+ storage properties of SiO2@C core-shell submicrosphere and its hollow counterpart synthesized by molecular self-assembly in wet-chemistry condition as anodes for LIBs. J. Alloys Compd. 2021, 861, 157932 10.1016/j.jallcom.2020.157932. [DOI] [Google Scholar]
- Murugesan S.; Srinivasan V.; Lakshmanan D. K.; Venkateswaran M. R.; Jayabal S.; Muthukumar Nadar M. S. A.; Kathiravan A.; Asha Jhonsi M.; Thilagar S.; Periyasamy S. Evaluation of the anti-rheumatic properties of thymol using carbon dots as nanocarriers on FCA induced arthritic rats. Food Funct. 2021, 12 (11), 5038–5050. 10.1039/D1FO00471A. [DOI] [PubMed] [Google Scholar]
- Beranová J.; Seydlová G.; Kozak H.; Benada O.; Fišer R.; Artemenko A.; Konopásek I.; Kromka A. Sensitivity of bacteria to diamond nanoparticles of various size differs in gram-positive and gram-negative cells. FEMS Microbiol. Lett. 2014, 351 (2), 179–186. 10.1111/1574-6968.12373. [DOI] [PubMed] [Google Scholar]
- Norouzi N.; Ong Y.; Damle V. G.; Habibi Najafi M. B.; Schirhagl R. Effect of medium and aggregation on antibacterial activity of nanodiamonds. Mater. Sci. Eng., C 2020, 112, 110930 10.1016/j.msec.2020.110930. [DOI] [PubMed] [Google Scholar]
- Niu D.; Ma Z.; Li Y.; Shi J. Synthesis of core–shell structured dual-mesoporous silica spheres with tunable pore size and controllable shell thickness. J. Am. Chem. Soc. 2010, 132 (43), 15144–15147. 10.1021/ja1070653. [DOI] [PubMed] [Google Scholar]
- Autthawong T.; Namsar O.; Yu A.; Sarakonsri T. Cost-effective production of SiO2/C and Si/C composites derived from rice husk for advanced lithium-ion battery anodes. J. Mater. Sci.: Mater. Electron. 2020, 31 (12), 9126–9132. 10.1007/s10854-020-03442-3. [DOI] [Google Scholar]
- Pimsuta M.; Sosa N.; Deekamwong K.; Keawkumay C.; Thathong Y.; Rakmae S.; Junpirom S.; Prayoonpokarach S.; Wittayakun J. Charcoal and wood vinegar from pyrolysis of lead tree wood and activated carbon from physical activation. Suranaree J. Sci. Technol. 2018, 25 (2), 177–190. [Google Scholar]
- Thommes M.; Kaneko K.; Neimark A. V.; Olivier J. P.; Rodriguez-Reinoso F.; Rouquerol J.; Sing K. S. W. Physisorption of gases, with special reference to the evaluation of surface area and pore size distribution (IUPAC Technical Report). Pure Appl. Chem. 2015, 87 (9–10), 1051–1069. 10.1515/pac-2014-1117. [DOI] [Google Scholar]
- Sosa N.; Chanlek N.; Wittayakun J. Facile ultrasound-assisted grafting of silica gel by aminopropyltriethoxysilane for aldol condensation of furfural and acetone. Ultrason. Sonochem. 2020, 62, 104857 10.1016/j.ultsonch.2019.104857. [DOI] [PubMed] [Google Scholar]
- Wang H.; Zhang C.; Zhou B.; Zhang Z.; Shen J.; Du A. Ultra-black carbon@silica core-shell aerogels with controllable electrical conductivities. Adv. Compos. Hybrid Mater. 2019, 2 (4), 743–752. 10.1007/s42114-019-00123-6. [DOI] [Google Scholar]
- Gao X.; Hai X.; Baigude H.; Guan W.; Liu Z. Fabrication of functional hollow microspheres constructed from MOF shells: Promising drug delivery systems with high loading capacity and targeted transport. Sci. Rep. 2016, 6 (1), 37705 10.1038/srep37705. [DOI] [PMC free article] [PubMed] [Google Scholar]
- Mousavi S.; Naeimi H.; Ghasemi A. H.; Kermanizadeh S. Nickel ferrite nanoparticles doped on hollow carbon microspheres as a novel reusable catalyst for synthesis of N-substituted pyrrole derivatives. Sci. Rep. 2023, 13 (1), 10840 10.1038/s41598-023-37817-3. [DOI] [PMC free article] [PubMed] [Google Scholar]
- Chen Y.; Qiu Y.; Chen W.; Wei Q. Electrospun thymol-loaded porous cellulose acetate fibers with potential biomedical applications. Mater. Sci. Eng., C 2020, 109, 110536 10.1016/j.msec.2019.110536. [DOI] [PubMed] [Google Scholar]
- Gouadec G.; Colomban P. Raman spectroscopy of nanomaterials: How spectra relate to disorder, particle size and mechanical properties. Prog. Cryst. Growth Charact. Mater. 2007, 53 (1), 1–56. 10.1016/j.pcrysgrow.2007.01.001. [DOI] [Google Scholar]
- Baldan M. R.; Almeida E. C.; Azevedo A. F.; Gonçalves E. S.; Rezende M. C.; Ferreira N. G. Raman validity for crystallite size La determination on reticulated vitreous carbon with different graphitization index. Appl. Surf. Sci. 2007, 254 (2), 600–603. 10.1016/j.apsusc.2007.06.038. [DOI] [Google Scholar]
- Madhusha C.; Jayasundara T.; Munaweera I.; Perera C.; Wijesinghe G.; Weerasekera M.; Sandaruwan C.; Meiyazhagan A.; Robles Hernandez F. C.; Ajayan P. M.; Kottegoda N. Synthesis and structural characterization of copper nanoparticles doped activated carbon derived from coconut coir for drinking water purification. Mater. Today Chem. 2023, 27, 101312 10.1016/j.mtchem.2022.101312. [DOI] [Google Scholar]
- Ganiyu S. O.; de Araújo M. J. G.; de Araújo Costa E. C. T.; Santos J. E. L.; dos Santos E. V.; Martínez-Huitle C. A.; Pergher S. B. C. Design of highly efficient porous carbon foam cathode for electro-Fenton degradation of antimicrobial sulfanilamide. Appl. Catal., B 2021, 283, 119652 10.1016/j.apcatb.2020.119652. [DOI] [Google Scholar]
- Dutta D. P.; Nath S. Low cost synthesis of SiO2/C nanocomposite from corn cobs and its adsorption of uranium (VI), chromium (VI) and cationic dyes from wastewater. J. Mol. Liq. 2018, 269, 140–151. 10.1016/j.molliq.2018.08.028. [DOI] [Google Scholar]
- Sedlmair J.; Gleber S.-C.; Peth C.; Mann K.; Niemeyer J.; Thieme J. Characterization of refractory organic substances by NEXAFS using a compact X-ray source. J. Soils Sediments 2012, 12 (1), 24–34. 10.1007/s11368-011-0385-9. [DOI] [Google Scholar]
- Siriwardane I. W.; Udangawa R.; de Silva R. M.; Kumarasinghe A. R.; Acres R. G.; Hettiarachchi A.; Amaratunga G. A. J.; de Silva K. M. N. Synthesis and characterization of nano magnesium oxide impregnated granular activated carbon composite for H2S removal applications. Mater. Des. 2017, 136, 127–136. 10.1016/j.matdes.2017.09.034. [DOI] [Google Scholar]
- Lenardi C.; Piseri P.; Briois V.; Bottani C. E.; Bassi A. L.; Milani P. Near-edge X-ray absorption fine structure and Raman characterization of amorphous and nanostructured carbon films. J. Appl. Phys. 1999, 85 (10), 7159–7167. 10.1063/1.370527. [DOI] [Google Scholar]
- Holburg J.; Müller M.; Mann K.; Wild P.; Eusterhues K.; Thieme J. High-resolution table-top NEXAFS spectroscopy. Anal. Chem. 2022, 94 (8), 3510–3516. 10.1021/acs.analchem.1c04374. [DOI] [PubMed] [Google Scholar]
- Cabeen M. T.; Jacobs-Wagner C. Bacterial cell shape. Nat. Rev. Microbiol. 2005, 3 (8), 601–610. 10.1038/nrmicro1205. [DOI] [PubMed] [Google Scholar]
- Qiu J.; Wang D.; Xiang H.; Feng H.; Jiang Y.; Xia L.; Dong J.; Lu J.; Yu L.; Deng X. Subinhibitory concentrations of thymol reduce enterotoxins A and B and α-hemolysin production in Staphylococcus aureus isolates. PLoS One 2010, 5 (3), e9736 10.1371/journal.pone.0009736. [DOI] [PMC free article] [PubMed] [Google Scholar]
- Wang L.-H.; Zhang Z.-H.; Zeng X.-A.; Gong D.-M.; Wang M.-S. Combination of microbiological, spectroscopic and molecular docking techniques to study the antibacterial mechanism of thymol against Staphylococcus aureus: membrane damage and genomic DNA binding. Anal. Bioanal. Chem. 2017, 409 (6), 1615–1625. 10.1007/s00216-016-0102-z. [DOI] [PubMed] [Google Scholar]
- Zhou W.; Wang Z.; Mo H.; Zhao Y.; Li H.; Zhang H.; Hu L.; Zhou X. Thymol mediates bactericidal activity against Staphylococcus aureus by targeting an aldo–keto reductase and consequent depletion of NADPH. J. Agric. Food Chem. 2019, 67 (30), 8382–8392. 10.1021/acs.jafc.9b03517. [DOI] [PubMed] [Google Scholar]
- Valliammai A.; Selvaraj A.; Yuvashree U.; Aravindraja C.; Karutha Pandian S. sarA-dependent antibiofilm activity of thymol enhances the antibacterial efficacy of rifampicin against Staphylococcus aureus. Front. Microbiol. 2020, 11, 1744 10.3389/fmicb.2020.01744. [DOI] [PMC free article] [PubMed] [Google Scholar]
- Milovanovic S.; Markovic D.; Aksentijevic K.; Stojanovic D. B.; Ivanovic J.; Zizovic I. Application of cellulose acetate for controlled release of thymol. Carbohydr. Polym. 2016, 147, 344–353. 10.1016/j.carbpol.2016.03.093. [DOI] [PubMed] [Google Scholar]
- Sotelo-Boyás M.; Correa-Pacheco Z.; Bautista-Baños S.; Gómez y Gómez Y. Release study and inhibitory activity of thyme essential oil-loaded chitosan nanoparticles and nanocapsules against foodborne bacteria. Int. J. Biol. Macromol. 2017, 103, 409–414. 10.1016/j.ijbiomac.2017.05.063. [DOI] [PubMed] [Google Scholar]
- García-Salinas S.; Gámez E.; Asín J.; de Miguel R.; Andreu V.; Sancho-Albero M.; Mendoza G.; Irusta S.; Arruebo M. Efficiency of antimicrobial electrospun thymol-loaded polycaprolactone mats in vivo. ACS Appl. Bio Mater. 2020, 3 (5), 3430–3439. 10.1021/acsabm.0c00419. [DOI] [PubMed] [Google Scholar]
- Ahmady A. R.; Razmjooee K.; Saber-Samandari S.; Toghraie D. Fabrication of chitosan-gelatin films incorporated with thymol-loaded alginate microparticles for controlled drug delivery, antibacterial activity and wound healing: In-vitro and in-vivo studies. Int. J. Biol. Macromol. 2022, 223, 567–582. 10.1016/j.ijbiomac.2022.10.249. [DOI] [PubMed] [Google Scholar]
- Zhang S.; Yang Z.; Hao J.; Ding F.; Li Z.; Ren X. Hollow nanosphere-doped bacterial cellulose and polypropylene wound dressings: Biomimetic nanocatalyst mediated antibacterial therapy. Chem. Eng. J. 2022, 432, 134309 10.1016/j.cej.2021.134309. [DOI] [Google Scholar]
- Qu X.; Gao C.; Fu L.; Chu Y.; Wang J.-H.; Qiu H.; Chen J. Positively charged carbon dots with antibacterial and antioxidant dual activities for promoting infected wound healing. ACS Appl. Mater. Interfaces 2023, 15 (15), 18608–18619. 10.1021/acsami.2c21839. [DOI] [PubMed] [Google Scholar]
- Perdew J. P.; Burke K.; Ernzerhof M. Generalized gradient approximation made simple. Phys. Rev. Lett. 1996, 77 (18), 3865–3868. 10.1103/PhysRevLett.77.3865. [DOI] [PubMed] [Google Scholar]
- Kresse G.; Joubert D. From ultrasoft pseudopotentials to the projector augmented-wave method. Phys. Rev. B 1999, 59 (3), 1758–1775. 10.1103/PhysRevB.59.1758. [DOI] [Google Scholar]
- Grimme S.; Antony J.; Ehrlich S.; Krieg H. A consistent and accurate ab initio parametrization of density functional dispersion correction (DFT-D) for the 94 elements H-Pu. J. Chem. Phys. 2010, 132 (15), 154104 10.1063/1.3382344. [DOI] [PubMed] [Google Scholar]
- Elias D. C.; Nair R. R.; Mohiuddin T. M. G.; Morozov S. V.; Blake P.; Halsall M. P.; Ferrari A. C.; Boukhvalov D. W.; Katsnelson M. I.; Geim A. K.; Novoselov K. S. Control of graphene’s properties by reversible hydrogenation: Evidence for graphane. Science 2009, 323 (5914), 610–613. 10.1126/science.1167130. [DOI] [PubMed] [Google Scholar]
- Balouiri M.; Sadiki M.; Ibnsouda S. K. Methods for in vitro evaluating antimicrobial activity: A review. J. Pharm. Anal. 2016, 6 (2), 71–79. 10.1016/j.jpha.2015.11.005. [DOI] [PMC free article] [PubMed] [Google Scholar]