

Abstract
Belantamab mafodotin, a monomethyl auristatin F (MMAF)–containing monoclonal antibody‐drug conjugate (ADC), demonstrated deep and durable responses in the DRiving Excellence in Approaches to Multiple Myeloma (DREAMM)‐1 and pivotal DREAMM‐2 studies in patients with relapsed/refractory multiple myeloma. As with other MMAF‐containing ADCs, ocular adverse events were observed. To predict the effects of belantamab mafodotin dosing regimens and dose‐modification strategies on efficacy and ocular safety end points, DREAMM‐1 and DREAMM‐2 data across a range of doses were used to develop an integrated simulation framework incorporating two separate longitudinal models and the published population pharmacokinetic model. A concentration‐driven tumor growth inhibition model described the time course of serum M‐protein concentration, a measure of treatment response, whereas a discrete time Markov model described the time course of ocular events graded with the GSK Keratopathy and Visual Acuity scale. Significant covariates included baseline β2‐microglobulin on growth rate, baseline M‐protein on kill rate, extramedullary disease on the effect compartment rate constant, and baseline soluble B cell maturation antigen on maximal effect. Efficacy and safety end points were simulated for various doses with dosing intervals of 1, 3, 6, and 9 weeks and various event‐driven dose‐modification strategies. Simulations predicted that lower doses and longer dosing intervals were associated with lower probability and lower overall time with Grade 3+ and Grade 2+ ocular events compared with the reference regimen (2.5 mg/kg every 3 weeks), with a less‐than‐proportional reduction in efficacy. The predicted improved benefit–risk profiles of certain dosing schedules and dose modifications from this integrated framework has informed trial designs for belantamab mafodotin, supporting dose‐optimization strategies.
Study Highlights.
WHAT IS THE CURRENT KNOWLEDGE ON THE TOPIC?
In the DRiving Excellence in Approaches to Multiple Myeloma (DREAMM‐1) and DREAMM‐2 clinical trials, belantamab mafodotin demonstrated deep and durable clinical responses in patients with relapsed/refractory multiple myeloma, but ocular adverse events were observed.
WHAT QUESTION DID THIS STUDY ADDRESS?
What belantamab mafodotin dose, schedule, and dose‐modification strategies could potentially improve in the ocular safety profile without compromising efficacy compared with the approved regimen of 2.5 mg/kg every 3 weeks?
WHAT DOES THIS STUDY ADD TO OUR KNOWLEDGE?
A simulation framework integrating efficacy (including related dropout), ocular safety (including related dose modifications), and pharmacokinetic data predicted that lower doses of belantamab mafodotin, longer time between doses, or a different dose‐modification algorithm could provide an improved benefit–risk profile compared with the approved regimen.
HOW MIGHT THIS CHANGE DRUG DISCOVERY, DEVELOPMENT, AND/OR THERAPEUTICS?
This robust framework addressed the complex interplay between patient characteristics, pharmacokinetics, and efficacy and safety end points and allowed for simulations with dose modification. This framework concept can be applied to other drugs, end points, and clinical settings to support dose optimization and justification in an integrated benefit–risk evaluation.
INTRODUCTION
Multiple myeloma (MM) is the second most common hematological malignancy and involves the proliferation of terminally differentiated plasma cells. 1 , 2 There remains significant unmet need for new classes of treatment with novel mechanisms of action for patients with relapsed/refractory MM (RRMM). 3 Belantamab mafodotin (GSK2857916) is a first‐in‐class B cell maturation antigen (BCMA)–targeted monoclonal antibody conjugated to the microtubule‐disrupting agent monomethyl auristatin F (MMAF). 4 This antibody‐drug conjugate (ADC) selectively binds to the BCMA receptor and eliminates MM cells via a multimodal mechanism of action, including the delivery of the cytotoxin cysteine‐maleimidocaproyl MMAF (cys‐mcMMAF) directly into MM cells as well as the antibody‐dependent cellular cytotoxicity and antibody‐dependent cellular phagocytosis processes. 4
The safety and efficacy of single‐agent belantamab mafodotin was assessed in the phase I DRiving Excellence in Approaches to Multiple Myeloma (DREAMM)‐1 study (0.03–4.6 mg/kg by intravenous infusion every 3 weeks [q3w]) and pivotal phase II DREAMM‐2 study (2.5 and 3.4 mg/kg q3w) in patients with RRMM. In both studies, patients demonstrated rapid, deep, and durable responses to treatment, 5 , 6 , 7 , 8 with 31 of 97 patients who received belantamab mafodotin 2.5 mg/kg in DREAMM‐2 achieving an overall response with a median follow‐up time of 12.4 months. 8
Adverse events (AEs) affecting the cornea are expected with MMAF‐containing ADCs; a systematic review showed similar rates of ocular AEs across 13 ADCs targeting 11 unique antigens. 9 These ocular AEs included keratitis, dry eye, corneal microcysts, corneal inclusions, conjunctivitis, and unspecified keratopathy, with blurry vision as the most frequently reported symptom (in 10 of 22 studies). 9 In DREAMM‐2, ocular AEs were graded using the prespecified GSK scale, later renamed to the Keratopathy and Visual Acuity (KVA) scale, which focused on corneal examination findings and changes in best‐corrected visual acuity (BCVA). 10 In patients receiving belantamab mafodotin at 2.5 mg/kg q3w, keratopathy was the most common Grade 3 AE (27%), with lower incidences of ocular symptoms such as blurred vision (4%) and dry eye (1%). 7
Modeling and simulation approaches can incorporate the totality of available evidence from clinical trials to evaluate the efficacy/safety profile and inform future drug development. 11 Moreover, regulators are focused on reforming the dose‐optimization and dose‐selection paradigms in oncology to ensure patients in registrational clinical trials receive optimal drug doses. Selection of dosing regimen(s) should leverage relevant nonclinical and clinical data, population PK approaches, and dose–response and exposure–response relationships for efficacy, safety, and tolerability, as emphasized in the draft guidance released by the US Food and Drug Administration (FDA) in January 2023 as part of Project Optimus. 12
The objective of this work was to develop an integrated framework to enable prediction of the effect of different belantamab mafodotin dosing regimens and dose‐modification algorithms on efficacy and ocular safety to inform trial design for dose optimization. Two separate longitudinal models were developed to evaluate efficacy and safety outcomes following treatment, incorporating the previously published model describing belantamab mafodotin PK. 13 A longitudinal concentration‐driven tumor growth inhibition (TGI) model 14 was used to describe the time course of serum myeloma protein (M‐protein) concentrations. 14 Serum M‐protein concentration is a marker of tumor burden in patients with MM 14 and is used to assess treatment response based on the International Myeloma Working Group (IMWG) Uniform Response Criteria for MM. 1 A discrete time Markov model (DTMM) was used to describe the concentration effects of belantamab mafodotin on the time course of ocular event grades, including repeated events. 15 The PK, safety, and efficacy models were integrated into a simulation platform that accounted for dose modification based on ocular event grade and treatment discontinuation attributed to progressive disease. The simulation platform was used to simulate efficacy/safety profiles, which informed the design of current and future clinical trials of belantamab mafodotin in new indications and combinations, as part of a model‐informed drug discovery and development strategy 16 to identify regimens that minimize the frequency and severity of ocular events while maintaining high efficacy and treatment benefit for patients with RRMM.
METHODS
Data sources
Serum M‐protein concentration data from DREAMM‐1 and DREAMM‐2 were used to build a longitudinal efficacy model. M‐protein assessments were conducted q3w, and patients who were followed for M‐protein and had baseline concentrations ≥5 g/L were included in the model.
Data from DREAMM‐2 only were used in development of the ocular events model, where events were graded using the prespecified KVA scale. 7 Data from DREAMM‐1 were not included in this model because ocular AEs were graded using the National Cancer Institute Common Terminology Criteria for Adverse Events (Version 4.0). 5 The KVA scale was developed subsequently, and some of the data required to derive KVA grade were not collected in DREAMM‐1. In DREAMM‐2, corneal examinations and BCVA assessments were conducted q3w before dosing, and a combined ocular event grade was assigned using the KVA scale (graded 1–4, with Grade 1 being the least severe and Grade 4 the most severe; a Grade 0 was imputed for assessments with no findings). In the study, belantamab mafodotin dosing was held in cases of Grade 2 ocular events and resumed upon resolution; dosing was held following Grade 3 ocular events and resumed at 25% reduced dose upon resolution (Grade ≤ 1) or restarted at the same dose if already receiving the lowest permitted dose (1.9 mg/kg q3w). Belantamab mafodotin dosing was stopped in cases of Grade 4 ocular events, resuming only when the treating physician and ophthalmologist agreed. If no ocular events of any grade were observed by the Cycle 4 examination, the interval between ophthalmic examinations increased to 3 months.
Longitudinal efficacy and safety models
A two‐compartment model of population PK for belantamab mafodotin 13 was used with updated parameter estimates based on data available as of December 2019 (Table S1) to derive individual concentration–time profiles for each patient. The parameters used in the M‐protein and ocular events models are shown in Table 1, and the schematics for the M‐protein and ocular events models and the integrated framework are shown in Figure 1.
TABLE 1.
M‐protein longitudinal model and ocular events DTMM parameters.
| M‐protein model fixed‐effects parameter | Estimate (95% CI) | DTMM parameter | Estimate (95% CI) |
|---|---|---|---|
| TVKGR, day−1 | 0.0174 (0.0146, 0.0208) |
Transition parameter a B01 |
−2.71 (−2.95, −2.46) |
| TVKD, day−1 | 0.0207 (0.0159, 0.0268) | B03 | −2.18 (−2.59, −1.78) |
| TVLAMBDA, day−1 | 0.0024 (0.00123, 0.00480) | B11 | −0.927 (−1.52, −0.34) |
| Slope, b ml/μg | 0.619 (0.554, 0.691) | B12 | −1.76 (−2.49, −1.03) |
| TVKEO, day−1 | 0.0284 (0.0248, 0.0326) | B13 | −1.94 (−2.34, −1.53) |
| A50, μg/ml | 1.16 (0.839, 1.481) | B21 | −0.132 (−0.877, 0.612) |
| Effect of baseline sBCMA on KEO | −0.414 (−0.561, −0.267) | B22 | −0.717 (−0.926, −0.509) |
| Effect of MEDFL on KEO | 0.108 (0.0617, 0.187) | B23 | −3.29 (−3.68, −2.90) |
| Effect of bB2M on KGR | 0.219 (0.011, 0.427) | B31 | 1.78 (0.891, 2.66) |
| Effect of bMPROT < 20 on KD | 1.41 (1.08, 1.85) | B32 | −0.708 (−1.03, −0.387) |
| M‐protein model random‐effects parameter | Estimate (% RSE) [Shrinkage, %] | B33 | −1.88 (−2.17, −1.59) |
| ω2 KGR | 0.677 (15.5) [15.8] | Emax | 4.42 (3.76, 5.08) |
| Covariance (KGR~KD) | 0.546 (20.0) | EC50 (μg/ml) | 3.64 (2.88, 4.40) |
| Covariance (KGR ~ LAMBDA) | 0.217 (78.3) | KEO (day−1) | 0.0244 (0.0164, 0.0324) |
| ω2 KD | 1.07 (21.1) [19.7] | Gamma (−) | 2.38 (1.53, 3.23) |
| Covariance (KD~LAMBDA) | 1.12 (46.4) | Baseline sBCMA on Emax (−) b | −0.0973 (−0.151, −0.0436) |
| ω2 LAMBDA | 3.04 (32.9) [35.6] | F1 = Emax factor previous Grade ≥ 1 (−) | −0.239 (−0.427, −0.0515) |
| ω2 KEO FIXED | 0.015 | F3 = Emax factor previous Grade ≥ 3 (−) | −0.484 (−0.683, −0.285) |
| ω2 Slope c fixed | 0.015 | ω2 Emax | 0.105 (0.0452, 0.164) |
| ω2 A50 fixed | 0.015 | – | – |
| %RES ERR, additive SD | 0.832 (3.8) | – | – |
| %RES ERR, proportional | 0.0633 (6.2) | – | – |
| KGRpop = TVKGR*(bB2M/350)θKGR_BB2M | – | ||
| KDpop = TVKD*θbMPROT<20 | |||
| KEOpop = TVKEO*θExtramedullary*(baseline sBCMA/100)θKEO_baseline sBCMA | |||
Parameter B models the baseline transition probabilities (without drug) from state.
Baseline sBCMA was included as a covariate on Emax as a factor (baseline sBCMA/baseline sBCMA0)θ, where baseline sBCMA0 was a reference value (88.2 ng/ml), and the value of θ was estimated (−0.0973).
Slope parameter of drug effect.
Abbreviations: A50, M‐protein concentration at which KGR is reduced by 50%; bB2M, baseline β2‐microglobulin; bMPROT, baseline M‐protein; CI, confidence interval; DTMM, discrete time Markov model; EC50, half maximal effective concentration; Emax, maximal effect; KD, death rate constant; KEO, effect concentration rate constant; KGR, growth rate constant; LAMBDA, resistance rate constant; MEDFL, extramedullary disease at screening; pop, population; RES ERR, residual error; RSE, relative standard error of the estimate; sBCMA, soluble B cell maturation antigen; SD, standard deviation; TV, typical value; ω2, variance of interindividual variability.
FIGURE 1.

Longitudinal models for (a) M‐protein, (b) ocular events, and (c) integrated framework for simulations. PK was described by a two‐compartment linear model. The effect of PK on M‐protein was modeled by modifying an existing tumor growth inhibition model in multiple myeloma 14 with a logistic growth term and an exponential kill term driven by belantamab mafodotin exposure. The effect of PK on ocular events was modeled by Emax as a function of effect concentration C and applied to the probabilities modeled on the logit scale. Changes in drug effect corresponded to a translation to the left or right along the probability curves. At higher values of C, probabilities favored transition to higher grades, dependent on the previous grade. f1 represents reduction factor when previous grade ≥1; f3 represents further reduction factor when 506 previous grade ≥3.
A50, M‐protein concentration at which KGR is reduced by 50%; ALB, albumin; AE, adverse event; BWT, body weight; C, effect concentration; CL, systemic clearance; EC50, half maximal effective concentration; Emax, maximal effect; f1, reduction factor when previous grade ≥ 1; f3, further reduction factor when previous grade ≥ 3; IgG, immunoglobulin G; IV, intravenous; KD, death rate constant; KEO, interindividual variability rate constant; KGR, growth rate constant; KVA, Keratopathy and Visual Acuity; Lambda, resistance rate constant; M, M‐protein concentration; ORR, overall response rate; PK, pharmacokinetics; Q3W, every 3 weeks; sBCMA, soluble B cell maturation antigen.
M‐protein (efficacy) modeling
The longitudinal time course of M‐protein concentrations was modeled with nonlinear mixed‐effects models using NONMEM software (Version 7.3; ICON Development Solutions). 17
An existing concentration‐driven TGI model used with MM 14 was modified with a logistic growth term 18 and an exponential kill term driven by belantamab mafodotin exposure to capture the drug effect on concentration–time profiles of M‐protein (Figure 1a). The logistic growth term was used to ensure unrealistic values of M‐protein would not be simulated, with the carrying capacity fixed at 150 g/L based on existing literature. 18 A modified weak Allee effect (50% growth reduction at M‐protein <1.16 g/L) was placed on the growth term to slow the growth rate at very low M‐protein concentrations, consistent with previously reported cooperative growth models for cancerous tumors. 19
A full covariate approach was employed, where covariates were selected based on previous analyses (baseline soluble BCMA [sBCMA], β2‐microglobulin, and extramedullary disease). 20 Other relevant covariates (including prior lines of therapy, baseline Eastern Cooperative Oncology Group status, immunoglobulin type, and C‐reactive protein levels) were assessed with graphical relationships between the individual estimates of random effects and the covariate values. Covariates were retained in the final model if the 95% confidence interval did not contain zero or if sufficient variability was described by the covariate when removed from the model.
Ocular adverse events (safety) modeling
The DTMM used to capture ocular events implemented transitions from any grade to any other, where Grade 3 and 4 events were combined because of the rarity of Grade 4 events. In the observed dataset (data as of October 2020), ocular events did not occur immediately after administration. To account for this, belantamab mafodotin exposure effect on transition probabilities was described with a maximal effect (Emax) model, where the delay was captured with an effect compartment feeding into the Emax model (Figure 1b). The Emax relationship was used to adjust the transition rate to favor higher grade events as exposure increased.
The final DTMM was also developed using NONMEM (Version 7.5.0). 17 The quality of the final DTMM was assessed by the ability of the model to capture transition probabilities across the observed effect concentrations from DREAMM‐2.
Simulation
All 218 patients from DREAMM‐2 were included in the simulations and retained their baseline covariate values from the set used to build the M‐protein and ocular events models. Missing baseline serum M‐protein values were imputed based on the relationship between serum M‐protein and baseline albumin, sBCMA, and immunoglobulin G levels. Each simulation covered a period of 315 days from first dose, with 500 replications for each dosing regimen and individual variability resimulated for each replication.
Patient dropout attributed to progressive disease was included in the simulations, in which patients were removed from the simulations at the time of disease progression. Progression was defined using IMWG criteria for serum M‐protein (increase of >25% over the lowest on‐treatment M‐protein concentration, with an absolute increase of >0.5 g/dl). 1 Disease progression was the most common reason for treatment discontinuation in DREAMM‐2 (69/85 patients who had discontinued by 13 months) 8 ; therefore, no other reasons for discontinuation were included in the models. Implementation of the framework was verified by resimulating the DREAMM‐2 study.
Efficacy and safety end points were simulated every 3 weeks for various doses with dosing intervals of 1, 3, 6, and 9 weeks and various event‐driven dose‐modification strategies (Table 2). In DREAMM‐2, investigators were able to hold or reduce the dose based on the occurrence of AEs. 7 Dose holds were implemented in the model following the onset of a Grade 2+ ocular event on the KVA scale, and a dose hold with subsequent dose reduction (or restart at the same dose if on the lowest allowable dose already) was implemented for Grade 3+ events, with resumption of dosing when the ocular event grade decreased to 0 or 1.
TABLE 2.
Belantamab mafodotin regimens included in the simulations and associated predicted outcomes.
| Belantamab mafodotin regimens included in the simulations | Predicted efficacy and safety outcomes (normalized to approved regimen of 2.5 mg/kg every 3 weeks) | ||||||
|---|---|---|---|---|---|---|---|
| Frequency | Initial dose (mg/kg) | Reduced dose (mg/kg) | Difference from control | Symbol used in figures | ORR ratio | Proportion of Grade 3+ ocular event ratio | Proportion of Grade 2+ ocular event ratio |
| Every 3 weeks | 2.5 | 1.9 a | None (control) |

|
1.00 | 1.00 | 1.00 |
| 1.9 | 1.4 a | Lower initial dose and lower reduced dose |

|
0.94 | 0.87 | 0.93 | |
| 1.4 | – | Lower initial dose, no reduced dose |

|
0.87 | 0.72 | 0.85 | |
| 0.9 | – | Lower initial dose, no reduced dose |

|
0.73 | 0.48 | 0.71 | |
| 2.5 split | – | Split dose as 1.25 mg/kg on Days 1 and 8, no reduced dose |

|
0.95 | 0.99 | 0.98 | |
| 2.5 metronomic | – | Split dose as 0.83 mg/kg qw, no reduced dose |

|
0.91 | 0.97 | 0.95 | |
| 2.5 planned step down | 1.9 (Day 21) | Planned dose reduction to 1.9 mg/kg at Day 21 |

|
0.98 | 0.91 | 0.97 | |
| Every 6 weeks | 2.5 | 1.9 a | Longer intertreatment interval |

|
0.90 | 0.75 | 0.89 |
| 1.9 | 1.4 a | Lower initial dose, lower reduced dose, longer intertreatment interval |

|
0.82 | 0.59 | 0.80 | |
| 2.5 planned step down | 1.9 (Day 43), 1.4 (Day 85) | Specified dose reduction to 1.9 mg/kg at Day 43 and to 1.4 mg/kg at Day 85 |

|
0.87 | 0.55 | 0.83 | |
| Every 9 weeks | 2.5 | 1.9 | Longer intertreatment interval |

|
0.82 | 0.60 | 0.81 |
Abbreviations: ORR, overall response rate; qw, once weekly.
Dose reduction following Grade 3 ocular event.
The efficacy outcome from the simulations was biochemical response rate based on serum M‐protein response, referred to and used as a surrogate for overall response rate (ORR; percentage of patients achieving a partial response or better). Serum M‐protein‐based response definitions from IMWG were used, in which partial response was defined as a ≥50% reduction in M‐protein from baseline. 1 Safety outcomes were the proportion of patients with KVA Grade 2+ or 3+ ocular events and the average time patients had Grade 2+ or Grade 3+ ocular events. As a result of the low level of individual variability in the DTMM, 500 iterations over 315 days were considered sufficient to estimate the population average for a given regimen. The median value for each outcome was normalized to the reference regimen (2.5 mg/kg q3w) and plotted to visualize the relative changes in efficacy or ocular event outcomes. In these plots, a unity line with a slope of 1 indicates a direct proportional change in both benefit and risk, and a normalized ORR cutoff of 0.87 represents the lowest efficacy deemed clinically acceptable compared with the reference regimen.
A final analysis explored the variability in the normalized ORRs and normalized proportion of patients with Grade 3+ ocular events. Variability in ratios was calculated by performing 10,000 bootstrap iterations from the distribution of one of the alternate dosing regimens as well as the distribution of the reference regimen. For each bootstrap iteration, the ratio of the alternate dosing regimen was divided by the reference distribution.
Simulations were conducted using NONMEM (Version 7.3) and R (Version 3.2.5 or higher; R Foundation for Statistical Computing). 21 , 22 Distributions generated from the simulations were used to plot the median and 5th and 95th percentiles.
Additional simulations were performed with dose modifications at Grade 2 (KVA scale) and lower reduced dose levels to support changes for the dose‐modification algorithm for a phase III combination study (DREAMM‐8) and are described in the Appendix S1.
RESULTS
Patient characteristics
Patient demographics and baseline disease characteristics have been previously described for DREAMM‐1 6 and DREAMM‐2. 7 Baseline characteristics for each study population are summarized in Table S2.
M‐protein modeling
M‐protein concentrations from 169 patients from DREAMM‐1 (n = 42) and DREAMM‐2 (n = 127) who were followed for response by serum M‐protein and had baseline M‐protein concentration ≥5 g/L were included in the development of the M‐protein model. M‐protein concentration–time profiles from each study showed a gradual decrease in concentrations during treatment (Figure S1). There was no steep or linear relationship between the first cycle change from baseline in M‐protein and trough belantamab mafodotin concentration after a 3‐week dosing interval (Figure S1).
Goodness‐of‐fit assessment indicated no systematic biases in the model across the range of data. Model predictions were aligned with observations (Figure 2a).
FIGURE 2.

Visual predictive check of observed data against (a) individual and population predictions from the longitudinal M‐protein model and (b) median predicted cumulative transition probability versus pharmacokinetic effect concentration in the final ocular adverse events discrete time Markov model.
(a) Individual time courses shown with trendline; (b) observed data shown as bars, predictions by the model as lines. Pharmacokinetic effect concentrations were binned into 10 quantiles of equal size, with the median probability taken over all samples in the bin with the same observed previous state. The cross and error bars indicate 95% confidence intervals of the observed and predicted values, respectively. The median values do not necessarily sum to 1.
Final parameter estimates and covariates that were strongly associated with individual model parameter values in the base model are presented in Table 1. The strongest trends were between high baseline β2‐microglobulin levels on a larger growth rate parameter and low baseline M‐protein on a larger kill rate parameter. These covariate effects had wide confidence intervals that did not include zero, suggesting statistical significance but imprecise estimation. Extramedullary disease status and sBCMA were included on the transfer rate constant to the effect compartment in the final model, as the inclusion of these factors improved the precision around this and other parameters, and reduced the residual error. As ADC concentration and baseline characteristics including sBCMA are linked, the model does include an indirect effect of sBMCA on efficacy; higher baseline sBCMA leads to lower ADC concentrations, which in turn lead to lower effect on the tumor growth rate. This likely impacted the significance of the baseline sBCMA in this model. 13
Ocular AEs
There were 2273 ocular assessments across Grades 0–4 from 218 patients in DREAMM‐2. Most patients (73%) experienced a Grade 2 or higher ocular AE, with 51% of patients reporting a Grade 3 and 3% a Grade 4 event.
Covariates were systematically tested on the Emax parameter of the drug effect (Table 1); baseline sBCMA concentration was found to be significant (confidence intervals did not include zero) and was included in the model. Predictions from the final DTMM reflected observed transition probabilities across effect‐compartment concentrations from DREAMM‐2; in both the observed and predicted data, the probability of transition to a higher ocular event grade increased with exposure (Figure 2b).
Simulations
The risk of developing a Grade 3+ ocular event during the course of the simulation increased with higher doses and higher frequency of dosing. Retaining the initial dose while extending the dosing interval resulted in a lower proportion of patients with Grade 3+ ocular events and shorter normalized average time with Grade 3+ ocular events, with a proportionally smaller drop in normalized efficacy, providing an improved benefit–risk profile (Figure 3c,d and Table 2). Reducing the dose while keeping dosing frequency consistent also improved the benefit–risk profile, but to a lesser extent than extending the dosing interval. An initial dose of 2.5 mg/kg, with reduction to 1.9 mg/kg for Grade 3+ events, during a longer dosing interval (every 6 weeks [q6w]) yielded the lowest proportion of patients with Grade 3+ ocular events and the shortest average time with Grade 3+ ocular events while still exceeding the efficacy threshold (0.87 normalized ORR). Split dosing (1.25 mg/kg on both Day 1 and Day 8) and weekly dosing reduced ORR compared with the reference regimen without a noticeable reduction in the proportion of patients with or time at Grade 3+ ocular event, indicating a worse benefit–risk profile. The probability of experiencing an ocular event at each simulated visit was approximately 5%–25% for all regimens, with the highest probability for the 0.83 mg/kg weekly regimen and the lowest probability for the 2.5 mg/kg initial dose, 1.9 mg/kg on Day 43, and 1.4 mg/kg on the Day 85 q6w regimen (Figure S2A).
FIGURE 3.
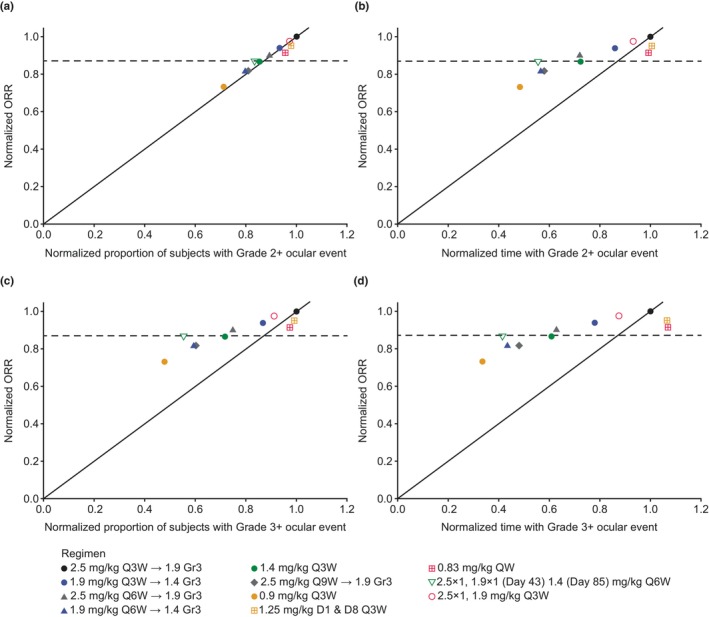
(a) Normalized ORR versus normalized proportion of patients with Grade 2+ ocular events, (b) normalized ORR versus normalized time above Grade 2, (c) normalized ORR versus normalized proportion of patients with Grade 3+ ocular events, and (d) normalized ORR versus normalized time above Grade 3.
The horizontal dashed line at 0.87 normalized ORR represents the lowest proportion of the efficacy achieved using the reference regimen that was deemed clinically acceptable. Arrow in regimen key indicates dose reduction following Grade 3 ocular event. Predicted ORR was based only on serum M‐protein response.
D1, Day 1; D8, Day 8; Gr3, grade 3; ORR, overall response rate; QW, once weekly; Q3W, every 3 weeks; Q6W, every 6 weeks; Q9W, every 9 weeks.
For Grade 2+ ocular events, there was minimal difference in the predicted benefit–risk profiles across all dosing regimens compared with the reference regimen, as all were close to the line of unity (Figure 3a and Table 2). With q3w dosing, the probability of a Grade 2+ ocular event reached a steady state by Day 63. The probability of experiencing an ocular event at each simulated visit was approximately 30% for the 1.4 and 0.9 mg/kg q3w regimens and 40% for all other regimens (Figure S2B). The pattern of normalized time with Grade 2+ ocular events was similar to that seen for Grade 3+, where reducing the dose or dosing frequency reduced risk with a smaller reduction in efficacy (Figure 3b).
The ratios for ORR showed greater variability than the ratios for the proportion of patients who developed a Grade 3+ ocular event (Figure 4).
FIGURE 4.

Comparison of normalized ORR versus normalized proportion of patients with Grade 3+ ocular events (median and 90% prediction intervals). Data above the unity line indicate an improved benefit–risk over the approved dose of 2.5 mg/kg every 3 weeks. Arrow in regimen key indicates dose reduction following Grade 3 ocular event. Predicted ORR was based only on serum M‐protein response.
D1, Day 1; D8, Day 8; Gr3, grade 3; ORR, overall response rate; QW, once weekly; Q3W, every 3 weeks; Q6W, every 6 weeks; Q9W, every 9 weeks.
DISCUSSION
In this study, an integrated framework was developed allowing description of the time course of treatment responses and ocular events following belantamab mafodotin administration. In line with the draft FDA guidance on optimizing dosage of oncology drugs, 12 this framework enabled the assessment of simulated benefit–risk profiles of candidate dose levels and dosing schedules in the face of a complex clinical interplay between efficacy and safety, including AE‐driven dose modification during treatment.
A TGI model with logistic growth and shrinkage rates driven by belantamab mafodotin exposure, with a resistance term that decreases shrinkage over time, adequately described the concentration–time curve of M‐protein in patients with RRMM receiving belantamab mafodotin as monotherapy. Individual M‐protein concentration–time profiles showed quite different responses across all patients; this resulted in large between‐subject variability in the maximum shrinkage rate KD and the rate of resistance. This may indicate a varying sensitivity to belantamab mafodotin concentrations that cannot be fully explained by patient characteristics, as is common for cancer treatments. This interpretation is further complicated by the inverse relationship between baseline sBCMA and belantamab mafodotin clearance as well as its rate of transfer to the effect compartment. In addition, baseline sBCMA is a prognostic factor, independent of treatment modality, further complicating interpretation of the sBCMA effect on the transfer to the effect compartment. 23 , 24 β2‐microglobulin influenced the growth parameter, whereby individuals with high baseline β2‐microglobulin had a larger growth rate constant. This may contribute to the inverse association of β2‐microglobulin with progression‐free survival in previous analyses and is consistent with its inclusion as a key component of the International Staging System for MM. 20 The weak Allee effect used to alter growth kinetics at very low concentrations of M‐protein was consistent with the possibility that tumor growth may be reduced at low cell density. These factors were correlated to varying degrees, leading to a complex relationship between exposure and changes to M‐protein levels, but it may be more difficult to ascertain the benefit across the full population. Although this model was not designed to evaluate this hypothesis, in patients with M‐protein concentration <1 g/L, regrowth did not occur at the rate expected from logistic growth alone, even with substantial dose interruption. The differential effects of treatment on distinct MM cell populations (progenitor and differentiated) may also have influenced the kinetics of the M‐protein response to treatment. 25 This model and the identified covariates are consistent with a prior static analysis of exposure in which the probability of response increased significantly with exposure in a univariate analysis, 20 but exposure was no longer significant in the multivariate model when baseline sBCMA was added to the model. This also supports the prior finding that the exposure shows a stronger relationship to safety outcomes than to changes in M‐protein.
In the ocular events (safety) model, a proportional odds model was initially used to describe the probability of ocular events of each grade. However, the observed data suggested that transition probabilities depended on the previous grade (as expected because of the progressive nature of the ocular damage), which is not accounted for in the proportional odds model. Therefore, a DTMM was developed to describe the probability of transitioning between grades conditional on the previous grade. 15 The final DTMM showed that increasing belantamab mafodotin exposure led to a higher probability of transition to higher event grade and that decreasing exposure (reduced dose or dose hold) led to a lower probability of transition to a higher grade. The model incorporated a delay in the effect of PK on ocular events, for both onset and offset, that was modeled by an effect compartment (KEO, effect compartment rate constant parameter). The transition from a low to a high grade introduced some delay because the probability of shifting between grades was less than 100% and could require passage through intermediate grades. In a proposed biological mechanism for this delayed onset, belantamab mafodotin is internalized by corneal epithelial cells via macropinocytosis and then cys‐mcMMAF is released within the cells. The corneal cells enter apoptosis and migrate centrally and anteriorly until they have completed apoptosis. 10 Epithelial cells are replenished every 7–10 days. 26 This proposed mechanism may account for both the delayed onset (because apoptosis and migration are not immediate) and delayed offset (as a result of the cell replenishment cycle) that were required for the model. The ocular event model achieved Type I and II error rates of approximately 20% when comparing the modeled and observed events (Grade 2+ and 3+ ocular AEs on the KVA scale) for the same subject parameters, indicating that the model adequately described the data observed in DREAMM‐2.
In the integrated time‐course simulations, the risk of ocular events was predicted to decrease with lower doses or less‐frequent dosing compared with the approved dose of 2.5 mg/kg q3w. This was accompanied by a less than proportional reduction in efficacy. Increasing the dosing interval also reduced the time spent with Grade 2+ ocular events, likely because the increased time between doses allowed corneal recovery before the next dose. When dose or dosing frequency was reduced, the drop in probability of and time with Grade 3+ ocular events was greater than the drop in efficacy outcomes, consistent with previous exposure–response analyses. 20 A similar but less pronounced effect was also observed for Grade 2+ ocular events. Split dosing (on Days 1 and 8) or metronomic (weekly) schedules were not predicted to improve the benefit–risk profile. These more frequent schedules did not appear to improve the safety profile, possibly because of the limited time for corneal recovery between doses; however, their predicted efficacy was also lower than the reference regimen. Although not all regimens were directly comparable, less‐frequent dosing at the same dose generally reduced ocular events without compromising efficacy. Greater variability was observed in the estimates of ORR than the risk of a Grade 3+ ocular event, suggesting that the adverse effects of belantamab mafodotin treatment are more reliably predicted than the beneficial effects.
The simulations generated in this study were used to assess potential efficacy risks and safety benefits to guide selection of dosing regimens for the ongoing DREAMM‐14 study (NCT05064358), which is investigating alternate dosing regimens of monotherapy. 27 In addition, the simulations were used to guide changes in dose modification in the DREAMM‐8 trial (NCT04484623). 28
There were several limitations to this study. The primary limitation was the absence of a regimen with a planned dosing frequency other than q3w in the DREAMM‐1 and DREAMM‐2 studies. Most patients received their second dose of belantamab mafodotin on time, so there were limited data generated from patients who received a second dose after a different interval. In addition, most of the data were collected in patients who received doses at or above 1.9 mg/kg; these constraints led to extrapolation of outcomes with lower doses and/or longer treatment intervals. There were few patients with a longer washout period, limiting further exploration of the washout period of belantamab mafodotin; however, this parameter will be prospectively investigated in ongoing studies. Bias attributed to the dropout rate or time on study could also be expected in the simulation compared with the observed data as simulations did not include censoring related to different durations of follow‐up before a landmark observation period. This bias may have been partially offset by normalizing all results to the approved dosing regimen to establish a rank order that placed emphasis on comparisons between regimens rather than on their absolute/numerical values. In addition, the longitudinal models have been developed using monotherapy data obtained from patients who have received three or more prior lines of myeloma therapy with efficacy simulations focused on early end points (e.g., ORR). Differences in efficacy end points or distribution of influential patient characteristics and/or drug effect in earlier line settings may impact the translation of these safety or efficacy simulation results. As data become available in new treatment settings, updates to the longitudinal models and population for simulations could improve the prediction accuracy for other settings. Predictions of late efficacy end points (e.g., overall survival) may be possible within this framework or by linking early efficacy end‐point predictions with model‐based meta‐analysis models describing the relationships between early and late efficacy end points. 29
A strength of this study was that patient characteristics, PK, dose, time course of efficacy, and time course of ocular safety were all accounted for and integrated into a simulation framework that included dose modification based on observed ocular AEs. This framework enables potential doses, schedules, and dose modifications that could improve the benefit–risk to be identified, which can be explored in future clinical trials. Future modeling studies will implement the framework to generate further predictions for a broader range of scenarios, incorporating clinical data on differing MM populations, alternative dosing regimens, and longer treatment periods. At present, these benefit–risk simulations provide an important framework to integrate existing clinical trial data and generate insights based on the totality of available evidence.
In conclusion, this study demonstrated the ability of an integrated simulation framework to estimate benefit–risk profiles across a wide range of dosing regimens. The efficacy and safety models developed in this study will be refined and improved as additional data become available from other studies of monotherapy and combination treatments for RRMM.
AUTHOR CONTRIBUTIONS
J.C., M.v.N., C.R., T.M.P., H.S., R.C.J., and G.F.‐B. contributed to the writing of the manuscript, designed the research, performed the research, and analyzed the data.
FUNDING INFORMATION
The DREAMM‐1 and DREAMM‐2 studies and the work presented in this article were funded by GSK (Studies 117,159 [NCT02064387] and 205,678 [NCT03525678]). GSK contributed to the study design, implementation, data collection, interpretation, and analysis. Leiden Experts on Advanced Pharmacokinetics and Pharmacodynamics were contracted to perform data analysis and contribute to interpretation. Medical writing support was provided by Taylor Sells, MS, and Mark Condon, DPhil, of Fishawack Indicia Ltd, part of Fishawack Health, and funded by GSK.
CONFLICT OF INTEREST STATEMENT
J.C., C.R., H.S., and G.F.‐B. are employees of GSK and hold stocks/shares. R.C.J. is an employee of GSK and holds stocks/shares in GSK and Novartis. M.v.N. and T.M.P. are employees of Leiden Experts on Advanced Pharmacokinetics and Pharmacodynamics and are paid consultants for GSK.
Supporting information
Appendix S1
ACKNOWLEDGMENTS
Drug linker technology was licensed from Seagen, Inc. (Bothell, WA), and the monoclonal antibody was produced with POTELLIGENT Technology licensed from BioWa (Princeton, NJ). Trademarks are owned by or licensed to the GSK group of companies. Editorial support (in the form of writing assistance, including preparation of the draft manuscript under the direction and guidance of the authors, collating, and incorporating authors' comments for each draft, assembling tables and figures, and referencing) was provided by Taylor Sells, MS, and Mark Condon, DPhil, of Fishawack Indicia Ltd., UK, part of Fishawack Health, and funded by GSK. This work was presented, in part, in abstract and poster form at the 2022 Annual Meeting of the American Society for Clinical Pharmacology and Therapeutics as Collins et al. 30
Collins J, van Noort M, Rathi C, et al. Longitudinal efficacy and safety modeling and simulation framework to aid dose selection of belantamab mafodotin for patients with multiple myeloma. CPT Pharmacometrics Syst Pharmacol. 2023;12:1411‐1424. doi: 10.1002/psp4.13016
DATA AVAILABILITY STATEMENT
Anonymized individual participant data and study documents can be requested for further research from www.clinicalstudydatarequest.com.
REFERENCES
- 1. Kumar S, Paiva B, Anderson KC, et al. International myeloma working group consensus criteria for response and minimal residual disease assessment in multiple myeloma. Lancet Oncol. 2016;17:e328‐e346. [DOI] [PubMed] [Google Scholar]
- 2. Dimopoulos MA, Moreau P, Terpos E, et al. Multiple myeloma: EHA‐ESMO clinical practice guidelines for diagnosis, treatment and follow‐up(†). Ann Oncol. 2021;32:309‐322. [DOI] [PubMed] [Google Scholar]
- 3. Mikhael J. Treatment options for triple‐class refractory multiple myeloma. Clin Lymphoma Myeloma Leuk. 2020;20:1‐7. [DOI] [PubMed] [Google Scholar]
- 4. Tai Y‐T, Mayes PA, Acharya C, et al. Novel anti–B‐cell maturation antigen antibody‐drug conjugate (GSK2857916) selectively induces killing of multiple myeloma. Blood. 2014;123:3128‐3138. [DOI] [PMC free article] [PubMed] [Google Scholar]
- 5. Trudel S, Lendvai N, Popat R, et al. Antibody‐drug conjugate, GSK2857916, in relapsed/refractory multiple myeloma: an update on safety and efficacy from dose expansion phase I study. Blood Cancer J. 2019;9:37. [DOI] [PMC free article] [PubMed] [Google Scholar]
- 6. Trudel S, Lendvai N, Popat R, et al. Targeting B‐cell maturation antigen with GSK2857916 antibody‐drug conjugate in relapsed or refractory multiple myeloma (BMA117159): a dose escalation and expansion phase 1 trial. Lancet Oncol. 2018;19:1641‐1653. [DOI] [PMC free article] [PubMed] [Google Scholar]
- 7. Lonial S, Lee HC, Badros A, et al. Belantamab mafodotin for relapsed or refractory multiple myeloma (DREAMM‐2): a two‐arm, randomised, open‐label, phase 2 study. Lancet Oncol. 2020;21:207‐221. [DOI] [PubMed] [Google Scholar]
- 8. Lonial S, Lee HC, Badros A, et al. Longer term outcomes with single‐agent belantamab mafodotin in patients with relapsed or refractory multiple myeloma: 13‐month follow‐up from the pivotal DREAMM‐2 study. Cancer. 2021;127:4198‐4212. [DOI] [PMC free article] [PubMed] [Google Scholar]
- 9. Eaton JS, Miller PE, Mannis MJ, Murphy CJ. Ocular adverse events associated with antibody‐drug conjugates in human clinical trials. J Ocul Pharmacol Ther. 2015;31:589‐604. [DOI] [PMC free article] [PubMed] [Google Scholar]
- 10. Farooq AV, Degli Esposti S, Popat R, et al. Corneal epithelial findings in patients with multiple myeloma treated with antibody–drug conjugate Belantamab Mafodotin in the pivotal, randomized, DREAMM‐2 study. Ophthalmol Ther. 2020;9:889‐911. [DOI] [PMC free article] [PubMed] [Google Scholar]
- 11. Nayak S, Sander O, al‐Huniti N, et al. Getting innovative therapies faster to patients at the right dose: impact of quantitative pharmacology towards first registration and expanding therapeutic use. Clin Pharmacol Ther. 2018;103:378‐383. [DOI] [PMC free article] [PubMed] [Google Scholar]
- 12. FDA . Optimizing the dosage of human prescription drugs and biological products for the treatment of oncologic diseases guidance for industry. Accessed February 14, 2023. https://www.fda.gov/media/164555/download
- 13. Rathi C, Collins J, Struemper H, Opalinska J, Jewell RC, Ferron‐Brady G. Population pharmacokinetics of belantamab mafodotin, a BCMA‐targeting agent in patients with relapsed/refractory multiple myeloma. CPT Pharmacometrics Syst Pharmacol. 2021;10:851‐863. [DOI] [PMC free article] [PubMed] [Google Scholar]
- 14. Jonsson F, Ou Y, Claret L, et al. A tumor growth inhibition model based on M‐protein levels in subjects with relapsed/refractory multiple myeloma following single‐agent carfilzomib use. CPT Pharmacometrics Syst Pharmacol. 2015;4:711‐719. [DOI] [PMC free article] [PubMed] [Google Scholar]
- 15. Lu T, Yang Y, Jin JY, Kågedal M. Analysis of longitudinal‐ordered categorical data for muscle spasm adverse event of Vismodegib: comparison between different Pharmacometric models. CPT Pharmacometrics Syst Pharmacol. 2020;9:96‐105. [DOI] [PMC free article] [PubMed] [Google Scholar]
- 16. Krishnaswami S, Austin D, Della Pasqua O, et al. MID3: Mission impossible or model‐informed drug discovery and development? Point‐counterpoint discussions on key challenges. Clin Pharmacol Ther. 2020;107:762‐772. [DOI] [PMC free article] [PubMed] [Google Scholar]
- 17. Beal SL, Boeckmann A, Bauer RJ. NONMEM User's Guides. Ellicott City, MD, USA: ICON Development Solutions; 1989. ‐2009. [Google Scholar]
- 18. Gallaher J, Larripa K, Renardy M, et al. Methods for determining key components in a mathematical model for tumor‐immune dynamics in multiple myeloma. J Theor Biol. 2018;458:31‐46. [DOI] [PubMed] [Google Scholar]
- 19. Johnson KE, Howard G, Mo W, et al. Cancer cell population growth kinetics at low densities deviate from the exponential growth model and suggest an Allee effect. PLoS Biol. 2019;17:e3000399. [DOI] [PMC free article] [PubMed] [Google Scholar]
- 20. Ferron‐Brady G, Rathi C, Collins J, et al. Exposure‐response analyses for therapeutic dose selection of Belantamab Mafodotin in patients with relapsed/refractory multiple myeloma. Clin Pharmacol Ther. 2021;110:1282‐1292. [DOI] [PMC free article] [PubMed] [Google Scholar]
- 21. R Core Team . R: A Language and Environment for Statistical Computing. Vienna, Austria: R Foundation for Statistical Computing; 2020. Accessed October 5, 2022. https://www.R‐project.org/ [Google Scholar]
- 22. R Studio Team . RStudio: Integrated Development Environment for R. Boston, MA, USA: Posit Software; 2020. Accessed October 5, 2022. http://www.rstudio.com/ [Google Scholar]
- 23. Bujarski S, Udd K, Soof C, et al. Baseline and changes in serum B‐cell maturation antigen levels rapidly indicate changes in clinical status among patients with relapsed/refractory multiple myeloma starting new therapy. Target Oncol. 2021;16:503‐515. [DOI] [PubMed] [Google Scholar]
- 24. Ghermezi M, Li M, Vardanyan S, et al. Serum B‐cell maturation antigen: a novel biomarker to predict outcomes for multiple myeloma patients. Haematologica. 2017;102:785‐795. [DOI] [PMC free article] [PubMed] [Google Scholar]
- 25. Tang M, Zhao R, van der Velde H, et al. Myeloma cell dynamics in response to treatment supports a model of hierarchical differentiation and clonal evolution. Clin Cancer Res. 2016;22:4206‐4214. [DOI] [PMC free article] [PubMed] [Google Scholar]
- 26. Bukowiecki A, Hos D, Cursiefen C, Eming SA. Wound‐healing studies in cornea and skin: parallels, differences and opportunities. Int J Mol Sci. 2017;18:1257. [DOI] [PMC free article] [PubMed] [Google Scholar]
- 27. Hultcrantz M, Kleinman D, Ghataorhe P, et al. Exploring alternative dosing regimens of single‐agent belantamab mafodotin on safety and efficacy in patients with relapsed or refractory multiple myeloma: DREAMM‐14. J Clin Oncol. 2022;40:TPS8073. [Google Scholar]
- 28. Clinicaltrials.gov . Belantamab Mafodotin Plus Pomalidomide and Dexamethasone (Pd) Versus Bortezomib Plus Pd in Relapsed/Refractory Multiple Myeloma (DREAMM 8). https://clinicaltrials.gov/ct2/show/NCT04484623. Accessed October 5, 2022.
- 29. Clements JD, Collins J, Witjes H, Visser SAG, Ferron‐Brady G. Model‐based meta‐analysis in newly diagnosed and relapsed refractory multiple myeloma to support outcome‐efficacy translations and extrapolations across lines of therapy. 2023. In Page 31 Abstr 10545 www.page‐meetingorg/?abstract=10545.
- 30. Collins J, van Noort M, Rathi C, et al. Longitudinal pharmacodynamic (PD) models to investigate efficacy and ocular safety following belantamab mafodotin (belamaf) administration in patients with relapsed/refractory multiple myeloma (RRMM) [abstract P‐043]. Clin Pharmacol Ther. 2022;111:S16. [Google Scholar]
Associated Data
This section collects any data citations, data availability statements, or supplementary materials included in this article.
Supplementary Materials
Appendix S1
Data Availability Statement
Anonymized individual participant data and study documents can be requested for further research from www.clinicalstudydatarequest.com.