

Abstract
We have built a quantitative systems toxicology modeling framework focused on the early prediction of oncotherapeutic‐induced clinical intestinal adverse effects. The model describes stem and progenitor cell dynamics in the small intestinal epithelium and integrates heterogeneous epithelial‐related processes, such as transcriptional profiles, citrulline kinetics, and probability of diarrhea. We fitted a mouse‐specific version of the model to quantify doxorubicin and 5‐fluorouracil (5‐FU)‐induced toxicity, which included pharmacokinetics and 5‐FU metabolism and assumed that both drugs led to cell cycle arrest and apoptosis in stem cells and proliferative progenitors. The model successfully recapitulated observations in mice regarding dose‐dependent disruption of proliferation which could lead to villus shortening, decrease of circulating citrulline, increased diarrhea risk, and transcriptional induction of the p53 pathway. Using a human‐specific epithelial model, we translated the cytotoxic activity of doxorubicin and 5‐FU quantified in mice into human intestinal injury and predicted with accuracy clinical diarrhea incidence. However, for gefitinib, a specific‐molecularly targeted therapy, the mice failed to reproduce epithelial toxicity at exposures much higher than those associated with clinical diarrhea. This indicates that, regardless of the translational modeling approach, preclinical experimental settings have to be suitable to quantify drug‐induced clinical toxicity with precision at the structural scale of the model. Our work demonstrates the usefulness of translational models at early stages of the drug development pipeline to predict clinical toxicity and highlights the importance of understanding cross‐settings differences in toxicity when building these approaches.
Study Highlights.
WHAT IS THE CURRENT KNOWLEDGE ON THE TOPIC?
Predicting and mitigating gastrointestinal (GI) toxicity is usually very challenging in preclinical stages of drug development and frequently requires expensive clinical assessment.
WHAT QUESTION DID THIS STUDY ADDRESS?
Is it possible to develop a quantitative systems model with capacity to predict clinical GI adverse effects at early stages of the drug development pipeline?
WHAT DOES THIS STUDY ADD TO OUR KNOWLEDGE?
We explore the successes and pitfalls of using preclinical in vivo data to develop translational quantitative modeling approaches that enable the prediction of human epithelial injury and clinical diarrhea risk at early stages of the drug development pipeline, prior to conducting clinical trials.
HOW MIGHT THIS CHANGE DRUG DISCOVERY, DEVELOPMENT, AND/OR THERAPEUTICS?
Novel modeling approaches with enhanced predictive performance can improve patient safety and accelerate the process of drug development.
INTRODUCTION
A long‐range vision for toxicity quantification aims to increase patient safety while reducing drug development costs through the integration of preclinical experimental methods and modeling approaches that quantify the perturbation of organ homeostasis. Thus, organ specific quantitative systems toxicology models are increasingly becoming essential components of modern drug testing strategies, with capacity to predict and understand toxicity mechanisms at early stages of drug development for safety optimization, as highlighted elsewhere. 1
Chemotherapy‐induced diarrhea can occur in 50%–80% of patients depending on the regimen. 2 A detailed investigation of deaths occurring in clinical trials of irinotecan plus high‐dose fluorouracil and leucovorin led to the recognition of life‐threatening gastrointestinal (GI) toxicity and highlighted the need for its monitoring and treatment. 2 , 3 , 4 Chemotherapy‐induced diarrhea often results from epithelial ulceration and mucosal inflammation derived from the cytotoxic activity of chemotherapeutics on the rapidly dividing GI epithelial cells. 5 , 6 Targeted molecular therapies, such as tyrosine kinase inhibitors (TKIs), have also been associated with high incidence of diarrhea in patients, but the mechanisms underlying TKI‐induced GI toxicity remain poorly understood. 7
The small intestinal epithelium forms a cellular monolayer folded to form invaginations or crypts and protrusions or villi. It is a highly dynamic tissue with rapid cell renewal fueled by continuously dividing stem cells and progenitors in the crypts 8 that migrate toward the villus while differentiating into matured epithelial cell types. 9 Several compartmental models have been proposed to describe epithelial dynamics with various structures and levels of granularity tailored to study cancer progression 10 , 11 and stem and epithelial cell dynamics. 12 , 13 , 14 Of high relevance to our work, a previous translational study which demonstrated the possibility of predicting clinical GI adverse events from preclinical data using a dynamic mathematical model of the epithelium. 15 Here, we present a refined epithelial dynamics modeling framework that describes stem and progenitor cell proliferation and differentiation, cell migration onto the villus, and includes a feedback mechanism from mature cells to enhance progenitor cell proliferation following injury. Moreover, the model integrates heterogeneous epithelial‐related processes, such as gene transcription, plasma citrulline kinetics, as well as diarrhea risk. Using 5‐fluorouracil (5‐FU), doxorubicin, and gefitinib as tool compounds, we explore the successes and pitfalls of the use of preclinical in vivo data to develop translational quantitative modeling solutions enabling the prediction of human epithelial injury and clinical diarrhea risk at early stages of the drug development pipeline, prior to conducting clinical trials.
MATERIALS AND METHODS
An integrative model of the mouse small intestine epithelium describes the dynamics of cells, gene transcription, citrulline, and diarrhea risk during drug‐induced injury and recovery
We have modeled the intestinal epithelium as a two‐dimensional strip of cells running from the base of a crypt to the tip of a neighboring villus, as observed on transverse sections of the small intestine. The model describes the temporal dynamics of cells across four physical compartments: stem cells, proliferative progenitors in the crypt, and non‐proliferative cells in the crypt and villus (Figure 1). Stem cells proliferate and give rise to proliferative progenitors which differentiate into mature epithelial cells that are transferred to the villus and eventually shed into the lumen. We have also implemented a negative feedback loop between villus cells and crypt progenitors that regulates cell proliferation and recapitulates the enhanced crypt proliferation that is observed after epithelial damage. 16 , 17 Epithelial homeostasis, or steady‐state, is achieved in all compartments by a precise balancing of the cell proliferation, differentiation, and shedding rates. Homeostatic values (Table 1) represent an asymptotically stable equilibrium (see the model bifurcation analysis in Supplementary Material) and are recovered after perturbations, such as drug challenges, of the system.
FIGURE 1.

Schematic of the intestinal epithelial model to describe the effect of drugs perturbing proliferative cells. The epithelium comprises three compartments in the crypt to describe stem (S) cells, proliferative progenitors (P) and differentiated (D) non‐proliferative cells and a villus (V) compartment with epithelial cells. Villus cells feedback on the proliferation of crypt cells. Drug‐induced arrested and apoptotic proliferative cells are described by additional compartments in the crypt (C Arr and C Apo, respectively) and eventually on the villus (V Arr and V Apo, respectively) after cell migration. Transcription of selected genes is increased in arrested and apoptotic cells. Citrulline (Citr) is produced by mature epithelial cells on the villus and decreases upon villus injury. The integrity of the villus, quantified here by the number of cells, impacts on the risk of diarrhea, which increases as the cell number decreases. Plus/minus signs describe the direct/inverse relationship between quantities. Without loss of generality and in alignment with the data, the model refers to two‐dimensional longitudinal crypt villus strips.
TABLE 1.
Multiscale epithelial model parameter values and description.
| Parameter (units) | Description | Mouse | Human | ||||
|---|---|---|---|---|---|---|---|
| 5‐FU | Doxorubicin | ||||||
| Value ± St error | Value ± St error | Source | 5‐FU | Doxo | Source | ||
| Cell dynamics | |||||||
| s ss (cells) a | Number of stem cells in steady‐state | 2 | 2 | 8 | 2 | 25 | |
| p ss (cells) a | Number of proliferative progenitors in steady‐state | 18.3 | 14.70 | Direct estimation from experimental data (Ki67+ cells—s ss) | 19.446 | 30 | |
| d ss (cells) a | Number of crypt nonproliferative cells in steady‐state | 5.3 | 7.11 | Direct estimation from experimental data (crypt cells—p ss ‐s ss) | 11.154 | 30 | |
| v ss (cells) a | Number of villus cells in steady‐state | 106 ± 15.1 | 96.35 ± 5.395 | Direct estimation from experimental data | 4 × 32.6 | Scaled using mouse villus/crypt ratio | |
| λ s (h−1) | Rate of proliferation of stem cells | ln (2)/21 | ln (2)/21 | 54 | ln (2)/(21/12 × 29.7) | Scaled using mouse stem/proliferative cycle ratio | |
| λ P (h−1) | Rate of proliferation of proliferative cells | ln (2)/12 | ln (2)/12 | 9 | ln (2)/29.7 | 30 | |
| γ | Strength of feedback from villus to proliferative crypt cells | 3.41 ± 0.0793 | 3.41 ± 0.0793 | Fitted to 5‐FU mouse experimental data | 3.41 | Assumed from mouse | |
| δ SP (h−1) | Transfer rate from stem to proliferative compartment | λ s | λ s | Steady‐state estimation | λ s | Steady state estimation | |
| δ PD (h−1) | Transfer rate from proliferative to crypt nonproliferative compartment | λ P (1 + γ/2) + δ SP s ss/p ss | λ P (1 + γ/2) + δ SP s ss/p ss | Steady‐state estimation | λ P (1 + γ/2) + δ SP s ss/p ss | Steady‐state estimation | |
| δ DV (h−1) | Transfer rate from crypt nonproliferative to villus compartment | δ PD p ss/d ss | δ PD p ss/d ss | Steady‐state estimation | δ PD p ss/d ss | Steady‐state estimation | |
| τ V (h−1) | Cell shedding rate from the villus | δ DV d ss/v ss | δ DV d ss/v ss | Steady‐state estimation | δ DV d ss/v ss | Steady‐state estimation | |
| τ Apo (h−1) | Rate of the apoptotic process that culminates in cell detachment | 1/12 | 1/12 | 55 | 1/12 | 55 | |
| m | Shape coefficient | 1.469 ± 0.0418 | 1.469 ± 0.0418 | Fitted to 5‐FU mouse experimental data | 1.469 | Assumed from mouse | |
| Drug effects | |||||||
| k inhib | Strength of drug‐induced proliferation inhibition | 0.7940 ± 0.0818 | 0.002966 ± 0.000613 | Fitted to 5‐FU or doxorubicin mouse experimental data | 0.7940 | 0.002966 | Assumed from mouse |
| k kill | Strength of drug‐induced cell death | 0.5551 ± 0.0660 | 0.00214 ± 0.000478 | Fitted to 5‐FU or doxorubicin mouse experimental data | 0.5551 | 0.00214 | Assumed from mouse |
| C 50 (ng/mL) | Half of the concentration with maximal effect | 1318 ± 49.48 | – | Fitted to 5‐FU or doxorubicin mouse experimental data | 1318 | NA | Assumed from mouse |
| hill | Hill coefficient | 5 | – | Fixed (fitted value >> 5) | 5 | NA | Assumed from mouse |
| Fu | Fraction of unbound compound in plasma | 0.88 | 0.22 | Simcyp | 0.9 | 0.28 | Simcyp |
| Citrulline | |||||||
| citru ss (ng/mL) | Plasma concentration of citrulline at steady‐state | 8237.6 ± 1321 | 6600 ± 1061 | Direct estimation from experimental data | 7175.064 | 18 | |
| k Citru (ng/mL h−1 cells−2) | Rate of citrulline production | 0.0233 ± 0.00222 | 0.0232 ± 0.00222 | Fitted to 5‐FU mouse experimental data | Cl Citru citru ss /v ss 2 | Steady‐state estimation | |
| Cl Citru (h−1) | Rate of citrulline elimination from plasma | k Citru v ss 2/citru ss | k Citru v ss 2/citru ss | Steady‐state estimation | 1.066380278 | 56 | |
| Probability diarrhea | |||||||
| β 0 | Nonlinear logistic regression model | 3.5 | 3.5 | Fixed to achieve placebo probability ~0 | 3.5 | Assumed from mouse | |
| β 1 | Nonlinear logistic regression model | −5.1298 ± 0.8558 | −5.1298 ± 0.8558 | Fitted to 5‐FU mouse experimental data | −5.1298 ± 0.8558 | Assumed from mouse | |
| Loss 50 | Non‐linear logistic regression model | 0.06951 ± 0.0421 | 0.06951 ± 0.0421 | Fitted to 5‐FU mouse experimental data | 0.06951 ± 0.0421 | Assumed from mouse | |
| Gene transcription | |||||||
| zss p53 | z‐score of p53 at steady‐state | 9.842 ± 0.06588 | – | Fitted to 5‐FU mouse experimental data | – | ||
| k p53 | Slope of change of p53 z‐score | 5.540 ± 1.041 | – | Fitted to 5‐FU mouse experimental data | – | ||
| zss p21 | z‐score of p21 at steady‐state | 12.30 ± 0.06203 | – | Fitted to 5‐FU mouse experimental data | – | ||
| k p21 | Slope of change of p21 z‐score | 9.757 ± 0.9799 | – | Fitted to 5‐FU mouse experimental data | – | ||
| zss mdm2 | z‐score of mdm2 at steady‐state | 8.207 ± 0.07607 | – | Fitted to 5‐FU mouse experimental data | – | ||
| k mdm2 | Slope of change of mdm2 z‐score | 9.739 ± 1.201 | – | Fitted to 5‐FU mouse experimental data | – | ||
| zss bax | z‐score of bax at steady‐state | 7.852 ± 0.09150 | – | Fitted to 5‐FU mouse experimental data | – | ||
| k bax | Slope of change of bax z‐score | 12.45 ± 1.445 | – | Fitted to 5‐FU mouse experimental data | – | ||
| zss pidd1 | z‐score of pidd1 at steady‐state | 6.710 ± 0.09470 | – | Fitted to 5‐FU mouse experimental data | – | ||
| k pidd1 | Slope of change of pidd1 z‐score | 11.84 ± 1.496 | – | Fitted to 5‐FU mouse experimental data | – | ||
| zss sesn2 | z‐score of sesn2 at steady‐state | 7.323 ± 0.06949 | – | Fitted to 5‐FU mouse experimental data | – | ||
| k sesn2 | Slope of change of sesn2 z‐score | 10.67 ± 1.098 | – | Fitted to 5‐FU mouse experimental data | – | ||
| Initial values | |||||||
| S(0) = s ss; P(0) = p ss; D(0) = d ss; V(0) = v ss; Citru(0) = citru ss; C Arr(0) = 0; C Apo(0) = 0; V Arr(0) = 0; V Apo(0) = 0 | |||||||
Abbreviations: 5‐FU, 5‐fluorouracil; NA, not applicable.
Cell counts in a two‐dimensional semi‐crypt‐villus longitudinal strip from crypt base to villus tip.
The mechanisms of drug toxicity considered in this work are tailored to the available data and comprise common cell toxicity mechanisms of oncotherapeutics, such as cell cycle arrest and induction of apoptosis of proliferative cells including stem cells. 6 , 7 We modeled the dynamics of arrested and apoptotic cells in response to drug interventions with additional compartments that enabled the description of transcriptional changes in selected genes significantly associated with the proportion of apoptotic and proliferative cells in the epithelium (Figure 1). Gene expression analysis is increasingly integrated in modern drug safety assessment strategies as a highly useful resource to reveal toxicity mechanisms and could be used to support model fitting.
The model also describes plasma citrulline kinetics and predicts the risk of diarrhea, which both are affected by the integrity of the epithelium. The concentration of citrulline in plasma has been proposed as a noninvasive biomarker of functional enterocyte mass in patients and preclinical species. 18 , 19 In contrast to histopathology, which is a terminal end point, repeated citrulline measurements can be easily acquired to support model fitting. We modeled the production of citrulline by matured epithelial cells and its clearance from plasma which results in a homeostatic concentration that decreases upon epithelial damage. 18 , 19 In addition and because of its high clinical relevance, we integrated the probability of diarrhea in our modeling approach using a logistic regression model in which the governing parameter is a nonlinear function of the number of villus cells, or epithelial integrity, and hence quantifies the increase or decrease of diarrhea risk as the number of villus cells decreases or increases over time during injury or recovery (see Supplementary Material).
Altogether, we have built a model that describes epithelial cell dynamics in homeostasis and following drug challenges with a focus on oncotherapeutic mechanisms of toxicity to enable the prediction of clinical end points associated with relevant dosing schedules at early stages of drug development. Additional information on models, techniques, and parameters is described in the Supplementary Material and Tables 1, 2, 3. Models are available through BioModels 20 (MODEL2212120003).
TABLE 2.
PK model parameter values and description.
| Parameter (units) | Model | Equations | Description | Value ± St error | Source |
|---|---|---|---|---|---|
| K a (mouse: ng × kg/mg/mL; human: ng × m2/mg/ml) | 5‐FU PK model | S1–S7 | Adjustment constant for initial drug concentration in plasma | 1123 ± 122.9 | Fitted to Simcyp mouse predictions 21 |
| Ke FUplasma + K FUMP (h −1 ) | 5‐FU PK model | S1–S7 | 5‐FU clearance and metabolic conversion rate | 5.625 ± 0.3919 | Fitted to Simcyp mouse predictions 21 |
| K per (h −1 ) | 5‐FU PK model | S1–S7 | 5‐FU transfer rate from plasma to peripheral compartment | 2.160 ± 0.1707 | Fitted to Simcyp mouse predictions 21 |
| K fromper (h −1 ) | 5‐FU PK model | S1–S7 | 5‐FU transfer rate from peripheral compartment to plasma | 1.516 ± 0.0385 | Fitted to Simcyp mouse predictions 21 |
| Ke FUTP (h −1 ) | 5‐FU PK model | S1–S7 | FUTP clearance rate | 1.010 ± 0.1548 | Fitted to mouse experimental data |
| K FUMP (h −1 ) | 5‐FU PK model | S1–S7 | 5‐FU conversion rate into FUMP | 1.555 ± 0.2071 | Fitted to mouse experimental data |
| K FUDP (h −1 ) | 5‐FU PK model | S1–S7 | FUMP conversion rate into FUDP | 0.2973 ± 0.0169 | Fitted to mouse experimental data |
| K FUTP (h −1 ) | 5‐FU PK model | S1–S7 | FUDP conversion rate into FUTP | 0.8478 ± 0.1069 | Fitted to mouse experimental data |
| K FdUTP (h −1 ) | 5‐FU PK model | S1–S7 | Rapid equilibrium constant between FdUTP and FUDP | 3.154 ± 0.6003 | Fitted to mouse experimental data |
| K FdUMP (h −1 ) | 5‐FU PK model | S1–S7 | Rapid equilibrium constant between FdUMP and both 5‐FU and FUDP | 0.1452 ± 0.01580 | Fitted to mouse experimental data |
| FU plasma(0) (ng/mL) | 5‐FU PK model | S1–S7 | 5‐FU plasma concentration at time 0 a | dose(mg/kg) × K a | Dose dependent |
| FUper(0) FUMP(0), FUDP(0), FUTP(0) (ng/mL) | 5‐FU PK model | S1–S7 | 5‐FU peripheral compartment, FUMP, FUDP, FUTP, FdUMP, FdUTP concentration at time 0 a , respectively | 0 | Assumed |
| K a (ng × Kg/mg/mL) | Doxorubicin PK model | S7–S9 | Adjustment constant for initial drug concentration in plasma | 1045 ± 23.49 | Fitted to Simcyp mouse predictions |
| Ke Doxo (h −1 ) | Doxorubicin PK model | S7–S9 | Doxorubicin clearance rate | 0.9746 ± 0.0196 | Fitted to Simcyp mouse predictions |
| K per (h −1 ) | Doxorubicin PK model | S7–S9 | Doxorubicin transfer rate from plasma to peripheral compartment | 2.138 ± 0.0453 | Fitted to Simcyp mouse predictions |
| K fromper (h −1 ) | Doxorubicin PK model | S7–S9 | Doxorubicin transfer rate from peripheral compartment to plasma | 0.2347 ± 0.0040 | Fitted to Simcyp mouse predictions |
| Doxo plasma(0) (ng/mL) | Doxorubicin PK model | S7–S9 | Doxorubicin plasma concentration at time 0 a | dose(mg/kg) × K a | Dose dependent |
| Doxoper(0) (ng/mL) | Doxorubicin PK model | S7–S9 | Doxorubicin peripheral compartment concentration at time 0 a , respectively | 0 | Assumed |
Abbreviations: 5‐FU, 5‐fluorouracil; PK, pharmacokinetic.
Time 0 is the moment of the first dose of the drug.
TABLE 3.
Input parameters of the doxorubicin and gefitinib mouse physiologically based pharmacokinetic (PBPK) models developed using the Simcyp animal tool.
| Parameters and models | Value | Source | |
|---|---|---|---|
| Doxorubicin | |||
| Physicochemical properties | Molecular weight (g/mol) | 543.5 | PubChem |
| Log Pow | 1.27 | PubChem | |
| Compound type | Monoprotic Base | ||
| pKa | 8.2 | 57 | |
| Blood and plasma binding | Blood to plasma ratio | 1 | Assumed |
| Fraction unbound in plasma | 0.22 | 58 | |
| Distribution | Distribution model | Full PBPK | |
| Volume of distribution at steady‐state (L/kg) | 101.16 | Predicted using Rodgers and Rowland method 59 , 60 | |
| Tissue: plasma partition coefficient scalar | 3.8 | Adjusted to match observed volume of distribution at steady‐state 61 | |
| Elimination | Clearance model | In Vivo Clearance | |
| In vivo clearance (mL/min) | 1.875 | 61 | |
| Typical renal clearance (mL/min) | 0.2044 | Adjusted based on urine excretion 61 | |
| Gefitinib | |||
| Physicochemical properties | Molecular weight (g/mol) | 446.9 | PubChem |
| Log Pow | 4.15 | 45 | |
| Compound type | Diprotic base | ||
| pKa 1/pKa 2 | 5.4/7.2 | FDA label | |
| Blood and plasma binding | Blood to plasma ratio | 0.8 | Assumed the same as in human 45 |
| Fraction unbound in plasma | 0.051 | 47 | |
| Absorption | Absorption model | Advanced dissolution, absorption, and metabolism model | |
| Fraction unbound in gut | 1 | Assumed | |
| Jejunum permeability (10−4 cm/s) | 1.33 | Predicting using mechanistic P eff model based on Sugano (2009) 62 | |
| Distribution | Distribution model | Full PBPK model | |
| Volume of distribution at steady‐state (L/kg) | 7.49 | Predicted using Rodgers and Rowland method 59 , 60 | |
| Tissue: plasma partition coefficient scalar | 0.5 | Adjusted to fit observed plasma profile from 63 | |
| Elimination | Clearance model | In vivo clearance | |
| In vivo clearance (mL/min) | 1 | 64 | |
Note: Measured plasma drug concentration in mice after gefitinib and doxorubicin dosing were used for model verification.
Abbreviations: FDA, US Food and Drug Administration; PBPK, physiologically‐based pharmacokinetic.
In vivo mice experiments
All experiments were performed in an Association for Assessment and Accreditation of Laboratory Animal Care approved rodent facility and in accordance with the applicable animal welfare guidelines and legislation. Experimental procedures were approved by the institutional ethics committee.
All 5‐FU in vivo data used in this paper have been previously published. 21
In the present work, C57BL/6J male mice were treated with doxorubicin at 5 or 10 mg/kg by i.v. bolus injection via tail vein on day 0 and 1. Mice were euthanized at 6, 24, 72, or 96 h after initiation of the treatment. Gefitinib was dosed to C57BL/6J male mice at 8 or 250 mg/kg/day via oral gavage from day 0 to day 9. Mice were euthanized at 6 and 24 h and on days 6 and 10 after initiation of the treatment. For each dose and timepoint, three vehicle‐ and four to six untreated animals were included. Tissue collection, determination of tissue drug and citrulline concentrations, histopathology, histomorphometry, immunohistochemistry, and stool consistency assessment in the mice were performed as previously described. 21
Transcriptomic analysis across settings
The details on the transcriptomics analysis and dataset derived from murine and human organoids responding to 5‐FU challenge can be found in previously published reports. 21 , 22 The transcriptional analysis of the mouse colon and jejunum samples is also publicly available. 21
RESULTS
Cell dynamics in mouse small intestinal epithelium is disrupted by 5‐FU and doxorubicin at clinically relevant exposures and recovers after dosing interruption
We fitted our model to data available from mice that had been dosed with 5‐FU and doxorubicin, resembling potentially available data from preclinical studies conducted at early stages of the drug development pipeline.
The 5‐FU pharmacokinetics (PKs) were modeled in the mice by considering a reduced version of the 5‐FU metabolic pathway that gives rise to the three active metabolites FdUTP, FdUMP, and FUTP. 23 The PK model comprised only those metabolites measured in previous in vivo experiments 21 (Figure S1, Table 2) and predicted the temporal profile of their concentrations in plasma, as well as in the epithelium by assuming rapid equilibrium across tissues.
We considered FUTP to be the main metabolite responsible for 5‐FU induced epithelial toxicity 24 and assumed that mostly FUTP‐mediated RNA damage led to cell cycle arrest and apoptosis of proliferative cells. In a published study by Jardi et al., 21 mice were dosed with 20 or 50 mg/kg of 5‐FU twice a day for 4 days, achieving clinically relevant exposures, followed by a 2‐day recovery period. We used the plasma profile exposure of FUTP (Figure 2a) associated with those schedules to fit our dynamic epithelial model to the previously published cell count dataset in that study 21 (Figure 2b). We considered that Ki‐67+ cells represented all proliferative crypt cells, including stem cells and proliferative progenitors.
FIGURE 2.
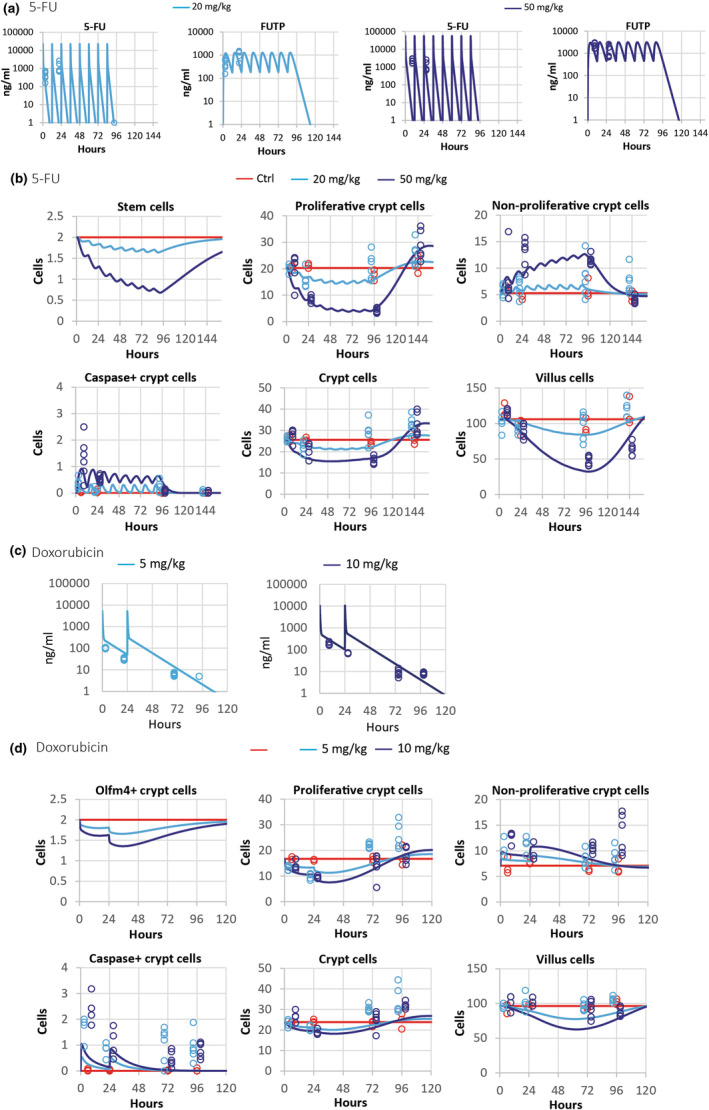
(a) Observed and predicted plasma concentration of 5‐FU and its metabolite FUTP following the i.v. administration of 20 and 50 mg/kg every 12 h (b.i.d.) for 4 days followed by a 2‐day recovery period, in mice; (b) observed and predicted number of cells in a two‐dimensional longitudinal crypt villus strip from crypt base to villus tip of control and treated 5‐fluorouracil (5‐FU) mice. (c) Doxorubicin plasma concentration after the i.v. administration of 5 and 10 mg/kg every 24 h for 2 days followed by a 2‐day recovery period and (d) observed and predicted cell counts control and doxorubicin treated mice. Lines are predictions and symbols are observations. Proliferative crypt cells refer to stem cells and proliferative progenitors in the crypt. Non‐proliferative crypt cells describe progenitors and arrested and apoptotic cells in the crypt. Crypt and villus cells refer to total cells including arrested and apoptotic cells in crypt and villus, respectively. Sampling times have been shifted (±3 h) to improve data visibility.
Our model reproduced the observed cell injury and recovery dynamics in 5‐FU treated epithelium at both dose levels, suggesting that drug‐induced cell cycle arrest and apoptosis of crypt proliferative cells were the main drivers of the observed decellularity in crypt and villus during this treatment (Figure 2b). In agreement with observations, whereas the predicted number of crypt progenitor cells recovered their homeostatic numbers 2 days after treatment interruption, the stem cell population and villus were not fully recovered at that timepoint in animals treated with the highest dose of 5‐FU (Figure 2b). In the study of Jardi et al., 21 the reported numbers of Olfm4+ cells were large when compared to those reported in humans, where Olfm4 is a robust marker of Lgr5+ stem cells, 25 or to the number of Lgr5+ stem cells reported in other mouse studies. 8 Our model includes actively cycling stem cells at the base of the crypt, which could be identified with Lgr5+ stem cells, and describes a delay in its recovery after 5‐FU treatment interruption in agreement with the delay in the recovery of Olfm4+ cells reported by Jardi et al. 21
Regarding doxorubicin, we generated new data in mice dosed with 5 or 10 mg/kg daily for 2 days followed by a 2‐day recovery period. Dose selection was guided by previous tolerability studies as well as the Simcyp simulator 26 (Table 3) to achieve comparable unbound compound exposure in mice to that observed in patients at clinically relevant doses. 27 Doxorubicin plasma concentration was modeled considering its distribution and elimination with a linear two‐compartmental model (Figure S2A, Table 2). The model was fitted to Simcyp 26 simulated plasma concentrations (Figure S2B) and described with accuracy the newly obtained measurements in this study (Figure 2c).
Doxorubicin induced a modest dose‐dependent decrease of citrulline concentration and, at the high dose, a very limited reduction in the number of cells in the crypt (Figure 2d) and villus compared to that reported in 5‐FU experiments (Figure 2d). These results restricted the choice of the modeling solution with unambiguous fitting results, and we adopted a simple approach by considering a linear relationship between the unbound doxorubicin concentration and the induction of cell cycle arrest and apoptosis of proliferative epithelial cells (see Supplementary Material). The model recapitulated the decrease of proliferative cells and the associated increased of nonproliferative compartment due to arrested and apoptotic cells in the crypt (Figure 2d). It also described crypt and villus decellularity with all cell compartments recovering homeostatic values after the 2‐day recovery period (Figure 2d).
In summary, our model quantifies drug‐induced cell cycle arrest and apoptosis of proliferative cells and recapitulates the dynamics of the epithelial disturbance during oncology treatments and the regain of homeostasis during recovery in the mouse.
Our model of drug‐induced intestinal toxicity predicts gene transcription, citrulline production, and diarrhea risk associated with epithelial disruption
Next, we extended the cell dynamics model to integrate processes affected by the drug‐induced epithelial disruption, related to clinical end points or outputs of interest, using mouse data (for model details, see the model Description Section).
We first investigated 5‐FU induced transcriptional changes in previously published datasets obtained in human‐ 22 and mouse‐derived 21 enteroids and colonoids as well as in mouse colon and jejunum samples. 21 Upon 5‐FU challenge, the expression of several genes belonging to the p53 pathway was modified consistently with 5‐FU exposure across all these preclinical experimental settings (Figure S3). To fit our dynamic model of the mouse small epithelium, we used the jejunal transcriptional scores of these genes reported in the study of Jardi et al. 21 In that study, the level of gene expression was quantified in mucosal samples, comprising both damaged and healthy epithelial cells at sparse timepoints during treatment and recovery. Thus, the resolution of the data was not sufficient to develop a model of the expression dynamics of this network of genes. Instead, we assumed that the epithelial transcriptional level, quantified by z‐scores, was linearly related to changes in the proportion of apoptotic and arrested cells in the mouse epithelium. Figure 3a shows good agreement between observed and predicted upregulation of several genes of the p53 pathway during 5‐FU treatment, followed by their return to baseline values during recovery. For the case of doxorubicin, the limited changes in the epithelium at the tested doses together with transcriptional variability and the relative low data resolution prevented the detection of a clear transcriptional pattern across experimental settings.
FIGURE 3.

Observed and predicted z‐scores of p53‐pathway genes. (a) Plasma citrulline (b) and probability of 5‐fluorouracil (5‐FU)‐induced diarrhea (b) in control and 5‐FU treated mice as described in Figure 2a). (c) Observed and predicted plasma citrulline in control and doxorubicin treated as described in Figure 2c. Lines are predictions and symbols are observations. Sampling times have been shifted (±3 h) to improve data visibility.
Citrulline plasma kinetics were modeled assuming intestinal production and clearance by several metabolic pathways. 28 , 29 The model was fitted exclusively to 5‐FU observations (Figure 3b) and used to predict plasma citrulline concentration following doxorubicin treatment (Figure 3c). The good agreement between independent doxorubicin observations and model predictions suggests that plasma citrulline is strongly dependent on epithelial integrity regardless of the primary cause of injury. Citrulline levels decreased during the treatments and started to recover after their interruption but did not return to homeostatic levels following treatment with either compound at any dose after the recovery period, despite the number of cells in the villus reaching homeostatic levels in all treatments with the exception of the high dose of 5‐FU group (Figure 2b–d). This suggests that citrulline does not recover at the same pace as the villus. In our model, we assumed that the retarded recovery of the plasma citrulline levels resulted from differences between its production and clearance kinetics, but other factors could be affecting the concentration of plasma citrulline after a drug challenge.
To fit the logistic regression model that describes the dependence of the probability of diarrhea on the number of villus cells, we used data from the study of Jardi et al. 21 where diarrhea was assessed in mice by examination of the feces consistency. In agreement with the observations, the model recapitulated high and medium risk of diarrhea during the high and low dose of 5‐FU treatment, respectively. This risk decreased to null values at the end of the recovery period (Figure 3b). Diarrhea events were not observed in mice treated with doxorubicin, which could be due to the limited epithelial injury observed at the assayed exposures and/or the limited number of cycles administered to mice.
In summary, using mouse data, we extended our model of epithelial dynamics to predict other processes affected by the disruption of the epithelium and of clinical relevance.
A model of the human small intestinal epithelium enables the translation of mouse 5‐FU and doxorubicin induced toxicity into human epithelial toxicity and the prediction of clinical diarrhea risk
Our next step was to investigate the quantitative translation of mouse epithelial toxicity into human toxicity for 5‐FU and doxorubicin with a focus in predicting the incidence of clinical diarrhea reported for these drugs. We built a human small intestine epithelium model, which maintained the structural properties of the mouse epithelial model described in Figure 1 but it was parametrized according to publicly available information on cell composition and proliferation for the human ileum 30 (Table 1). We also generated simulations for 5‐FU and doxorubicin plasma concentration profiles for patients treated with relevant clinical dosing regimens using the Simcyp simulator. 26
We simulated the plasma concentration profile associated with the fortnightly administration of 5‐FU in a 46 h i.v. infusion regime resulting in plasma area under the curve (AUC) values of 18 and 28 mg.h/L (estimated as the constant plasma concentration during infusion multiplied by 46 h), which define an exposure range used in the clinic. 31 , 32 We also simulated the concentration profile associated with the i.v. administration of 450 mg of 5‐FU daily for 5 days every 28 days. 33 We assumed that 5‐FU cellular metabolism kinetics in humans is similar to that observed in mice and derived the concentration profile of several 5‐FU metabolites, including FUTP (Figure 4a). This enabled the prediction of the perturbation of stem and proliferative cells in the human crypt in response to FUTP exposure (Figure 4a). The crypt proliferation disturbance resulted in a deficit of cells in the villus and a decrease in circulating citrulline with both recovering baseline values in between treatments (Figure 4a). For the i.v. administration of 450 mg of 5‐FU, we predicted about a 35%–40% reduction of the villus length and a decrease of the citrulline level to values of 2500 ng/mL. Similarly, a 50% reduction in villus length has been associated with decreased levels of plasma citrulline of about 3500 ± 1500 ng/mL in human stem cell transplant recipients after intensive myeloablative therapy. 34 Moreover, the loss of barrier integrity led to the prediction of changes in the probability of diarrhea events during treatment and recovery (Figure 4a). The maximum value of this probability reflected the predicted incidence of diarrhea for that treatment, as defined in our mouse model of the intestinal epithelium. Our predicted clinical diarrhea incidence for the simulated infusion regimes with AUC values of 18 and 28 mg.h/L was of 4% and 25% (Figure 4a), respectively, which was in good agreement with the reported incidence for this treatment. 35 In particular, in a published clinical study with 155 patients treated with 46‐h continuous infusion of 5‐FU every 2 weeks, the reported clinical diarrhea incidence was 22% after the first cycle and reduced to about 12% in subsequent cycles after dose adjustments to achieve 18–28 mg.h/L AUC exposure. 32 For the 5‐FU i.v. bolus administration regime, the predicted diarrhea risk was remarkably higher and reached about 70%, which is close to the reported 58.2% incidence in clinical studies. 33
FIGURE 4.
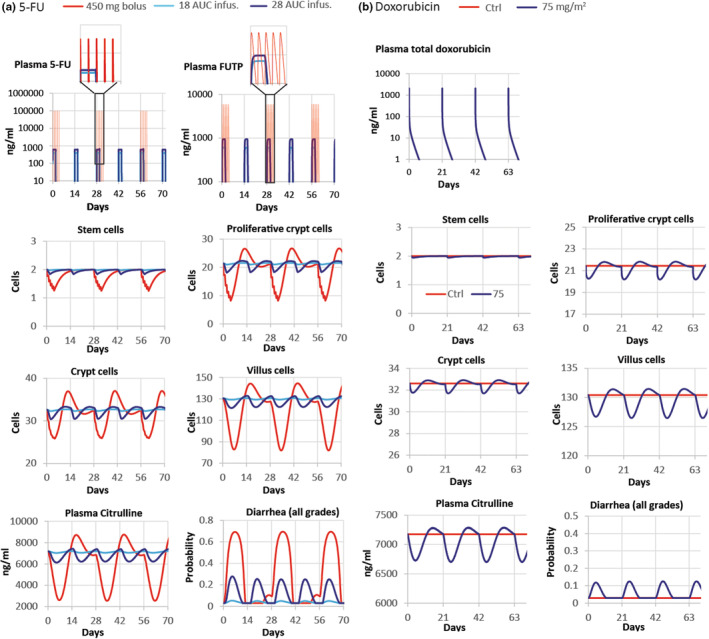
Clinical model predictions based in toxicity measured in mouse intestinal epithelium. Predicted tissue concentration of the compounds, number of stem, crypt proliferative and villus cells, plasma concentration of citrulline, and probability of diarrhea in patients treated with 46 h 5‐FU infusion regimes resulting in 18, or 28 AUC mg.h/L every 2 weeks and with 450 mg 5‐FU i.v. daily for 5 days every 28 days (a) as well as patients dosed with 75 mg/m2 doxorubicin i.v. bolus every 3 weeks (b). Proliferative crypt cells include stem cells and proliferative progenitors in the crypt. Crypt and villus cells refer to total cells including arrested and apoptotic cells in crypt and villus, respectively. 5‐FU, 5‐fluorouracil; Ctrl, control.
Likewise, we simulated the plasma concentration profile of doxorubicin in patients treated with 75 mg/m2, which is representative of high dose schedules, 36 and the dynamics of the epithelial processes responding to this profile (Figure 4b). The predicted disturbance of the epithelium was minor and milder than that predicted for 5‐FU treatment. Accordingly, the predicted incidence of diarrhea was also lower with values of 10%–15% (Figure 4b). These results are inconsistent with the incidence of clinical diarrhea reported in a study comprising 256 patients with advanced soft tissue sarcomas, 37 wherein about 13% of patients reported diarrhea events of low severity. However, higher incidences of 20% 38 and 30%, 39 have been reported in other studies. Other regimes, such as i.v. infusion, 40 or delivery formulations, such as liposomal doxorubicin, 41 result in reduced exposure of doxorubicin and diminished clinical diarrhea incidence. 40 , 42 , 43
In conclusion, our model for the human epithelium based on preclinical toxicity measured in mice predicts the clinical diarrhea associated with 5‐FU and doxorubicin, demonstrating the possibility of applying mechanistic mathematical models for translation of in vivo toxicity into clinical adverse effects.
Gefitinib exhibits no detectable epithelial toxicity in mice at clinically relevant doses
Next, we were interested in testing our modeling approach with molecular‐targeted agents such as epidermal growth factor receptor (EGFR)‐targeted therapies, commonly associated with clinical diarrhea. 2
Following our modeling strategy, guided by the Simcyp simulator 26 (Table 3) and tolerability studies for dose selection, we first generated data in mice dosed with 8 mg/kg of gefitinib by oral gavage, which achieved clinically relevant exposures, 44 , 45 as well as with 250 mg/kg of gefitinib, which resulted in considerably higher exposures, daily for 10 days.
The blood and tissue sampled during this treatment showed no toxicity in Olfm4+ cells or in the crypt compartment and no changes in plasma citrulline levels, which reflects the integrity of the epithelium, at any dose or timepoint (Figure S4).
Although we demonstrated that the cytotoxic activity of doxorubicin and 5‐FU in mice could be translated into the human intestinal injury to predict clinical diarrhea incidence, the lack of gefitinib‐induced intestinal toxicity in mice suggests that, regardless of the modeling approach, mice may not be a suitable preclinical experimental platform for other compounds with specific molecular targets and, thus, prone to exhibit cross‐species differences in activity. The suitability of experimental settings to quantify toxicity with accuracy is an important consideration of general application to the development of translational quantitative systems models.
DISCUSSION
The aim of this work was to develop translational modeling approaches that enable the prediction of clinical diarrhea risk associated with potentially efficacious dosing regimens at early stages of the drug development pipeline. To do this, we developed a compartmental model of the small intestinal epithelium and demonstrated translation of the mouse intestinal toxicity into human intestinal injury and clinical diarrhea incidence for 5‐FU and doxorubicin.
Epithelial injury in response to 5‐FU challenge has been shown to be induced by changes in RNA metabolism and mediated by the p53 pathway. 24 , 46 Accordingly, we observed a consistent transcriptional response of several genes belonging to the p53 pathway, upon 5‐FU challenge, in samples from mouse jejunum and colon as well as in human and mouse organoids derived from both small intestine and colon (Figure S3), which supports the cross‐setting translation of 5‐FU intestinal toxicity based on common molecular responses across GI preclinical experimental settings.
One of the challenges we found to integrate multiple sources of data was knowledge/data gaps connecting epithelial damage with clinical end points, such as diarrhea. Our epithelial model of organ physiology captures the basis of the organ disruption at the cell and tissue level. However, changes in clinical end points and symptoms caused by the organ disruption are not completely understood or straightforward to predict. To overcome knowledge/data gaps, we proposed a modeling solution that relates the number of cells in the villus with the probability of diarrhea and provides diarrhea risk predictions over time during drug‐induced injury and recovery. Alternatively, the fraction of damaged epithelial cells has been used to compare dosing schedules and to derive a threshold indicator of diarrhea. 15
When attempting to apply this approach to predict clinical diarrhea associated with gefitinib treatment, we found that the mouse was not a suitable experimental platform to quantify the effects of this compound on human epithelial dynamics. Mice treated daily for 10 days with the high dose of gefitinib, 250 mg/kg, reached concentrations of unbound compound in plasma of about 1453 ng/mL, considering 0.051 as the fraction of unbound compound to mouse plasma proteins, 47 but did not exhibit signs of epithelial damage or GI adverse effects. For reference, the reported incidence of clinical diarrhea in gefitinib clinical trials is about 27%–58% and 51%–75% in patients treated daily with 250 and 500 mg, respectively, 48 however, the maximum concentration of unbound plasma compound in those patients 44 , 45 is at least 50–100‐fold lower than that seen in our mice experiments.
Whereas 5‐FU and doxorubicin exhibit a broad spectrum of cytotoxic activities, 23 , 49 gefitinib is a TKI that impedes the phosphorylation of the intracellular component of the EGFR blocking downstream signaling pathways associated with cell proliferation and survival. 50 Cross‐species differences in toxicity could derive from dose–response differences associated with molecular discrepancies in the receptor or in any other molecule involved in this chain of events. In this regard, EGFR mutations often impact on treatment response and resistance. 48 However, in a study using in vitro mouse organoids, relatively high concentration of about 2200 mg/mL of gefitinib halted epithelial cell proliferation and resulted in reduced size organoids, 51 whereas lower concentrations were not assayed. Thus, further work is needed to assess potential differences in dose response between mouse and human epithelium. On a different note, the toxicological mechanism of TKIs induced diarrhea is poorly understood. For instance, dysregulation of ion transport and water absorption systems and alteration of intestinal motility 2 , 52 have been proposed as TKI‐associated toxicity mechanisms leading to diarrhea and could be the main source of cross‐species variability. These mechanisms are not currently implemented in our model and further work would be needed to model this type of diarrhea.
Altogether, we have built a translational modeling framework of the small intestine epithelium, focused on cell dynamics, that integrates heterogeneous epithelial‐related processes, and have demonstrated its application to translate in vivo intestinal toxicity into clinical outcomes. However, our work has also highlighted the importance of selecting experimental preclinical settings that are adequate to quantify drug‐induced clinical toxicity with precision. The impact of cross‐species differences on toxicity responses may be circumvented by the adoption of human‐derived intestinal organoids and microphysiological systems, which are being integrated into drug safety assessment strategies at a fast pace. Likewise, highly mechanistic models, such as the recently developed agent‐based model of the intestinal crypt, 53 comprising species specific differences in physiology could provide accurate clinical predictions at early stages of the drug development pipeline.
AUTHOR CONTRIBUTIONS
F.J., K.A.B., C.A.D., M.P., and C.P. wrote the manuscript. L.L., T.M.K., M.P., and C.P. designed the research. L.G., F.J., D.R., L.C., S.‐W.G., S.F., H.J., C.K., C.A.D., and C.P. performed the research. J.P., T.M.S., D.G.J.J., and C.P. analyzed the data.
CONFLICT OF INTEREST STATEMENT
C.P. and L.G. are employees and shareholders of AstraZeneca Plc. S.F. was an employee of Certara at the time this work was carried out. S.F. is now an employee of AstraZeneca Plc. H.J. is an employee and shareholder of Certara UK Limited. K.A.B. is an employee and shareholder of GSK. L.L. and F.J. are employees of Johnson & Johnson. L.L. is a shareholder of Johnson & Johnson. L.C. and S.‐W.C. are employees of Boehringer Ingelheim. All other authors declared no competing interests for this work.
Supporting information
Data S1
ACKNOWLEDGMENTS
The authors acknowledge financial support from TransQST consortium. This project has received funding from the Innovative Medicines Initiative 2 Joint Undertaking under grant agreement No. 116030. This Joint Undertaking receives support from the European Union's Horizon 2020 research and innovation program and EFPIA.
Gall L, Jardi F, Lammens L, et al. A dynamic model of the intestinal epithelium integrates multiple sources of preclinical data and enables clinical translation of drug‐induced toxicity. CPT Pharmacometrics Syst Pharmacol. 2023;12:1511‐1528. doi: 10.1002/psp4.13029
REFERENCES
- 1. Bloomingdale P, Housand C, Apgar JF, et al. Quantitative systems toxicology. Curr Opin Toxicol. 2017;4:79‐87. [DOI] [PMC free article] [PubMed] [Google Scholar]
- 2. Stein A, Voigt W, Jordan K. Chemotherapy‐induced diarrhea: pathophysiology, frequency and guideline‐based management. Ther Adv Med Oncol. 2010;2(1):51‐63. [DOI] [PMC free article] [PubMed] [Google Scholar]
- 3. Saltz LB, Cox JV, Blanke C, et al. Irinotecan plus fluorouracil and leucovorin for metastatic colorectal cancer. Irinotecan study group. N Engl J Med. 2000;343(13):905‐914. [DOI] [PubMed] [Google Scholar]
- 4. Saltz LB, Douillard JY, Pirotta N, et al. Irinotecan plus fluorouracil/leucovorin for metastatic colorectal cancer: a new survival standard. Oncologist. 2001;6(1):81‐91. [DOI] [PubMed] [Google Scholar]
- 5. Peters MF, Landry T, Pin C, et al. Human 3D gastrointestinal microtissue barrier function as a predictor of drug‐induced diarrhea. Toxicol Sci. 2018;168:3‐17. [DOI] [PMC free article] [PubMed] [Google Scholar]
- 6. McQuade RM, Stojanovska V, Donald E, Abalo R, Bornstein JC, Nurgali K. Gastrointestinal dysfunction and enteric neurotoxicity following treatment with anticancer chemotherapeutic agent 5‐fluorouracil. Neurogastroenterol Motil. 2016;28(12):1861‐1875. [DOI] [PubMed] [Google Scholar]
- 7. Secombe KR, van Sebille YZA, Mayo BJ, Coller JK, Gibson RJ, Bowen JM. Diarrhea induced by small molecule tyrosine kinase inhibitors compared with chemotherapy: potential role of the microbiome. Integr Cancer Ther. 2020;19:1534735420928493. [DOI] [PMC free article] [PubMed] [Google Scholar]
- 8. Barker N, van Es JH, Kuipers J, et al. Identification of stem cells in small intestine and colon by marker gene Lgr5. Nature. 2007;449(7165):1003‐U1. [DOI] [PubMed] [Google Scholar]
- 9. Wright NA, Alison MR. The Biology of Epithelial Cell Populations. Volume 2. Clarendon Press; 1984. [Google Scholar]
- 10. d'Onofrio A, Tomlinson IP. A nonlinear mathematical model of cell turnover, differentiation and tumorigenesis in the intestinal crypt. J Theor Biol. 2007;244(3):367‐374. [DOI] [PubMed] [Google Scholar]
- 11. Tomlinson IPM, Bodmer WF. Failure of programmed cell‐death and differentiation as causes of tumors—some simple mathematical‐models. PNAS USA. 1995;92(24):11130‐11134. [DOI] [PMC free article] [PubMed] [Google Scholar]
- 12. Muraro D, Parker A, Vaux L, et al. Chronic TNFalpha‐driven injury delays cell migration to villi in the intestinal epithelium. J R Soc Interface. 2018;15(145):20180037. [DOI] [PMC free article] [PubMed] [Google Scholar]
- 13. Johnston MD, Edwards CM, Bodmer WF, Maini PK, Chapman SJ. Mathematical modeling of cell population dynamics in the colonic crypt and in colorectal cancer. PNAS USA. 2007;104(10):4008‐4013. [DOI] [PMC free article] [PubMed] [Google Scholar]
- 14. Parker A, Maclaren OJ, Fletcher AG, et al. Cell proliferation within small intestinal crypts is the principal driving force for cell migration on villi. FASEB J. 2017;31(2):636‐649. [DOI] [PMC free article] [PubMed] [Google Scholar]
- 15. Shankaran H, Cronin A, Barnes J, et al. Systems pharmacology model of gastrointestinal damage predicts species differences and optimizes clinical dosing schedules. CPT Pharmacometr Syst Pharmacol. 2018;7(1):26‐33. [DOI] [PMC free article] [PubMed] [Google Scholar]
- 16. Pont AR, Yan KS. Intestinal crypts assume the fetal position in response to injury. Cell Stem Cell. 2018;23(2):158‐159. [DOI] [PubMed] [Google Scholar]
- 17. Büller NVJA, Rosekrans SL, Westerlund J, van den Brink GR. Hedgehog signaling and maintenance of homeostasis in the intestinal epithelium. Phys Ther. 2012;27(3):148‐155. [DOI] [PubMed] [Google Scholar]
- 18. Fragkos KC, Forbes A. Citrulline as a marker of intestinal function and absorption in clinical settings: a systematic review and meta‐analysis. United European Gastroenterol J. 2018;6(2):181‐191. [DOI] [PMC free article] [PubMed] [Google Scholar]
- 19. Suzuki K, Kanamori Y, Sugiyama M, et al. Plasma citrulline may be a good marker of intestinal functions in intestinal dysfunction. Pediatr Int. 2012;54(6):899‐904. [DOI] [PubMed] [Google Scholar]
- 20. Malik‐Sheriff RS, Glont M, Nguyen TVN, et al. BioModels‐15 years of sharing computational models in life science. Nucleic Acids Res. 2020;48(D1):D407‐D415. [DOI] [PMC free article] [PubMed] [Google Scholar]
- 21. Jardi F, Kelly C, Teague C, et al. Mouse organoids as an in vitro tool to study the in vivo intestinal response to cytotoxicants. Arch Toxicol. 2022;97:235‐254. [DOI] [PubMed] [Google Scholar]
- 22. Rodrigues D, de Souza T, Coyle L, et al. New insights into the mechanisms underlying 5‐fluorouracil‐induced intestinal toxicity based on transcriptomic and metabolomic responses in human intestinal organoids. Arch Toxicol. 2021;95(8):2691‐2718. [DOI] [PMC free article] [PubMed] [Google Scholar]
- 23. Longley DB, Harkin DP, Johnston PG. 5‐fluorouracil: mechanisms of action and clinical strategies. Nat Rev Cancer. 2003;3(5):330‐338. [DOI] [PubMed] [Google Scholar]
- 24. Pritchard DM, Watson AJ, Potten CS, Jackman AL, Hickman JA. Inhibition by uridine but not thymidine of p53‐dependent intestinal apoptosis initiated by 5‐fluorouracil: evidence for the involvement of RNA perturbation. Proc Natl Acad Sci USA. 1997;94(5):1795‐1799. [DOI] [PMC free article] [PubMed] [Google Scholar]
- 25. van der Flier LG, Haegebarth A, Stange DE, van de Wetering M, Clevers H. OLFM4 is a robust marker for stem cells in human intestine and marks a subset of colorectal cancer cells. Gastroenterology. 2009;137(1):15‐17. [DOI] [PubMed] [Google Scholar]
- 26. Jamei M, Marciniak S, Edwards D, et al. The simcyp population based simulator: architecture, implementation, and quality assurance. In Silico Pharmacol. 2013;1:9. [DOI] [PMC free article] [PubMed] [Google Scholar]
- 27. Bontenbal M, Andersson M, Wildiers J, et al. Doxorubicin vs epirubicin, report of a second‐line randomized phase II/III study in advanced breast cancer. EORTC breast cancer cooperative group. Br J Cancer. 1998;77(12):2257‐2263. [DOI] [PMC free article] [PubMed] [Google Scholar]
- 28. Curis E, Nicolis I, Moinard C, et al. Almost all about citrulline in mammals. Amino Acids. 2005;29(3):177‐205. [DOI] [PubMed] [Google Scholar]
- 29. Windmueller HG, Spaeth AE. Source and fate of circulating citrulline. Am J Physiol. 1981;241(6):E473‐E480. [DOI] [PubMed] [Google Scholar]
- 30. Potten CS, Kellett M, Rew DA, Roberts SA. Proliferation in human gastrointestinal epithelium using bromodeoxyuridine in vivo: data for different sites, proximity to a tumour, and polyposis coli. Gut. 1992;33(4):524‐529. [DOI] [PMC free article] [PubMed] [Google Scholar]
- 31. Gamelin E, Boisdron‐Celle M. Dose monitoring of 5‐fluorouracil in patients with colorectal or head and neck cancer—status of the art. Crit Rev Oncol Hematol. 1999;30(1):71‐79. [DOI] [PubMed] [Google Scholar]
- 32. Morawska K, Goirand F, Marceau L, et al. 5‐FU therapeutic drug monitoring as a valuable option to reduce toxicity in patients with gastrointestinal cancer. Oncotarget. 2018;9(14):11559‐11571. [DOI] [PMC free article] [PubMed] [Google Scholar]
- 33. Cassidy J, Twelves C, van Cutsem E, et al. First‐line oral capecitabine therapy in metastatic colorectal cancer: a favorable safety profile compared with intravenous 5‐fluorouracil/leucovorin. Ann Oncol. 2002;13(4):566‐575. [DOI] [PubMed] [Google Scholar]
- 34. Blijlevens NM, Lutgens LC, Schattenberg AV, Donnelly JP. Citrulline: a potentially simple quantitative marker of intestinal epithelial damage following myeloablative therapy. Bone Marrow Transplant. 2004;34(3):193‐196. [DOI] [PubMed] [Google Scholar]
- 35. Saif MW, Hashmi S, Zelterman D, Almhanna K, Kim R. Capecitabine vs continuous infusion 5‐FU in neoadjuvant treatment of rectal cancer. A retrospective review. Int J Colorectal Dis. 2008;23(2):139‐145. [DOI] [PubMed] [Google Scholar]
- 36. Ferguson JE, Dodwell DJ, Seymour AM, Richards MA, Howell A. High dose, dose‐intensive chemotherapy with doxorubicin and cyclophosphamide for the treatment of advanced breast cancer. Br J Cancer. 1993;67(4):825‐829. [DOI] [PMC free article] [PubMed] [Google Scholar]
- 37. Santoro A, Tursz T, Mouridsen H, et al. Doxorubicin versus CYVADIC versus doxorubicin plus ifosfamide in first‐line treatment of advanced soft tissue sarcomas: a randomized study of the European Organization for Research and Treatment of cancer soft tissue and bone sarcoma group. J Clin Oncol. 1995;13(7):1537‐1545. [DOI] [PubMed] [Google Scholar]
- 38. Tap WD, Papai Z, van Tine BA, et al. Doxorubicin plus evofosfamide versus doxorubicin alone in locally advanced, unresectable or metastatic soft‐tissue sarcoma (TH CR‐406/SARC021): an international, multicentre, open‐label, randomised phase 3 trial. Lancet Oncol. 2017;18(8):1089‐1103. [DOI] [PMC free article] [PubMed] [Google Scholar]
- 39. Tap WD, Wagner AJ, Schoffski P, et al. Effect of doxorubicin plus Olaratumab vs doxorubicin plus placebo on survival in patients with advanced soft tissue sarcomas: the ANNOUNCE randomized clinical trial. JAMA. 2020;323(13):1266‐1276. [DOI] [PMC free article] [PubMed] [Google Scholar]
- 40. Zalupski M, Metch B, Balcerzak S, et al. Phase III comparison of doxorubicin and dacarbazine given by bolus versus infusion in patients with soft‐tissue sarcomas: a southwest oncology group study. J Natl Cancer Inst. 1991;83(13):926‐932. [DOI] [PubMed] [Google Scholar]
- 41. Gabizon A, Shmeeda H, Barenholz Y. Pharmacokinetics of pegylated liposomal doxorubicin: review of animal and human studies. Clin Pharmacokinet. 2003;42(5):419‐436. [DOI] [PubMed] [Google Scholar]
- 42. Rom J, Bechstein S, Domschke C, et al. Efficacy and toxicity profile of pegylated liposomal doxorubicin (Caelyx) in patients with advanced breast cancer. Anticancer Drugs. 2014;25(2):219‐224. [DOI] [PubMed] [Google Scholar]
- 43. Green AE, Rose PG. Pegylated liposomal doxorubicin in ovarian cancer. Int J Nanomed. 2006;1(3):229‐239. [PMC free article] [PubMed] [Google Scholar]
- 44. Kawata T, Higashimori M, Itoh Y, et al. Gefitinib exposure and occurrence of interstitial lung disease in Japanese patients with non‐small‐cell lung cancer. Cancer Chemother Pharmacol. 2019;83(5):849‐858. [DOI] [PMC free article] [PubMed] [Google Scholar]
- 45. Chen Y, Zhou D, Tang W, Zhou W, Al‐Huniti N, Masson E. Physiologically based pharmacokinetic modeling to evaluate the systemic exposure of Gefitinib in CYP2D6 Ultrarapid metabolizers and extensive metabolizers. J Clin Pharmacol. 2018;58(4):485‐493. [DOI] [PubMed] [Google Scholar]
- 46. Harris SL, Levine AJ. The p53 pathway: positive and negative feedback loops. Oncogene. 2005;24(17):2899‐2908. [DOI] [PubMed] [Google Scholar]
- 47. Li J, Brahmer J, Messersmith W, Hidalgo M, Baker SD. Binding of gefitinib, an inhibitor of epidermal growth factor receptor‐tyrosine kinase, to plasma proteins and blood cells: in vitro and in cancer patients. Invest New Drugs. 2006;24(4):291‐297. [DOI] [PubMed] [Google Scholar]
- 48. Hirsh V, Blais N, Burkes R, Verma S, Croitoru K. Management of diarrhea induced by epidermal growth factor receptor tyrosine kinase inhibitors. Curr Oncol. 2014;21(6):329‐336. [DOI] [PMC free article] [PubMed] [Google Scholar]
- 49. Tacar O, Sriamornsak P, Dass CR. Doxorubicin: an update on anticancer molecular action, toxicity and novel drug delivery systems. J Pharm Pharmacol. 2013;65(2):157‐170. [DOI] [PubMed] [Google Scholar]
- 50. Herbst RS, Fukuoka M, Baselga J. Gefitinib—a novel targeted approach to treating cancer. Nat Rev Cancer. 2004;4(12):956‐965. [DOI] [PubMed] [Google Scholar]
- 51. Basak O, Beumer J, Wiebrands K, Seno H, van Oudenaarden A, Clevers H. Induced quiescence of Lgr5+ stem cells in intestinal organoids enables differentiation of hormone‐producing Enteroendocrine cells. Cell Stem Cell. 2017;20(2):177‐190 e4. [DOI] [PubMed] [Google Scholar]
- 52. Rugo HS, Di Palma JA, Tripathy D, et al. The characterization, management, and future considerations for ErbB‐family TKI‐associated diarrhea. Breast Cancer Res Treat. 2019;175(1):5‐15. [DOI] [PMC free article] [PubMed] [Google Scholar]
- 53. Gall L, Duckworth CA, Jardi F, et al. Homeostasis, injury and recovery dynamics at multiple scales in a self‐organizing intestinal crypt. https://wwwbiorxivorg/content/101101/20221218520934v1 2022. [DOI] [PMC free article] [PubMed]
- 54. Schepers AG, Vries R, van den Born M, van de Wetering M, Clevers H. Lgr5 intestinal stem cells have high telomerase activity and randomly segregate their chromosomes. EMBO J. 2011;30(6):1104‐1109. [DOI] [PMC free article] [PubMed] [Google Scholar]
- 55. Sundquist T, Moravec R, Niles A, O'Brien M, Riss T. Timing your apoptosis pathway. Cell Notes. 2006;16:18‐21. [Google Scholar]
- 56. Moinard C, Nicolis I, Neveux N, Darquy S, Benazeth S, Cynober L. Dose‐ranging effects of citrulline administration on plasma amino acids and hormonal patterns in healthy subjects: the Citrudose pharmacokinetic study. Br J Nutr. 2008;99(4):855‐862. [DOI] [PubMed] [Google Scholar]
- 57. Hanke N, Teifel M, Moj D, et al. A physiologically based pharmacokinetic (PBPK) parent‐metabolite model of the chemotherapeutic zoptarelin doxorubicin‐integration of in vitro results, phase I and phase II data and model application for drug‐drug interaction potential analysis. Cancer Chemother Pharmacol. 2018;81(2):291‐304. [DOI] [PubMed] [Google Scholar]
- 58. Kalvass JC, Maurer TS, Pollack GM. Use of plasma and brain unbound fractions to assess the extent of brain distribution of 34 drugs: comparison of unbound concentration ratios to in vivo p‐glycoprotein efflux ratios. Drug Metab Dispos. 2007;35(4):660‐666. [DOI] [PubMed] [Google Scholar]
- 59. Rodgers T, Leahy D, Rowland M. Physiologically based pharmacokinetic modeling 1: predicting the tissue distribution of moderate‐to‐strong bases. J Pharm Sci. 2005;94(6):1259‐1276. [DOI] [PubMed] [Google Scholar]
- 60. Rodgers T, Rowland M. Physiologically based pharmacokinetic modelling 2: predicting the tissue distribution of acids, very weak bases, neutrals and zwitterions. J Pharm Sci. 2006;95(6):1238‐1257. [DOI] [PubMed] [Google Scholar]
- 61. van Asperen J, van Tellingen O, Tijssen F, Schinkel AH, Beijnen JH. Increased accumulation of doxorubicin and doxorubicinol in cardiac tissue of mice lacking mdr1a P‐glycoprotein. Br J Cancer. 1999;79(1):108‐113. [DOI] [PMC free article] [PubMed] [Google Scholar]
- 62. Sugano K. Computational oral absorption simulation for low‐solubility compounds. Chem Biodivers. 2009;6(11):2014‐2029. [DOI] [PubMed] [Google Scholar]
- 63. Bi Y, Deng J, Murry DJ, An G. A whole‐body physiologically based pharmacokinetic model of Gefitinib in mice and scale‐up to humans. AAPS J. 2016;18(1):228‐238. [DOI] [PMC free article] [PubMed] [Google Scholar]
- 64. Wang S, Guo P, Wang X, Zhou Q, Gallo JM. Preclinical pharmacokinetic/pharmacodynamic models of gefitinib and the design of equivalent dosing regimens in EGFR wild‐type and mutant tumor models. Mol Cancer Ther. 2008;7(2):407‐417. [DOI] [PubMed] [Google Scholar]
Associated Data
This section collects any data citations, data availability statements, or supplementary materials included in this article.
Supplementary Materials
Data S1