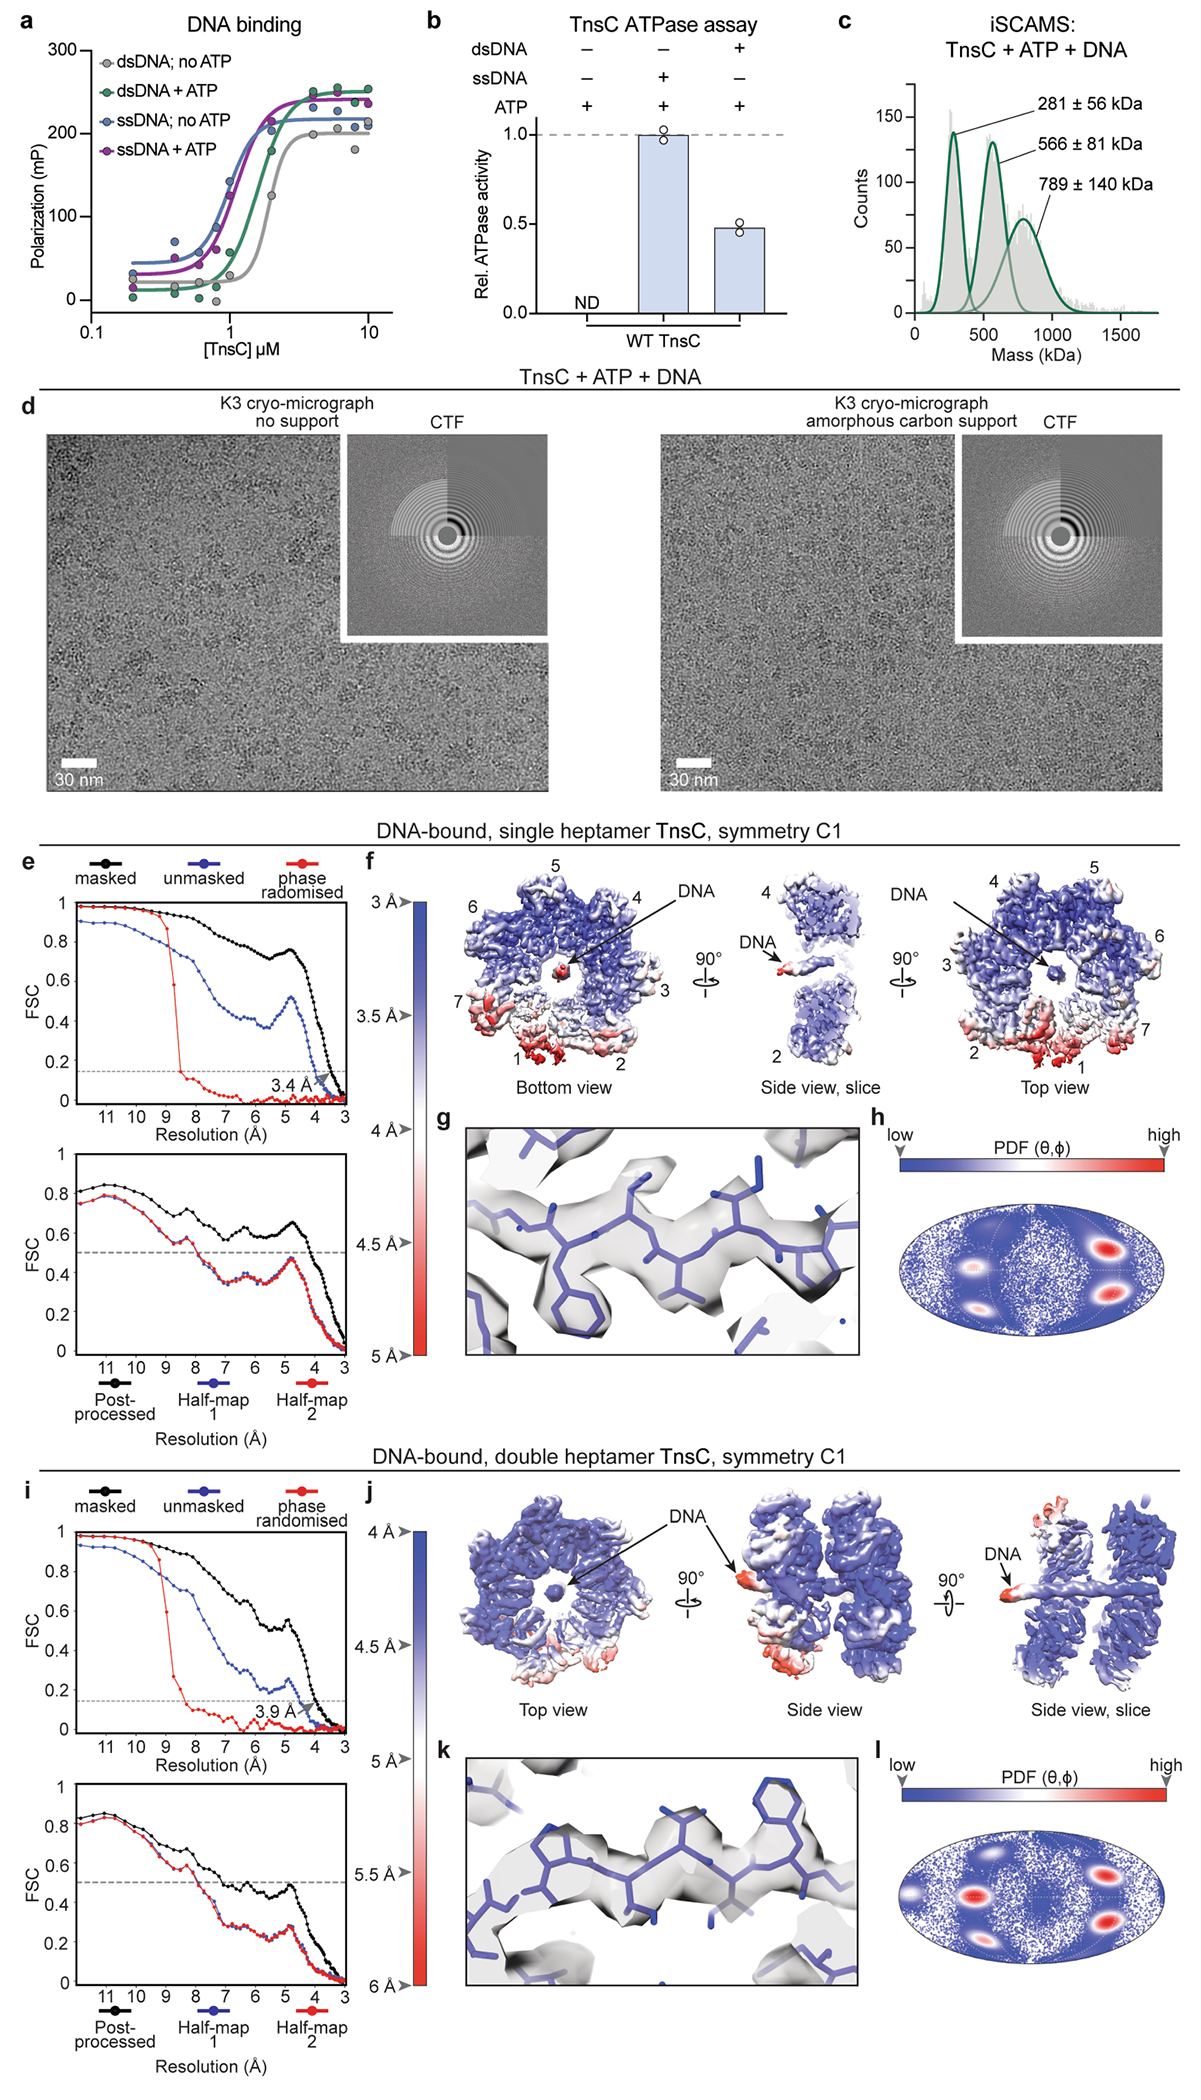
Extended Data Fig. 8 |. DNA binding, representative micrographs, Fourier Shell Correlation curves, local resolution, and representative densities for DNA-bound TnsC.

a, DNA binding by TnsC as measured by fluorescence polarization, tested with ssDNA and dsDNA substrates +/− ATP. Data are shown as mean ± s.d. of n = 2 experimental replicates. b, ATPase activity of TnsC in the absence or presence of ssDNA and dsDNA; ND, not detected. Data are shown as mean ± s.d. of n = 2 technical replicates. c, iSCAMS analysis of a TnsC sample after incubation with ATP and dsDNA reveals three distinct high-molecular-weight species, in good agreement with the DNA-bound single, double, and triple heptameric rings observed by cryo-EM. d, Representative cryo-micrographs for the DNA-bound TnsC sample at various defoci; the corresponding CTF is shown at the top right for each panel. e–h, DNA-bound single heptamer complex. i–l, DNA-bound double heptamer complex. e,i, Fourier Shell Correlation (FSC) curves (top) computed for the final independently refined half-maps before masking (blue), after masking (black), and after phase randomization (red). The final resolution by the FSC-0.143 criteria is 3.46 Å (single heptamer) and 3.9 Å (double heptamer) for the refinement without symmetry impositions. The bottom graph shows a model-map FSC curve (black line) and model overfitting test performed by randomly displacing 0.5 Å of the atomic coordinates of the final model and re-refining the displaced coordinates against half-map 1. The coincidence of the blue curve (FSC against half-map 1) with the red curve (FSC against half-map 2, not included in the refinement) guarantees the absence of overfitting in the original model. f,j, Unsharpened maps coloured according to local resolution calculations shown in orthogonal orientations. g,k, Representative final cryoEM densities from the post-processed maps, with the refined model represented as sticks. h,l, Mollweide diagrams showing the Euler angle distribution for the final refined maps, coloured according to the density distribution.
