ABSTRACT
Sleep is so important, particularly for the elderly. The lack of sleep may increase the risk of cognitive decline. Similarly, it may also increase the risk of Alzheimer’s disease. Nonetheless, many people underestimate the importance of getting enough rest and sleep. In-laboratory polysomnography is the gold-standard method for assessing the quality of sleep. This method is considered impractical in the clinical environment, seen as labour-intensive and expensive owing to its specialised equipment, leading to long waiting lists. Hence, user-friendly (remote and non-intrusive) devices are being developed to help patients monitor their sleep at home. In this paper, we first discuss commercially-available non-wearable devices that measure sleep, in which we highlight the features associated with each device, including sensor type, interface, outputs, dimensions, power supply, and connectivity. Second, we evaluate the feasibility of a non-wearable device in a free-living environment. The deployed device comprises a sensor mat with an integrated micro-bending multimode fibre. Raw sensor data were gathered from five senior participants living in a senior activity centre over a few to several weeks. We were able to analyse the participants’ sleep quality using various sleep parameters deduced from the sensor mat. These parameters include the wake-up time, bedtime, the time in bed, nap time. Vital signs, namely heart rate, respiratory rate, and body movements, were also reported to detect abnormal sleep patterns. We have employed pre-and post-surveys reporting each volunteer’s sleep hygiene to confirm the proposed system’s outcomes for detecting the various sleep parameters. The results of the system were strongly correlated with the surveys for reporting each sleep parameter. Furthermore, the system proved to be highly effective in detecting irregular patterns that occurred during sleep.
KEYWORDS: Sleep monitoring, smart home devices, User-Friendly devices, contactless sensors, ballistocardiography, heart rate, respiratory rate
1. Introduction
Sleep disorders can lead to a large economic burden among seniors, where patients, payers, and society will bear the costs (Mohit & Wickwire, 2020). In 2016, economic predictions showed that (i.e., in absolute terms) the yearly economic loss attributable to sleep deprivation adds up to around $411 billion in the USA alone. This loss reached $433 billion in 2020 and is expected to reach $456 billion in 2030 (Hafner et al., 2017). Seniors experience more sleep disorders than younger adults deteriorating their quality and quantity of sleep more. Cardiometabolic ills (e.g., type 2 diabetes and cardiovascular diseases), neurodegenerative diseases (e.g., Parkinson’s and Alzheimer’s diseases), and psychiatric disorders (e.g., depression and anxiety) are some examples of serious medical conditions affecting seniors due to sleeplessness (Cooke & Ancoli-Israel, 2011). Patients with sleep-disordered breathing, viz., obstructive sleep apnoea need to attend an in-laboratory sleep study, also known as polysomnography (PSG). The PSG is a multi-parametric test that requires placing numerous collections of surface electrodes on the patient’s body for recording various vital signs such as the electrocardiogram (ECG) and photoplethysmogram (PPG). Patients typically spend the night in a sleep laboratory, i.e., a controlled setting under the continued supervision of a sleep technician (Faust et al., 2019; Perez-Pozuelo et al., 2020). Although PSG results are clinically approved, such a method is intrusive, time-consuming, fairly expensive (on average $1,500-$2,000 per night in the USA (Arnal et al., 2020)), and resource-intensive. Besides, health personnel cannot track changes in seniors’ health status unless they attend another consultation, i.e., hospital settings may not be appropriate for long-term data monitoring. This scenario may not be optimal for senior adults due to their age-related health issues. As a result, there is a need for remote health care monitoring via the internet of things (IoT) enabled devices that allow health personnel to monitor many seniors simultaneously in their own homes.
IoT technology is rapidly evolving both in terms of software applications and hardware devices. Hence, long-term, and remote monitoring of vital signs during sleep is now possible at a reasonable cost. These days, vital signs, particularly heart rate and heart rate variability, can be measured in various ways. Wearable technologies, including smartwatches, smart bracelets, smart clothing (Breteler et al., 2020; Camcı et al., 2019; Liu et al., 2019), can be used efficiently to achieve such a task (Figure 1). Wearables can continuously monitor a broad range of patient vital signs; however, they bring about a few cons, e.g., battery life, skin irritation, and inadequate waterproofing. These issues can limit their benefits for patients diagnosed with age-related diseases (Ye et al., 2019). Although healthcare systems have not yet seen the value of wearable sensors in clinical practice, the trends in vital signs they provide can help predict health problems and allow caregivers to intervene if needed in emergencies (‘Getting real with wearable data’, 2019).
Figure 1.
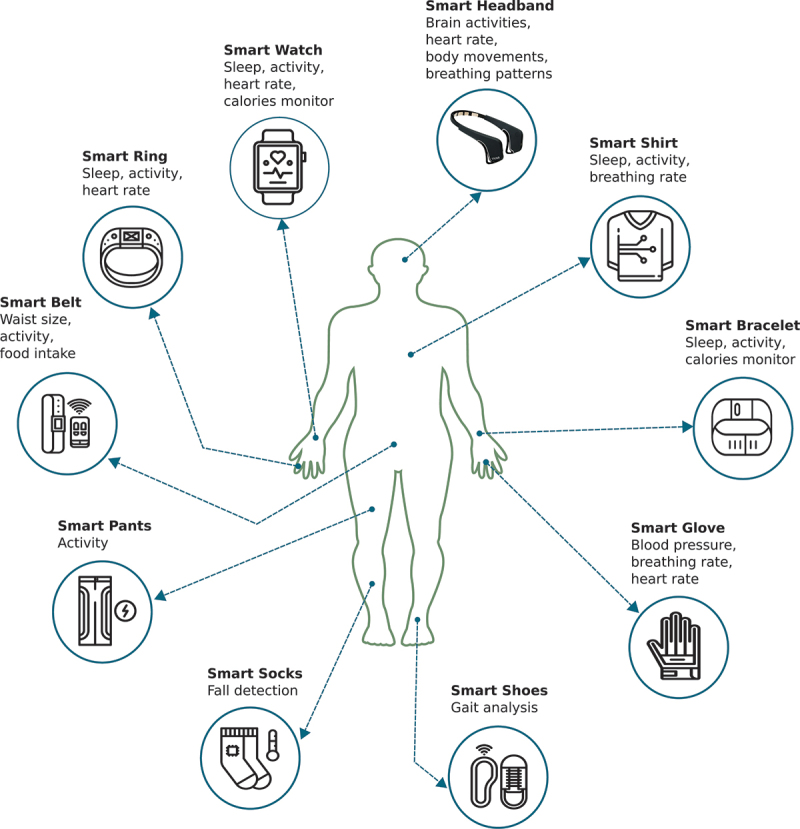
An illustration of the location of the various wearable devices being used for remote monitoring of healthcare.
Nonwearable technologies can also be used for remote monitoring of body functions, more specifically, sleep and sleep quality. These sensors are of great interest to medical doctors due to their simplicity and convenience of use. No electrodes are attached to patients’ bodies; to illustrate, patients only need to place a sensor under the bed cover or the bed mattress, and their sleep is going to be monitored continuously. More recently, vital signs, namely heart rate, and respiratory rate were measured during sleep using an off-the-shelf Wi-Fi device (Liu et al., 2018). This feature is paramount for patients diagnosed with chronic conditions, seniors, and those requiring constant care (e.g., chronically ill patients; Chacko & Hayajneh, 2018). These sensors adopt the so-called ballistocardiography (BCG) that is comparable with the ECG signal. However, it measures the heart’s mechanical events rather than its electrical ones (Faust et al., 2018; Vollmer et al., 2014).
Researchers have deployed BCG signals to measure particular vital signs in the literature, including heart rate, breathing, and body movements. As BCG can elaborate on these vitals, it has been exploited to monitor sleep and sleep quality. Remote and continuous monitoring of heart rate and respiratory rate can help assess sleep quality, sleep disorders, and general health (Jayarathna et al., 2020; Zhu et al., 2019). This subsequently allows caregivers to recognise health issues early and take appropriate action (Malasinghe et al., 2019; Pan et al., 2020). Having said that, among otherwise healthy people, there is no consensus among experts regarding some indicators of sleep quality (Conte et al., 2021). Nevertheless, the latest report by the “National Sleep Foundation” in 2017 published the key determinants of good quality sleep as follows: sleeping more time while in bed (at least 85 percent of the total time), falling asleep in thirty minutes or less, waking up no more than once per night; being awake for twenty minutes or less after initially falling asleep (Ohayon et al., 2017).
Given the importance of remote monitoring of sleep, the motive of this paper is to evaluate the performance of an under-mattress sleep tracker, i.e., a microbend fibre optic sensor (MFOS) for detecting anomalies/abnormalities in sleep parameters for senior adults in a free-living environment. The sleep parameters included in this work are wake-up time, bedtime, nap time, time in bed, heart rate, and respiratory rate. The contribution of this work is mainly focused on continuous monitoring of sleep parameters and early detection of anomalies by trending these parameters over time. Upon detecting an anomaly, we send a notification to caregivers via a user-friendly interface during which appropriate actions in compliance with seniors’ health/social situation can be taken. The research question that drives this study was initiated by seniors’ caregivers, in which they asked, “can we measure seniors’ basic sleep parameters (i.e., wake-up time, bedtime, time in bed, and vital signs) using less intrusive sensors as possible without invasion of privacy, i.e., using video and voice recording”? To answer this question, the contribution of this work is fourfold: (1) We proposed an IoT-based cost-effective sensor mat for contactless monitoring of sleep quality. (2) We validated our sensor in a free-living environment using data obtained from five senior adults. (3) We designed a user-friendly interface to make our findings accessible to caregivers and family members. (4) We designed a Mobile App to monitor participants’ daily activities and moods. Before elaborating on the proposed framework to monitor seniors’ sleep parameters, we briefly address off-the-shelf contactless sleep trackers, namely Emfit QS, Beddit, Withings, Sleepace Reston, and Beautyrest in an attempt to make the reader aware of existing trackers in the market and also to highlight the characteristics of each tracker whenever possible.
2. Contactless sleep monitoring
Among other things, bed-based BCG technology is a comfortable and contactless method for detecting body functions, i.e., heart rate and respiratory rate. Therefore, various tech companies like Apple and Withings are increasingly using such technology along with artificial intelligence, machine learning to help people monitor their sleep at home. Examples of BCG-based sleep trackers are Emfit QS, Beddit, Withings, Sleepace Reston, and Beautyrest. Figure 2 shows three examples of consumer sleep trackers. Somnofy is another example of a contactless sleep tracker that uses radar-based technology to classify sleep stages (Choi et al., 2020; Toften et al., 2020). Companies using contactless sleep trackers claim to provide users with sleep duration, quality of sleep, and smart alarm (i.e., it is a feature to help users wake up only during light sleep). The data collected from sleep trackers are usually unintended for routine diagnosis of sleep disorders. Yet, researchers were able to accommodate such data for clinical purposes using highly sophisticated machine learning and signal processing algorithms (Faust et al., 2018).
Figure 2.

Some examples of consumer bed-based sleep trackers; (a) Beautyrest™, (b) earlySense™, and (c) Withings™.
Contactless sensors have unique packaging designs. In other words, users will not feel their presence that undoubtedly reduces physiological and psychological constraints on monitored users (Wang et al., 2019). This unique design allows their integration into house fittings such as bed-mattresses, chairs, cushions, and sometimes into modified weighing bathroom scales (Liu et al., 2019; Massaroni et al., 2021; Wiens & Inan, 2015; Zhang et al., 2018). Compared to traditional sensors (e.g., ECG or PPG), these sensors are best suited for long-term monitoring of vital signs. They can present detailed information about trends in physiological parameters that allow healthcare providers to identify unusual patterns in their early stages, reducing the probability of life-threatening complications (Cerrato & Halamka, 2019; Despins et al., 2020). They are also convenient, mobile, and affordable. Hence, their implementation does not require too much time. Despite their unique features, they are not yet ready for urgent and ambulatory situations. As a result, in these situations, gold-standard methods must be used (Sadek & Abdulrazak, 2021; Sadek et al., 2019).
Additional information on contactless sensors is available in (Supp). Table 1 shows five examples of contactless sleep trackers that use BCG technology to monitor sleep as well as vital signs. To this end, we describe, in the next sections, the characteristics of the proposed MFOS. Besides, we explain how it has been deployed in a free-living environment with five senior residents to monitor their sleep parameters over a few to several weeks.
Table 1.
Examples of IoT consumer sleep trackers and their features, including sensor type, interface, outputs, dimensions, power supply, and connectivity. The specs provided in this table were drawn from vendors’ web-pages as given in the footnotes of the table.
| Features | Emfit QS* | Beddit† | Withings‡ | Sleepace Reston§ | Beautyrest** |
|---|---|---|---|---|---|
| Breathing disturbances | ❌ | ❌ | ✔ | ❌ | ❌ |
| Heart rate | ✔ | ✔ | ✔ | ✔ | ✔ |
| Heart rate variability | ✔ | ❌ | ❌ | ❌ | ❌ |
| Respiration | ✔ | ✔ | ✔ | ✔ | ✔ |
| Sleep and wakeup time | ✔ | ✔ | ✔ | ✔ | ✔ |
| Sleep efficiency | ❌ | ✔ | ✔ | ❌ | ❌ |
| Sleep interruptions | ✔ | ✔ | ✔ | ✔ | ✔ |
| Sleep score | ✔ | ❌ | ✔ | ✔ | ✔ |
| Smart alarm | ❌ | ✔ | ✔ | ✔ | ✔ |
| Snoring duration | ❌ | ✔ | ✔ | ❌ | ❌ |
| Sleep stages | Deep, light & REM | Light, deep | Deep, light & REM | Light, deep | Deep, light & REM |
| Sensor Type | Electromechanical film sensor | Piezoelectric force sensor | Piezoelectric force sensor | Piezoelectric force sensor | Piezoelectric force sensor |
| Interface | Web application | iOS app | iOS and Android apps | iOS and Android apps | iOS and Android apps |
| Dimension | Sensor: 6 × 56 cm Cable: 1.8 m |
Sensor: 780 x 65 × 2 mm Cable: 2.4 m |
Sensor: 637 x 190 × 5 mm |
Sensor: 34.6 x 2.6 × 0.08 in |
Sensor: 3.5 x 3.2 × 1 in |
| Connectivity | Wi-Fi | Bluetooth | Bluetooth | Bluetooth | Wi-Fi |
| Power | Power adapter | Power adapter | Power adapter | Battery | Power adapter |
3. Methodology
In this study, we focused on the BCG to remotely monitor sleep. The BCG sensors installed under the bed mattress help monitor the following sleep-related parameters: heart rate, respiratory rate, and body movements, as discussed in Section 2. Put differently, the force applied to the sensor mat is the summation of three sources. This force is caused by gross body movements and chest wall movement because of respiration and cardioballistic effect (i.e., the recoil of the body due to heart pulse; Klap & Shinar, 2013). Thus, the very first step to analyse BCG signals is to extricate each source separately. The gross body movements are characterised by an extensive variation in the signal amplitude. These movements, for example, can be detected using the variance or the standard deviation of the signal (i.e., using windowing) because their amplitudes will be large as against motion-free signal. Body movements typically occur during sleep. However, increasing their frequency can be an indicator of a sleep disorder, e.g., a periodic limb movement disorder (PLMD). Body movement has been reported to be among the most common causes of sleep disorders (Romero-Peralta et al., 2019). It affects 3 to 10% of the general senior population and can be severe in up to 2–3%. Notwithstanding, it remains an underdiagnosed condition (Romero-Peralta et al., 2019).
The PSG is the formal method to diagnose this movement disorder similar to sleep apnoea (Al-Mardini et al., 2014; Sannino et al., 2014). However, recently, BCG signals have been employed to diagnose such disorders, and promising results have been achieved (Waltisberg et al., 2017). On the one hand, body movements can help detect sleep disorders, but in contrast, they badly affect the BCG signal quality, and so they have to be discarded before applying any algorithms for vital signs detection (Javaid et al., 2017). Once body movements are located and discarded, cardioballistic forces and respiratory efforts can be extracted using a band-pass filter of appropriate cut-off frequencies corresponding to each physiological signal. Figure 3 shows a common framework for analysing BCG signals to obtain heart rate and respiratory rate. In this study, we continuously collected raw sensor data from five senior residents (four females and one male).
Figure 3.
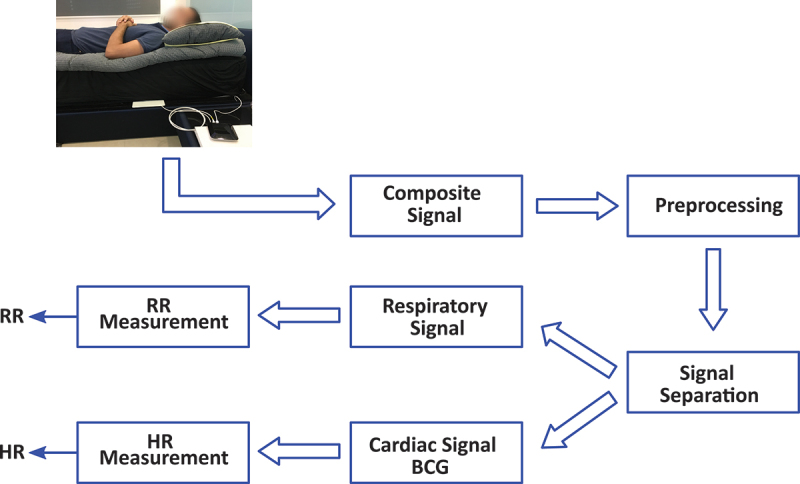
A common framework for processing BCG signals. The preprocessing step aims at discarding noninformative segments of the raw sensor data. Then, data about sleep and vital signs can be detected.
The sensor mat was placed under the bed mattress (i.e., in the upper part of the bed) for each resident. Two of the residents were used to sleep on a regular bed, but the other resident was used to sleep on a bamboo sleeping mat located on the floor. Consequently, the sensor mat was placed directly on the floor underneath the bamboo mat for this particular resident. This work was done as a part of the City4Age European project (http://www.city4ageproject.eu/) at which data from other sensors (including motion sensors and contact sensors) was collected (Figure 4).
Figure 4.
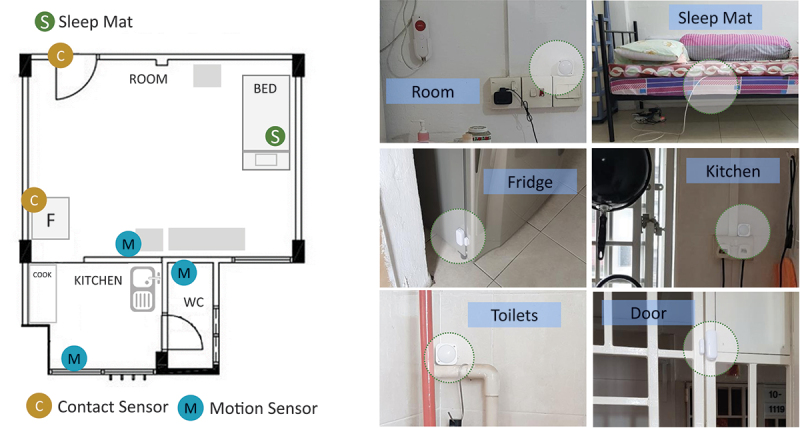
Distribution of the employed sensors in an HDB flat. Motion sensors were located in the living room, kitchen, and bathroom. The contact sensors were located on the main door and the fridge. The bed sensor mat was placed underneath the bed mattress.
The goal was to study the use of non-intrusive sensors to monitor health status behaviour changes (Aloulou et al., 2020). Three motion sensors were attached in each HDB1 flat such as one in the living room, a second one in the kitchen, and a third one in the bathroom. Moreover, a contact sensor was placed on the main door, and another one was placed on the fridge. To illustrate, opening the fridge and staying in the kitchen for a predefined time can infer that the resident is preparing a meal (i.e., nutrition aspect). Opening the main door can infer that the resident was expecting visitors or going outdoor (i.e., social aspect). That being said, we considered in this study only the fibre-optic sensor data to determine any changes in their typical sleep patterns. Sleep assessment was performed based on various parameters, namely heart rate, respiratory rate, body movements, wake up-time, bedtime, nap time, and time in bed. Additional information on the working operation of the proposed sensor mat and the common framework is available in (Supp).
4. Results and discussion
In this study, we investigated the data collected from five senior residents over a few to several days on a 24-hours a day basis (Sadek & Mohktari, 2018). Written informed consent was obtained from all residents involved in the study. Besides, we imposed no restrictions on the residents during the deployment time. The mandate of this study was to use as few intrusive devices to residents as possible. Accordingly, for validating our results, we gathered pre-and post-surveys from each resident about their living situation (i.e., living alone or with family members), wake-up time, bedtime, nap (Table 2). Along with the caregivers, we paid a visit to the residents once a week to discuss our findings and update the surveys if necessary. Hence, we could say that the data provided in Table 2 infer on average how each resident used to spend his/her day. In our analysis, wake-up time defines the time of leaving the bed; bedtime defines the time when people are preparing to sleep, and time in bed defines the total in bedtime, i.e., the time elapsed between bedtime and wake time.
According to the residents, the reported time was approximate.
Residents did not report chronic diseases or disabilities.
The first resident was used to sleep on a bamboo sleeping mat, the second resident was used to sleep in a double bed. However, she always used to sleep on one side of the bed. The third, fourth, and fifth residents sleep in a single bed.
Table 2.
The Living situation and sleep habits of each resident, namely average wake-up times, bedtimes, nap times. All recruited residents were females except the fifth resident, who was a male. The ages of the residents were 68, 69, 65, 90, and 70 years old, respectively. Additionally, the deployment time for each resident was 26, 38, 33, 38, and 77 days, respectively.
| Living Situation | Bedtime | Wake up Time | Nap Time | |
|---|---|---|---|---|
| Resident 1 | Alone | 23:00 − 0 | 07:00 Sometimes at 05:30 |
1 − 2 times 13:00 − 15:00 30 − 60 min |
| Resident 2 | Family | 21:00 − 23:00 | 07:00 Wednesday at 04:00 |
N/A |
| Resident 3 | Family | 18:30 − 19:30 Sometimes at 22:00 |
02:30 | 2 − 3 times 13:00 − 15:00 30 min |
| Resident 4 | Family | 20:00 − 21:00 | 07:00 | 2 − 3 times 12:00 − 15:00 30 − 60 min |
| Resident 5 | Family | 23:00 − 0 | 07:00 | N/A |
Modified Bland-Altman plots (BAPs) and boxplots were used to detect anomalies in the sleep parameters and determine to what extent our findings match the seniors’ surveys. For the BAPs, the idea was to define three limits, i.e., a mean, an upper limit of agreement (LoA), and a lower LoA as follows:
The first limit was the mean of the parameters of interest, e.g., wake-up time, bedtime, and time in bed.
The second limit was computed as follows: Mean(parameters) + 2 × SD(parameters).
The third limit was computed as follows: Mean(parameters) − 2 × SD(parameters).
By doing this, we can search for systematic bias or mean and identify any possible anomalies outside the two limits of agreements. For the wake-up times, the boxplots (Figure 5) show that the first and second residents had more anomalies compared to other residents.
Figure 5.
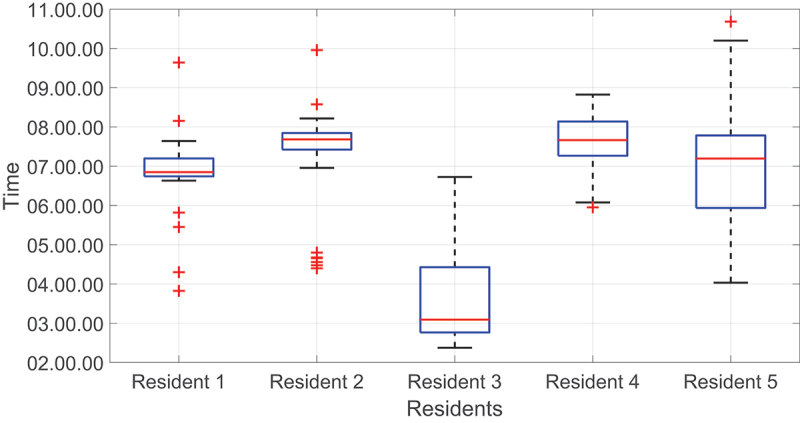
Boxplots of wake-up times for all residents. The red line represents the median value.
Although there were several anomalies for the first resident, most of them were within the two LoA; hence there were no critical points that require attention (Figure 6). The second resident, on average, used to wake up around 07: 18. The measured upper LoA was 09:45, and the lower LoA was 04:52. As seen, most of the wake-up times were around the mean line and lay within the two LoA except for Wednesdays. For these specific days, the resident used to wake up around 04:30 because she serves as a nurse and has an early morning shift on Wednesdays. These results agreed with the resident’s survey, in which the resident reported a wake-up time of around 07:00 for all days. However, on Wednesday, the resident reported a wake-up time of around 04:00; hence, detected anomalies were considered normal behaviour. Most importantly, we were able to detect unusual wake-up times thanks to the accumulation of data. This example highlights the importance of long-term data collection in detecting abnormal situations. Figure 7 represents the second resident’s wake-up times.
Figure 6.
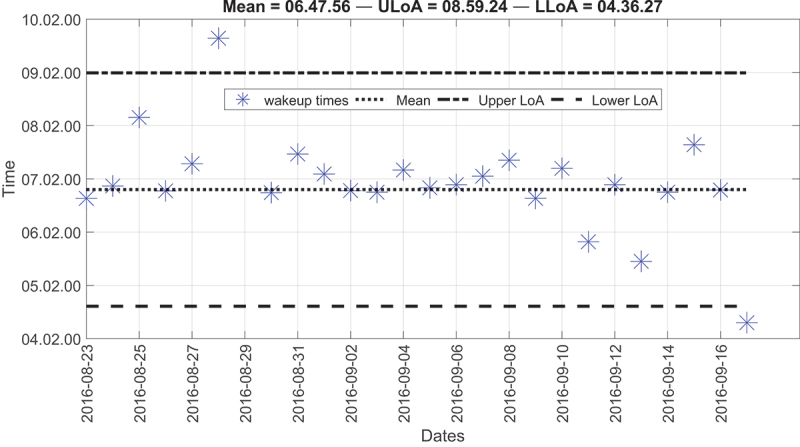
Modified Bland-Altman plot of the wake-up times for the first resident.
Figure 7.
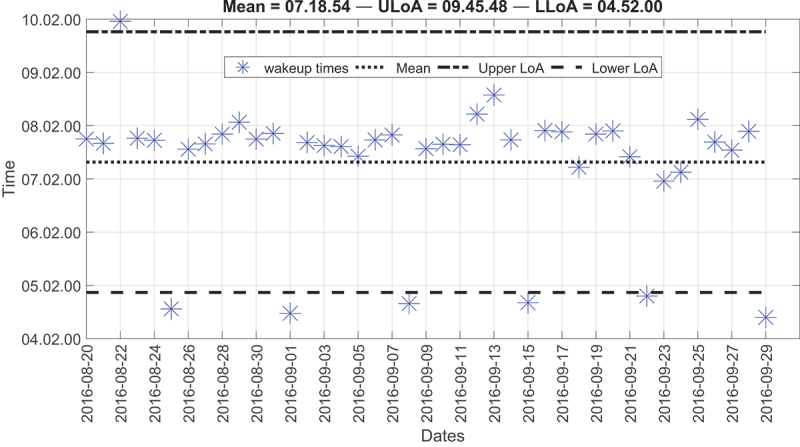
Modified Bland-Altman plot of the wake-up times for the second resident; all points that lie below the lower LoA (LLoA) represent Wednesdays.
The wake-up time for the third resident was very early compared to the other residents. As depicted by Figure 8, the average wake-up time around 03:30 also agreed with the resident’s survey. These wake-up times were surprising to us, but the resident confirmed that she woke up early to perform daily spiritual practices. Additionally, the resident reported having a nap two to three times between 13:00, 15:00. This also agreed with our results provided in Table 3, in which the average time for starting the nap was around 13:34:14, and the average time for ending the nap was around 15:09:59. Besides, the average nap duration was about one and a half-hour.
Figure 8.
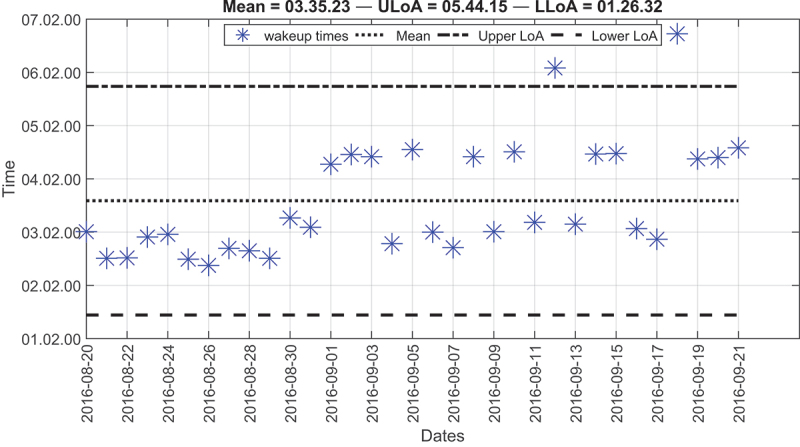
Modified Bland-Altman plot of the wake-up times for the third resident over deployment time.
Table 3.
Start and end of nap time for the third resident.
| Day | Start Nap | End Nap | Duration |
|---|---|---|---|
| 08/19/2016 | 13:16:29 | 15:42:29 | 2:26:00 |
| 08/22/2016 | 13:52:29 | 15:47:59 | 1:55:30 |
| 08/27/2016 | 12:37:59 | 14:49:29 | 2:11:30 |
| 08/29/2016 | 13:09:29 | 14:40:29 | 1:31:00 |
| 09/05/2016 | 13:40:59 | 14:30:59 | 0:50:00 |
| 09/07/2016 | 14:47:59 | 15:28:29 | 0:40:30 |
| Mean | 13:34:14 | 15:09:59 | 1:35:45 |
For the bedtimes, the fourth and fifth residents had more anomalies compared to other residents, as shown in Figure 9. We can also notice that the third resident had the earliest BT, i.e., around 18:00 among others, which was reasonable because the resident was adapted to wake up very early in the morning.
Figure 9.
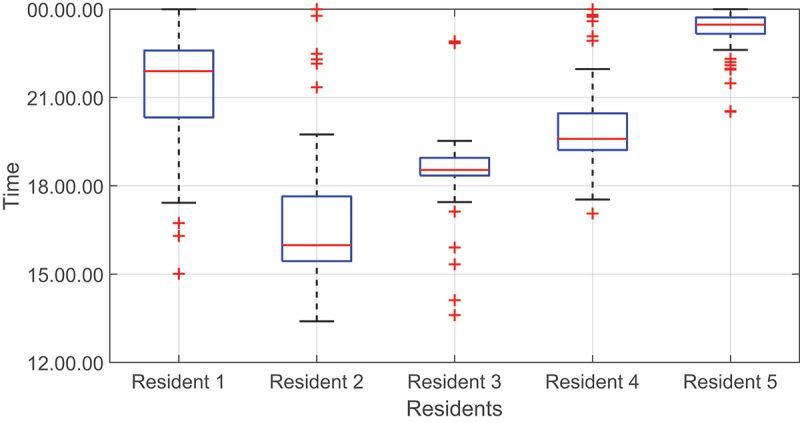
Boxplots of bedtimes for all residents. The red line represents the median value.
That is to say, Figure 10 shows the bedtimes for the third resident. For the most part, the resident went to bed at around 18:24. However, four bedtimes lay outside the two LoA. Two of these bedtimes were greater than the upper LoA, and the other two were smaller than the lower LoA. In the first case, the resident went to bed at around 22:50. This result agreed with the resident’s survey because the resident, on some occasions, reported a bedtime of around 22:00.
Figure 10.
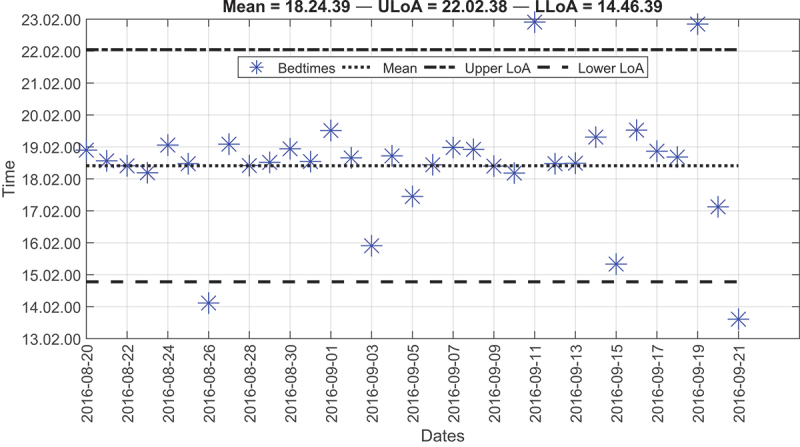
Modified Bland-Altman plot of the bedtimes for the third resident over the deployment time.
In the second case, the resident went to bed at around 13:50. For one day, the wake-up time was around 02:22, and for the other day, it was around 04:34. These two bedtimes flagged an alarm because the time in bed exceeded eight hours. This specific resident lived in a one-bedroom apartment, and she watched the television while sitting on a chair or lying down on the bed. Given this situation, the resident was most likely lying down on the bed for the entire day.
Although the third and fifth residents had several outliers, most of the points were around the mean line and within the two LoA (Figure 11). A few points lie below the LLoA, but they do not occur regularly. Thus, the resident might have gone to bed earlier than expected or might have been resting on the bed watching television. So far, we have shown how the LoA, and boxplots can identify anomalies in wake-up times and bedtimes. Still, the time in bed (TIB) is another critical factor that requires attention. On average, the TIB for all residents was 7.1, 12.5, 7.6, 11.5, and 7.9 hours, respectively. But we have detected that the second resident had the highest TIB, i.e., around 12 hours (Figure 12) compared to other residents, i.e., around 7 hours each.
Figure 11.
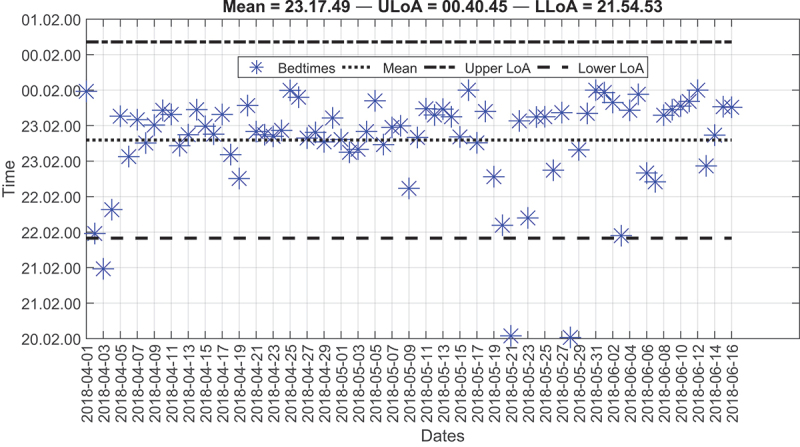
Modified Bland-Altman plot of the bedtimes for the fifth resident over the deployment time.
Figure 12.
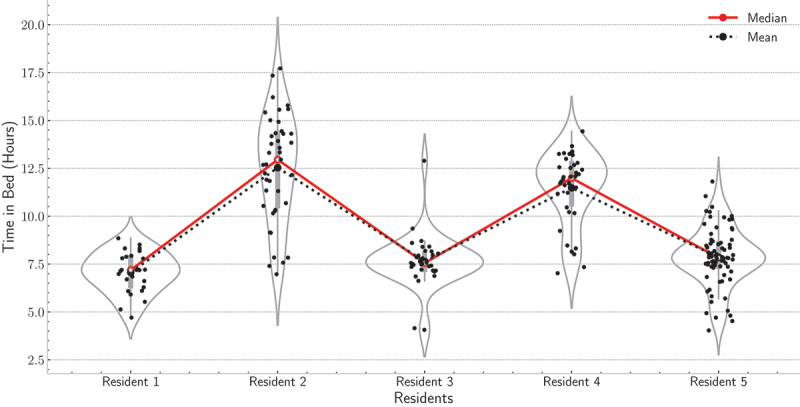
Violin plots of the time in bed for the five residents over deployment time.
The second resident was accustomed to sleeping on a bamboo sleep mat located on the floor because sleeping on the floor was cooler to her than the rest of the room. Based on the TIB, we notified the resident to practice more exercises as she spent a long time lying down on the mat while watching television. Following, to further check the sleep quality of the second resident, we used the sleep history (SH) measure introduced in (Park et al., 2021). As given by Eq. (1), it is a weighted average of TIB that captures an aggregate measure of sleep behaviour. As presented in Figure 13, the SH values were greater than 10 hours across the six weeks of deployment. The fourth resident had the same problem as the second resident; yet these values can be considered normal given the resident’s age, i.e., 90 years old. The analysis window (i.e., 7 days) can be shortened or extended to cope with every resident’s past medical history. If the aim were to make the system very sensitive for detecting sleep anomalies, we could have shortened the analysis window to a few days, e.g., 3 days. However, there could have been a high chance of increasing the false positives. Given the past medical history of current residents, we did not find it urgent to shorten the analysis window, and so, caregivers were updated daily about inferred parameters. But parameters were trended on a weekly and a monthly basis to detect anomalies as in the case of the third residents (i.e., waking up very early in the morning) and the second and fourth residents (i.e., longer TIB).
| (1) |
Figure 13.
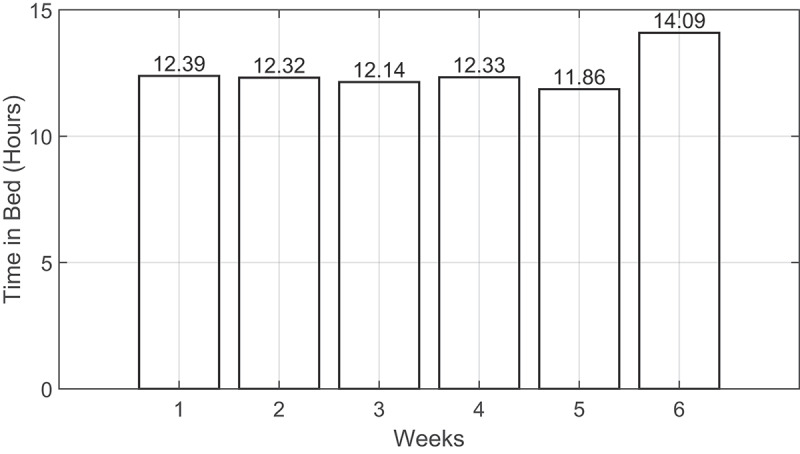
The sleep history distribution across the six weeks of deployment for the fourth resident.
For vital sign detection, BCG signals were used for heart rate estimation (beats per minute) using a sliding time window with a size of 30 seconds. Nevertheless, respiratory signals were used for respiratory rate estimation (breaths per minute) using a sliding time window with a size of 30 seconds. The second row of Figure 14 shows an example of a 30-second raw sensor data along with the derived respiratory signal. In this example, the respiratory cycles (i.e., inhalation and exhalation) are clearly presented, and all cycles were detected correctly.
Figure 14.
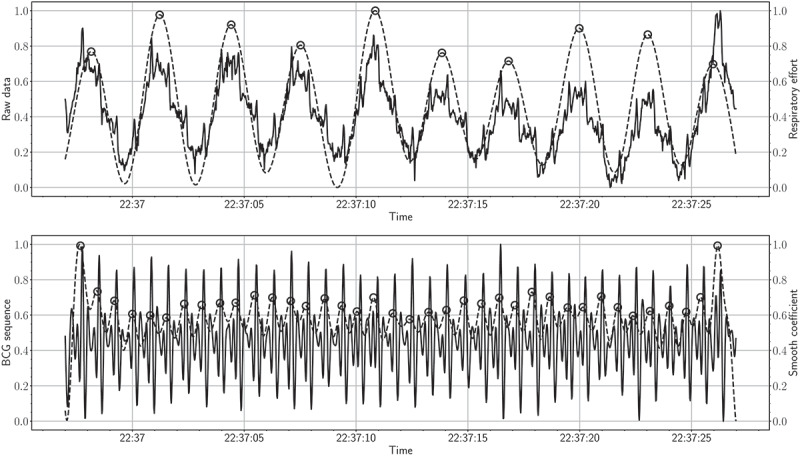
The top figure shows a 30-second raw signal along with the respiratory effort signal (solid and dashed lines present raw and respiratory data, respectively). The bottom figure shows a 30-second BCG signal along with the 4th level smooth coefficient (solid and dashed lines present BCG signal and smooth coefficient, respectively).
With that said, detecting respiratory cycles becomes challenging for individuals diagnosed with sleep-disordered breathing. The first row of Figure 17 shows an example of a 30-second BCG signal along with the 4th level smooth coefficient. As can be observed, the maxima of the smooth coefficient coincide with the “J-peak” of the BCG signal. Monitoring heart and respiratory rate variability over time are of utmost importance for predicting possible health changes, i.e., cardiovascular, and respiratory disorders. Recent studies showed that early detection of health changes, including heart rate, respiratory rate, and oxygen saturation, can lower the mortality rate of chronic respiratory diseases. Patients would be transferred to intensive care units if these measures are not within a normal range. Consequently, physicians and/or nurses can take proper actions (Aydemir et al., 2020; Sun et al., 2020). Figure 15 shows box plots of the heart rates for the first resident during the deployment time. As demonstrated by the box plots, the median heart rate for each day varied from 70 to 80 beats per minute. Besides, few outliers were detected for each day. These results indicated that the heart rate for this resident was almost evenly distributed across all days. By the same token, Figure 16 shows the box plots of the respiratory rates for the second resident during the deployment time. In this example, the median respiratory rate for each day varied from 15 to 20 breaths per minute. Also, few outliers were detected for each day.
Figure 17.
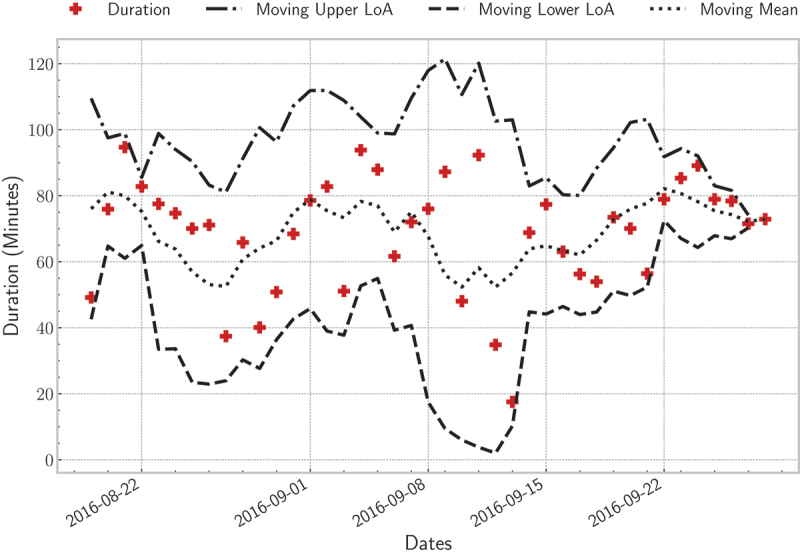
Sleep disturbance (i.e., frequent body movements during sleep) distribution for the second resident over deployment time; the moving average was computed using a time-window of three days.
Figure 15.
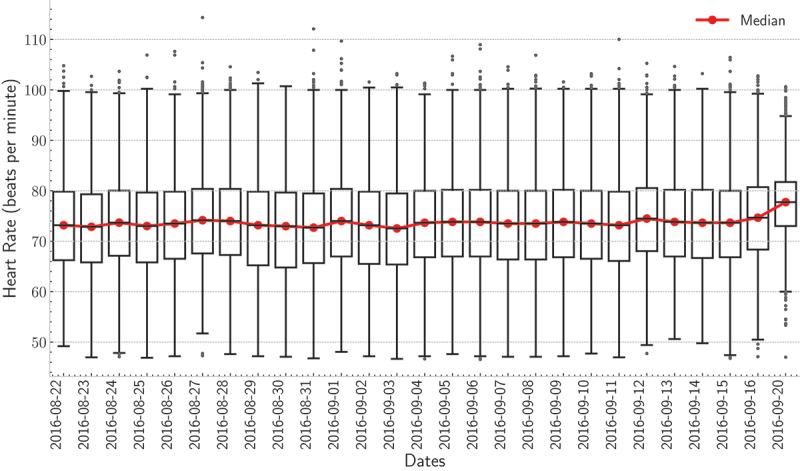
boxplots of the heart rate for the first resident for each day of the deployment.
Figure 16.
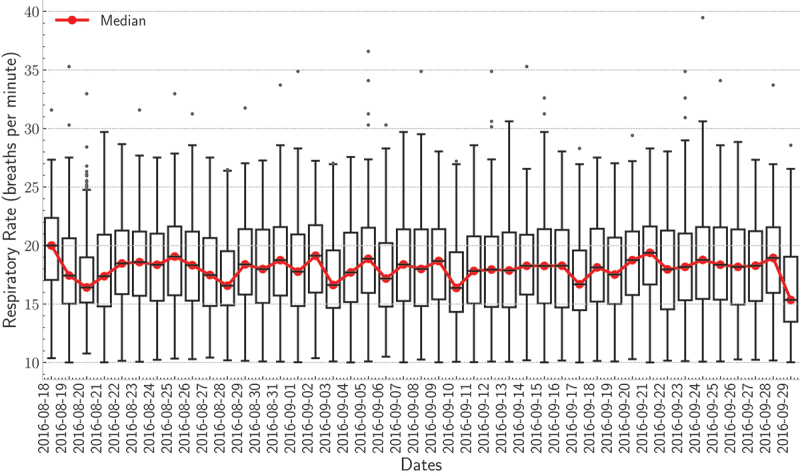
boxplots of the respiratory rate for the first resident for each day of the deployment.
As discussed in Section 3, body movements had to be eliminated before detecting vital signs. Although they are important indicators of sleep stage estimation, they significantly impact signal quality. Hence, the main features of a signal can be demolished, e.g., the “I-J-K” complex of the BCG signal. Because of this, there should always be a balance between discarding body movements and keeping quality signals. To explain, any time-window greater than 2-times the MAD was considered a body movement. If a small threshold value were selected, any time-window with a small variation in its amplitude would have been discarded. By doing so, the signal coverage would have been low. Body movements occur in normal sleepers, but if the frequency of these movements increases, that can be a sign of disease. Figure 17 shows the average duration of disturbed sleep per night for the second resident. The duration varied from 50 to 80 minutes across all days. Further, all points were within the two LoA indicating a normal behaviour for this particular resident. In this example, the moving average was calculated using a time-window of three days. As discussed so far, the provided system showed consistent results compared with the pre-and post-surveys. Furthermore, trends and outliers in sleep parameters, including vital signs, can be regarded as symptoms of sleep disorders.
Family members and caregivers were involved in the study, and they have played a considerable role in refining the monitoring system. This has been done by providing continuous feedback involving the residents’ attitude towards the new monitoring system and discussing the study outcomes with the residents to avoid sedentary life. Put it another way, alerting caregivers about abnormal sleep behaviour can help them assist residents in revamping their daily activities. Caregivers were provided with a user-friendly interface (Figure 18) that had allowed them to monitor any changes in residents’ sleep parameters and hence enhanced the regular follow-up process, e.g., by calling the residents or visiting their apartments.
Figure 18.
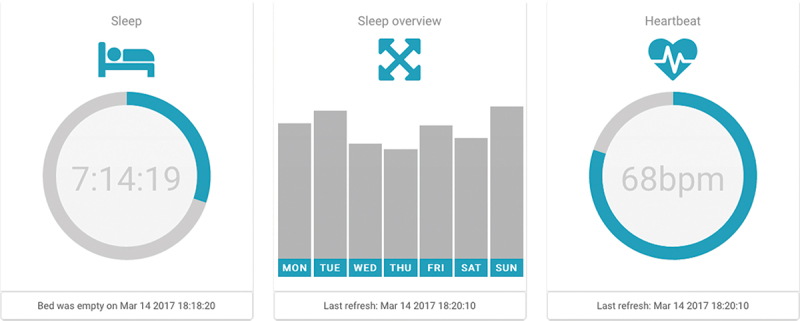
A user-friendly interface organised in tiles. It provides the following information: daily quantity of sleep (selected day) with updated bed occupancy status that changes the colour of the icon and status line; aggregated week overview of sleep quantity; and heartbeat information.
Furthermore, we have developed a mobile application (i.e., a happy button with a very simplistic interface) to engage the residents with our platform and also to follow up on their activity during the day. In contrast to a panic button that indicates a situation of distress, this application was offering simplified well-being monitoring. Our team encouraged the resident to use the application as many times as they wanted. No automatic notification was implemented to avoid annoying the resident (Kodys, 2020). As illustrated in Figure 19 and Figure 20, on average, we received one feedback per day.
Figure 19.
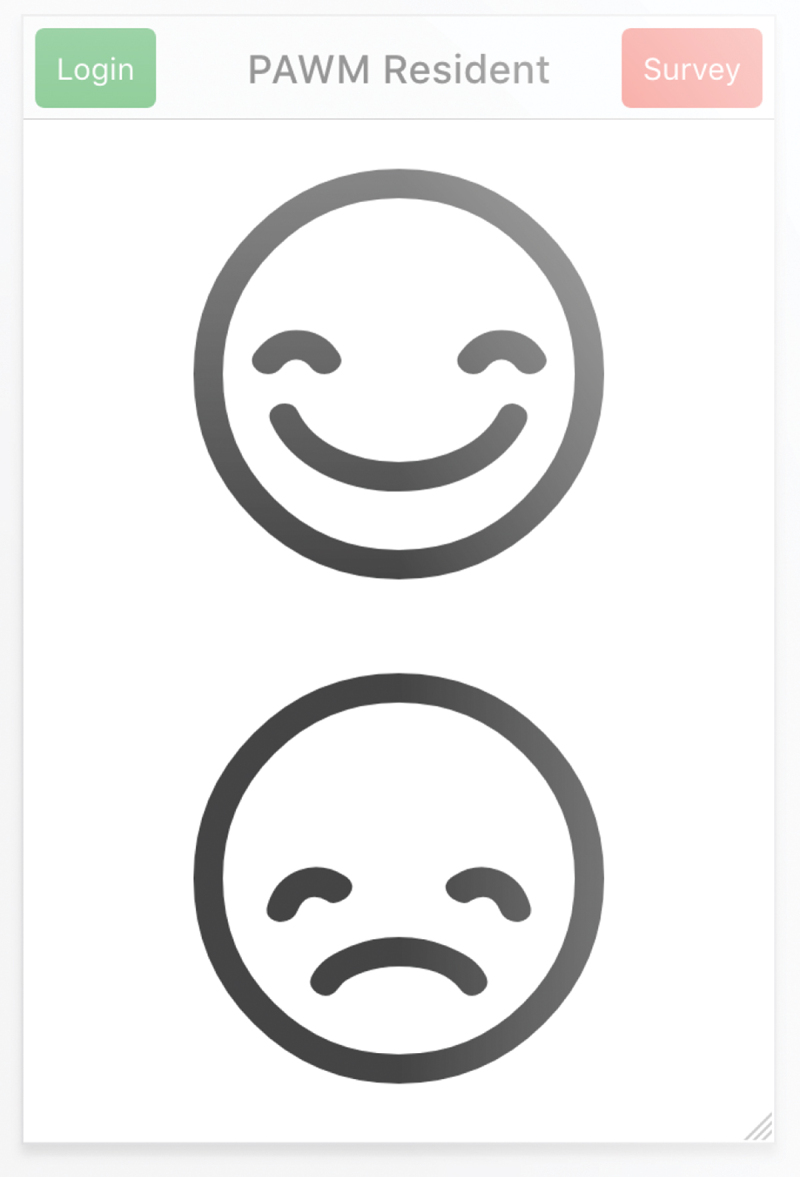
A simple interface of the mobile application for residents when a happy or sad face sends feedback to our server.
Figure 20.

Feedback from simple self-monitoring application collected during one month of deployment. All feedback data-points were positive with one exception.
Most of the events indicated positive feedback, confirmed in the interview with the resident. To this end, the users’ contributions during the development were iterative and continuous. Following these quantitative analyses, we will discuss in the next section the technical issues raised during the deployment time.
4.1. Technical issues
Before introducing new technology to senior residents, psychological effects should be carefully considered (Ye et al., 2019). Although the proposed system is completely non-intrusive and does not provide any form of contact with the monitored subject, a resident complained that the mattress became warmer. In technical terms, this situation cannot happen. However, it was a psychological effect because a new device was placed under the bed mattress. This issue was resolved when the safety of the devices was introduced again to the resident and, likewise, when she talked with the other residents participating in the study. Besides, residents, family members, and caregivers should take part in the monitoring process. That is, providing qualitative results to the residents was very supportive in helping them keep good sleep hygiene. It is important to consider the long-term relationship between residents and caregivers, i.e., regardless of the new technology, residents were always following the advice of their caregivers.
As a result, the feedback of caregivers was necessary to improve our proposed system. When we asked the residents to participate in the study, they were not very interested in wearable devices. They were worried about recharging the device, forgetting to wear the device. This situation may not necessarily hold for all age groups, but it may happen due to ageing or age-related diseases such as dementia. In contrast, they were more interested in non-intrusive sensors like the proposed sensor mat. Additionally, residents and caregivers were against the use of microphones and/or cameras. For these reasons, we implemented a non-intrusive system for the sleep monitoring process. Another issue to consider was offline storage; it was important to keep a local copy of the data on the built-in micro-SD card to avoid data loss. For some reason, the Internet could stop working, and sometimes the resident could unplug the router for cleaning or other housework. The 4 GB internal storage could keep the binary files for a few days; hence data could be retrieved again. All in all, the proposed fibre-optic sensor mat has proven to be highly effective for non-intrusive monitoring of various sleep parameters. The limitation of the system is discussed in the following section 4.2.
4.2. Limitation
The proposed system showed consistent results for determining various sleep parameters. Nevertheless, a comparison versus the PSG should be performed as future work to validate the system’s effectiveness for determining the various sleep cycles. For example, the clinical definition of the wake-up time is the time of leaving the sleep episode. However, in our case, it was defined as the time of leaving the bed. Accordingly, it could happen that the subject may have woken up but did not leave the bed. Despite that fact, the proposed system was designed to reply to the caregivers’ explicit requests related to the five sleep parameters. However, it should be noted that there is a debate among researchers about the effectiveness of bed-embedded BCG sensors for detecting the various sleep cycles. The authors in (Tuominen et al., 2019) tested a commercial sleep tracker, that is, Beddit, for differentiating sleep cycles compared to the PSG. The sleep data were collected from 10 subjects during two non-consecutive nights in a sleep laboratory. The study showed that the sleep tracker failed to detect the rapid eye movement sleep stage. Besides, it failed to differentiate non-rapid eye movement sleep stages. That said, the effects of alcohol and caffeine on the subjects’ sleep quality were not considered in this study. The reason was that we did not aim to disturb the daily routine of the residents. Nonetheless, we aimed to monitor their sleep and identify abnormal events so that caregivers can take appropriate actions. Despite these limitations, the system showed promising results for detecting the different sleep parameters. In other words, it may trigger the need for more advanced sleep analysis (e.g., performing PSG) based on the past collected data and the identified abnormalities. Most importantly, it cannot be considered as a replacement for the PSG. However, it is a complementary/assistive technology for caregivers, in the case where they do not have access to subjects’ health status.
5. Conclusion
In this paper, we discussed commercially-available non-wearable sleep trackers, in which we underlined the features associated with each device, including sensor type, interface, outputs, dimensions, power supply, and connectivity. Also, a real-life deployment of a senior-friendly system for contactless remote monitoring of sleep was evaluated. The suggested system consisted of a fibre-optic sensor mat that can be installed under the monitored person’s bed mattress. The force applied to the sensor mat can be separated into gross body movements, cardioballistic force, and respiration. This information was used to detect various sleep parameters, including wake-up time, bedtime, time in bed, nap time, heart rate, respiratory rate, and body movements. The proposed system was deployed at five houses with four senior female residents and one male resident, and datasets were gathered a few to several weeks. Based on the aforementioned parameters, the residents’ sleep quality was scrutinised. Modified Bland-Altman plots, as well as boxplots, were constructed to detect abnormal sleep behaviour. Besides, box plots were used to detect trends in heart and respiratory rates. The outcomes of the proposed system resembled the results of the residents’ surveys reporting the residents’ sleep hygiene. Given the remote and non-intrusive nature of the sensor mat, the resident’s lifestyle was not disturbed. The outcomes shared with the residents were supportive in helping them keep good sleep hygiene. Moreover, the user-friendly interface shared with family members and caregivers helped to reduce the caregiving burden.
Supplementary Material
Note
Housing & Development Board is a Singaporean governmental organisation responsible for public housing, on their website, “HDB claims: HDB flats are home to over 80% of Singapore’s resident population” (http://www.hdb.gov.sg).
Ethical approval
This study was approved by the Institutional Review Board of the University of Singapore (Approval Number: NUS 3291).
Disclosure statement
No potential conflict of interest was reported by the author(s).
Supplementary material
Supplemental data for this article can be accessed online at https://doi.org/10.1080/20476965.2022.2072777
References
- Al-Mardini, M., Aloul, F., Sagahyroon, A., & Al-Husseini, L. (2014). Classifying obstructive sleep apnea using smartphones. Journal of Biomedical Informatics, 52, 251–259. 10.1016/j.jbi.2014.07.004 [DOI] [PubMed] [Google Scholar]
- Aloulou, H., Mokhtari, M., & Abdulrazak, B. (2020). Pilot site deployment of an IoT solution for older adults’ early behavior change detection. Sensors (Switzerland), 20(7), 1888. 10.3390/s20071888 [DOI] [PMC free article] [PubMed] [Google Scholar]
- Arnal, P. J., Thorey, V., Debellemaniere, E., Ballard, M. E., Bou Hernandez, A., Guillot, A., Jourde, H., Harris, M., Guillard, M., Van Beers, P. et al. (2020). The Dreem Headband compared to polysomnography for electroencephalographic signal acquisition and sleep staging. Sleep, 43(11), zsaa097. 10.1093/sleep/zsaa097 [DOI] [PMC free article] [PubMed] [Google Scholar]
- Aydemir, V. B., Nagesh, S., Shandhi, M. M. H., Fan, J., Klein, L., Etemadi, M., Rehg, J. M., Inan, O. T., & Rehg, J. M. (2020). Classification of decompensated heart failure from clinical and home ballistocardiography. IEEE Transactions on Biomedical Engineering, 67(5), 1303–1313. 10.1109/TBME.2019.2935619 [DOI] [PMC free article] [PubMed] [Google Scholar]
- Breteler, M. J. M., KleinJan, E. J., Dohmen, D. A. J., Leenen, L. P. H., van Hillegersberg, R., Ruurda, J. P., Kalkman, C. J., Blokhuis, T. J., & Kalkman, C. J. (2020). Vital signs monitoring with wearable sensors in high-risk surgical patients a clinical validation study. Anesthesiology, 132(3), 424–439. 10.1097/ALN.0000000000003029 [DOI] [PubMed] [Google Scholar]
- Camcı, B., Ersoy, C., & Kaynak, H. (2019). Abnormal respiratory event detection in sleep: A prescreening system with smart wearables. Journal of Biomedical Informatics, 95, 103218. 10.1016/j.jbi.2019.103218 [DOI] [PubMed] [Google Scholar]
- Cerrato, P., & Halamka, J. (2019). Innovations in mHealth, Part 2. In Cerrato P. & Halamka J. (Eds.), The transformative power of mobile medicine (pp. 17–40). Academic Press. 10.1016/b978-0-12-814923-2.00002-7. [DOI] [Google Scholar]
- Chacko, A., & Hayajneh, T. (2018). Security and privacy issues with IoT in healthcare. EAI Endorsed Transactions on Pervasive Health and Technology, 4 (14), 155079. https://eudl.eu/doi/10.4108/eai.13-7-2018.155079 [Google Scholar]
- Choi, S. H., Kwon, H. B., Jin, H. W., Yoon, H., Lee, M. H., Lee, Y. J., & Park, K. S. (2020). Long short-term memory networks for unconstrained sleep stage classification using polyvinylidene fluoride film sensor. IEEE Journal of Biomedical and Health Informatics, 24(12), 3606–3615. 10.1109/JBHI.2020.2979168 [DOI] [PubMed] [Google Scholar]
- Conte, F., Cerasuolo, M., Fusco, G., Giganti, F., Inserra, I., Malloggi, S., Ficca, G., & Ficca, G. (2021). Sleep continuity, stability and organization in good and bad sleepers. Journal of Health Psychology, 26(12), 2131–2142. 10.1177/1359105320903098 [DOI] [PubMed] [Google Scholar]
- Cooke, J. R., & Ancoli-Israel, S. (2011). Normal and abnormal sleep in the elderly. Handbook of Clinical Neurology, 98, 653–665. 10.1016/B978-0-444-52006-7.00041-1 [DOI] [PMC free article] [PubMed] [Google Scholar]
- Despins, L. A., Guidoboni, G., Skubic, M., Sala, L., Enayati, M., Popescu, M., & Deroche, C. B. Using sensor signals in the early detection of heart failure: A case study. (2020). Journal of Gerontological Nursing, 46(7), 41–46. 10.3928/00989134-20200605-07 [DOI] [PubMed] [Google Scholar]
- Faust, O., Hagiwara, Y., Hong, T. J., Lih, O. S., & Acharya, U. R. (2018). Deep learning for healthcare applications based on physiological signals: A review. Computer Methods and Programs in Biomedicine, 161, 1–13. 10.1016/j.cmpb.2018.04.005 [DOI] [PubMed] [Google Scholar]
- Faust, O., Razaghi, H., Barika, R., Ciaccio, E. J., & Acharya, U. R. (2019). A review of automated sleep stage scoring based on physiological signals for the new millennia. Computer Methods and Programs in Biomedicine, 176, 81–91. 10.1016/j.cmpb.2019.04.032 [DOI] [PubMed] [Google Scholar]
- Getting real with wearable data. (2019). Nature Biotechnology, 37(4), 331. 10.1038/s41587-019-0109-z [DOI] [PubMed] [Google Scholar]
- Hafner, M., Stepanek, M., Taylor, J., Troxel, W., & Stolk, C. (2017). Why sleep matters – The economic costs of insufficient sleep: A cross-country comparative analysis. Why Sleep Matters – the Economic Costs of Insufficient Sleep: A Cross-Country Comparative Analysis, 6(4), 11. 10.7249/rr1791 [DOI] [PMC free article] [PubMed] [Google Scholar]
- Javaid, A. Q., Ashouri, H., Dorier, A., Etemadi, M., Heller, J. A., Roy, S., & Inan, O. T. (2017). Quantifying and reducing motion artifacts in wearable seismocardiogram measurements during walking to assess left ventricular health. IEEE Transactions on Biomedical Engineering, 64(6), 1277–1286. 10.1109/TBME.2016.2600945 [DOI] [PMC free article] [PubMed] [Google Scholar]
- Jayarathna, T., Gargiulo, G. D., & Breen, P. P. (2020). Continuous vital monitoring during sleep and light activity using carbon-black elastomer sensors. Sensors (Switzerland), 20(6), 1583. 10.3390/s20061583 [DOI] [PMC free article] [PubMed] [Google Scholar]
- Klap, T., & Shinar, Z. (2013). Using piezoelectric sensor for continuous-contact-free monitoring of heart and respiration rates in real-life hospital settings. Computing in Cardiology, 40(40), 671–674. https://ieeexplore.ieee.org/document/6713466 [Google Scholar]
- Kodys, M. (2020). Semantic reasoning for ubiquitous smart living framework for well-being and digital health. Université Grenoble Alpes [2020]. https://tel.archives-ouvertes.fr/tel-03032152%0Ahttps://tel.archives-ouvertes.fr/tel-03032152/document
- Liu, J., Chen, Y., Wang, Y., Chen, X., Cheng, J., & Yang, J. (2018). Monitoring vital signs and postures during sleep using wifi signals. IEEE Internet of Things Journal, 5(3), 2071–2084. 10.1109/JIOT.2018.2822818 [DOI] [Google Scholar]
- Liu, C., Zhang, X., Zhao, L., Liu, F., Chen, X., Yao, Y., & Li, J. (2019). Signal quality assessment and lightweight QRS detection for wearable ECG smartvest system. IEEE Internet of Things Journal, 6(2), 1363–1374. 10.1109/JIOT.2018.2844090 [DOI] [Google Scholar]
- Malasinghe, L. P., Ramzan, N., & Dahal, K. (2019). Remote patient monitoring: A comprehensive study. Journal of Ambient Intelligence and Humanized Computing, 10(1), 57–76. 10.1007/s12652-017-0598-x [DOI] [Google Scholar]
- Massaroni, C., Zaltieri, M., Presti, D. L., Nicolò, A., Tosi, D., & Schena, E. (2021). Fiber Bragg grating sensors for cardiorespiratory monitoring: A review. IEEE Sensors Journal, 21(13), 14069–14080. 10.1109/JSEN.2020.2988692 [DOI] [Google Scholar]
- Mohit, B., & Wickwire, E. M. (2020). The health economics of sleep disorders among older adults. Current Sleep Medicine Reports, 6(1), 21–31. 10.1007/s40675-020-00166-y [DOI] [Google Scholar]
- Ohayon, M., Wickwire, E. M., Hirshkowitz, M., Albert, S. M., Avidan, A., Daly, F. J., Vitiello, M. V., Ferri, R., Fung, C., Gozal, D., Hazen, N., Krystal, A., Lichstein, K., Mallampalli, M., Plazzi, G., Rawding, R., Scheer, F. A., Somers, V., & Vitiello, M. V. (2017). National sleep foundation’s sleep quality recommendations: First report. Sleep Health, 3(1), 6–19. 10.1016/j.sleh.2016.11.006 [DOI] [PubMed] [Google Scholar]
- Pan, Q., Brulin, D., & Campo, E. (2020). Current status and future challenges of sleep monitoring systems: systematic review. JMIR Biomedical Engineering, 5(1), e20921. 10.2196/20921 [DOI] [Google Scholar]
- Park, C., Arian, M., Liu, X., Sasson, L., Kahn, J., Patel, S., & Althoff, T. (2021). Online mobile app usage as an indicator of sleep behavior and job performance. In The Web Conference 2021 - Proceedings of the World Wide Web Conference, WWW 2021 (pp. 2488–2500). New York, NY, USA: ACM. 10.1145/3442381.3450093 [DOI] [Google Scholar]
- Perez-Pozuelo, I., Zhai, B., Palotti, J., Mall, R., Aupetit, M., Garcia-Gomez, J. M., Fernandez-Luque, L., Guan, Y., & Fernandez-Luque, L. (2020). The future of sleep health: A data-driven revolution in sleep science and medicine. Npj Digital Medicine, 3(1), 42. 10.1038/s41746-020-0244-4 [DOI] [PMC free article] [PubMed] [Google Scholar]
- Romero-Peralta, S., Cano-Pumarega, I., Garcia-Malo, C., Ramos, L. A., & García-Borreguero, D. (2019). Treating restless legs syndrome in the context of sleep disordered breathing comorbidity. European Respiratory Review, 28(153), 190061. 10.1183/16000617.0061-2019 [DOI] [PMC free article] [PubMed] [Google Scholar]
- Sadek, I., & Abdulrazak, B. (2021). A comparison of three heart rate detection algorithms over ballistocardiogram signals. Biomedical Signal Processing and Control, 70, 103017. 10.1016/j.bspc.2021.103017 [DOI] [Google Scholar]
- Sadek, I., Biswas, J., & Abdulrazak, B. (2019). Ballistocardiogram signal processing: A review. Health Information Science and Systems, 7(1), 10. 10.1007/s13755-019-0071-7 [DOI] [PMC free article] [PubMed] [Google Scholar]
- Sadek, I., & Mohktari, M. Nonintrusive remote monitoring of sleep in home-based situation. (2018). Journal of Medical Systems, 42(4), 64. 10.1007/s10916-018-0917-6 [DOI] [PubMed] [Google Scholar]
- Sannino, G., De Falco, I., & De Pietro, G. (2014). Monitoring obstructive sleep apnea by means of a real-time mobile system based on the automatic extraction of sets of rules through differential evolution. Journal of Biomedical Informatics, 49, 84–100. 10.1016/j.jbi.2014.02.015 [DOI] [PubMed] [Google Scholar]
- Sun, Q., Qiu, H., Huang, M., & Yang, Y. (2020). Lower mortality of COVID-19 by early recognition and intervention: Experience from Jiangsu province. Annals of Intensive Care, 10(1), 33. 10.1186/s13613-020-00650-2 [DOI] [PMC free article] [PubMed] [Google Scholar]
- Toften, S., Pallesen, S., Hrozanova, M., Moen, F., & Grønli, J. (2020). Validation of sleep stage classification using non-contact radar technology and machine learning (Somnofy®). Sleep Medicine, 75, 54–61. 10.1016/j.sleep.2020.02.022 [DOI] [PubMed] [Google Scholar]
- Tuominen, J., Peltola, K., Saaresranta, T., & Valli, K. (2019). Sleep parameter assessment accuracy of a consumer home sleep monitoring ballistocardiograph beddit sleep tracker: A validation study. Journal of Clinical Sleep Medicine, 15(3), 483–487. 10.5664/jcsm.7682 [DOI] [PMC free article] [PubMed] [Google Scholar]
- Vollmer, T., Schauerte, P., Zink, M., Glöggler, S., Schiefer, J., Schiek, M., Leonhardt, S., & Leonhardt, S. (2014). Individualized biomonitoring in heart failure - Biomon-HF ‘keep an eye on heart failure - especially at night’. Biomedizinische Technik, 59(2), 103–111. 10.1515/bmt-2013-0024 [DOI] [PubMed] [Google Scholar]
- Waltisberg, D., Amft, O., Brunner, D. P., & Troster, G. (2017). Detecting disordered breathing and limb movement using in-bed force sensors. IEEE Journal of Biomedical and Health Informatics, 21(4), 930–938. 10.1109/JBHI.2016.2549938 [DOI] [PubMed] [Google Scholar]
- Wang, T., Zhang, D., Wang, L., Zheng, Y., Gu, T., Dorizzi, B., & Zhou, X. (2019). Contactless respiration monitoring using ultrasound signal with off-the-shelf audio devices. IEEE Internet of Things Journal, 6(2), 2959–2973. 10.1109/JIOT.2018.2877607 [DOI] [Google Scholar]
- Wiens, A. D., & Inan, O. T. (2015). A novel system identification technique for improved wearable hemodynamics assessment. IEEE Transactions on Biomedical Engineering, 62(5), 1345–1354. 10.1109/TBME.2014.2387354 [DOI] [PMC free article] [PubMed] [Google Scholar]
- Ye, B., Khan, S. S., Chikhaoui, B., Iaboni, A., Martin, L. S., Newman, K., Mihailidis, A., & Mihailidis, A. (2019). Challenges in collecting big data in a clinical environment with vulnerable population: lessons learned from a study using a multi-modal sensors platform. Science and Engineering Ethics, 25(5), 1447–1466. 10.1007/s11948-018-0072-y [DOI] [PubMed] [Google Scholar]
- Zhang, X., Zhang, L., Wang, K., Yu, C., Zhu, T., & Tang, J. (2018). A rapid approach to assess cardiac contractility by ballistocardiogram and electrocardiogram. Biomedizinische Technik, 63(2), 113–122. 10.1515/bmt-2015-0204 [DOI] [PubMed] [Google Scholar]
- Zhu, K., Li, M., Akbarian, S., Hafezi, M., Yadollahi, A., & Taati, B. (2019). Vision-based heart and respiratory rate monitoring during sleep-a validation study for the population at risk of sleep apnea. IEEE Journal of Translational Engineering in Health and Medicine, 7, 1–8. 10.1109/JTEHM.2019.2946147 [DOI] [PMC free article] [PubMed] [Google Scholar]
Associated Data
This section collects any data citations, data availability statements, or supplementary materials included in this article.


