

Abstract
Aims/Introduction
Clinical guidelines for the management of individuals with type 2 diabetes mellitus endorse the systematic assessment of atherosclerotic cardiovascular disease risk for early interventions. In this study, we aimed to develop machine learning models to predict 3‐year atherosclerotic cardiovascular disease risk in Chinese type 2 diabetes mellitus patients.
Materials and Methods
Clinical records of 4,722 individuals with type 2 diabetes mellitus admitted to 94 hospitals were used. The features included demographic information, disease histories, laboratory tests and physical examinations. Logistic regression, support vector machine, gradient boosting decision tree, random forest and adaptive boosting were applied for model construction. The performance of these models was evaluated using the area under the receiver operating characteristic curve. Additionally, we applied SHapley Additive exPlanation values to explain the prediction model.
Results
All five models achieved good performance in both internal and external test sets (area under the receiver operating characteristic curve >0.8). Random forest showed the highest discrimination ability, with sensitivity and specificity being 0.838 and 0.814, respectively. The SHapley Additive exPlanation analyses showed that previous history of diabetic peripheral vascular disease, older populations and longer diabetes duration were the three most influential predictors.
Conclusions
The prediction models offer opportunities to personalize treatment and maximize the benefits of these medical interventions.
Keywords: Atherosclerotic cardiovascular disease, Machine learning, Type 2 diabetes mellitus
Clinical guidelines for the management of individuals with type 2 diabetes mellitus endorse the systematic assessment of atherosclerotic cardiovascular disease risk for early interventions. In this study, we aimed to develop machine learning models to predict 3‐year atherosclerotic cardiovascular disease risk in Chinese type 2 diabetes mellitus patients.

INTRODUCTION
It is estimated that in 2021 there were 537 million adults (aged 20–79 years) with diabetes mellitus worldwide, with China having the largest number of patients at 140.9 million 1 . More than 90% of diabetes patients are classified as having type 2 diabetes mellitus, with long disease duration and complex complications, which places a huge burden on China 2 . Atherosclerotic cardiovascular disease (ASCVD), defined as coronary heart disease, cerebrovascular disease or peripheral arterial disease considered of atherosclerotic origin, is the leading cause of morbidity and mortality in type 2 diabetes mellitus patients 3 . Individualized prevention and management of this major complication is a key issue in the treatment of type 2 diabetes mellitus. There is considerable agreement among the recommendations of different professional associations that regular risk assessment and stratification of ASCVD risk are needed, as exemplified by the American College of Cardiology/American Heart Association ASCVD risk calculator (Risk Estimator Plus) 4 .
Over the years, a variety of cardiovascular risk models and calculators have been developed in different regions by Cox proportional hazards regression, such as the Framingham risk score 5 and a series of Framingham‐based modifying models 6 , SCORE cardiovascular disease (CVD) death risk score 7 , American College of Cardiology/American Heart Association pooled cohort hard ASCVD risk score 4 , Multi‐Ethnic Study of Atherosclerosis (MESA) risk score 8 , the Predication for ASCVD Risk in China (China‐PAR) risk predictor 9 and PREDICT CVD risk predictor 10 . These models vary in applicable populations, risk factor selection and end‐points assessment, so a select few are commonly used in clinical practice. Most models are designed to estimate CVD risk for ≥10 years, and validation in other populations suggests that these models overestimate or underestimate ASCVD risk 11 . When multiple risk models are applied to the same population, the results can also vary widely, especially in untested populations 11 . In addition, an individual's socioeconomic status, geographic or neighborhood location and morbid state affect the accuracy of their ASCVD risk estimates 12 .
Modern machine learning (ML) technique serves as an extension to traditional statistics, and makes it possible to extract useful patterns from large datasets to address clinical problems 13 . From our investigations, most of this work utilizes imaging data for ASCVD disease detection rather than clinical data. Previous studies mainly used computed tomography images of patients to diagnose coronary artery disease 14 , cerebrovascular disease 15 and peripheral vascular disease 16 . In contrast, there has been a few studies focusing on predicting ASCVD risk based on clinical text data. Li et al. 17 designed an automated, population‐specific ASCVD risk calculator using ML methods and electronic medical record data from a regional healthcare system in the USA. Notably, all the ML models tested outperformed the risk calculators built by traditional statistic methods. In the Silesia Diabetes‐Heart Project, an end‐to‐end ML technique was proposed to develop a model with an area under the receiver operating characteristic curve (AUC) of 0.72 to predict cardiovascular events in diabetes mellitus patients 18 . These studies showed the powerful ability of ML in the ASCVD risk prediction. However, risk prediction models developed from health data in one country or ethnic population might not be applicable to another, and most models have not been adequately validated in Chinese populations. In addition, compared with other studies, we included a larger number of type 2 diabetes mellitus patients and ensured long‐term follow‐up compliance of patients, as well as continuity and integrity of data collection. Therefore, a reliable risk prediction model for Chinese patients is needed to better manage ASCVD progression in the world's largest type 2 diabetes mellitus population.
In the present study, we addressed this research gap by generating ML algorithms to predict ASCVD in Chinese type 2 diabetes mellitus patients. We collected clinical data of type 2 diabetes mellitus patients from 94 hospitals in China and carried out data preprocessing. The performance of five ML models was compared in external test datasets. Furthermore, we discussed important features affecting the model prediction, and SHapley Additive exPlanations (SHAP) analysis was used for model explanation.
MATERIALS AND METHODS
The present study aimed to develop machine learning models to predict 3‐year ASCVD risk in Chinese type 2 diabetes mellitus patients. Figure 1 shows the architecture of the proposed methodology.
Figure 1.

Framework for predicting atherosclerotic cardiovascular disease (ASCVD) risk in Chinese type 2 diabetes mellitus patients. AdaBoost, adaptive boosting; GBDT, gradient boosting decision tree; LR, logistic regression; RF, random forest; SHAP, SHapley Additive exPlanations; SVM, support vector machine; T2DM, type 2 diabetes mellitus.
Study population
3BExt database (the extending study of the 3B study 19 ), containing clinical data on type 2 diabetes mellitus patients admitted from 2010 to 2014 to 94 tier 1 to tier 3 hospitals across China, was used. Detailed information regarding the recruitment procedures and inclusion/exclusion criteria has been described in previous studies 19 . The Transparent Reporting of a Multivariable Prediction Model for Individual Prognosis or Diagnosis (TRIPOD) reporting guideline was followed.
Outcome definitions
ASCVD was defined by one of the following outcomes: (1) coronary artery disease; (2) cerebrovascular disease; (3) peripheral vascular disease.
Data collection and preprocessing of data
We collected data on demographic characteristics, disease and family disease histories, laboratory tests, and physical examinations from the 3BE database. The data governance process included deduplication, unification of units, filling of missing values, as well as review and modification of outliers. Central tendency measures, such as mean, median or mode of the numeric feature column, were used to replace or impute missing values. We carried out k‐interval discretization 20 on clinical continuous features according to health reference values 21 specific to Chinese adults. We randomly selected 10 hospitals from the dataset as external validation data, and the remaining data were used to build the ML models. During model construction, we randomly partitioned the dataset into a training set (80%) and a test set (20%). We used the training set to train the model and the test set to evaluate its performance. These two datasets are independent to ensure we can accurately assess the model's performance. The external validation data can help to assess the generalizability of the model and provide a more accurate assessment of its performance on new, unseen data.
To overcome the imbalance of data in the training set, we randomly undersample negative cases to prevent overfitting. Undersampling is a technique to balance uneven datasets by keeping all the data in the minority class and decreasing the size of the majority class. It is one of several techniques data scientists can use to extract more accurate information from originally imbalanced datasets.
Machine learning model
We attempted the following supervised machine learning methods to develop the predictive models: logistic regression 22 , support vector machine 23 , gradient boosting decision tree (GBDT) 24 , random forest (RF) 25 and adaptive boosting (AdaBoost) 26 . Logistic regression uses the maximum likelihood function to estimate the relationship between a dependent variable and one or more independent variables. A support vector machine maps the data into the feature space through the kernel function and determines a classification hyperplane to separate the data into different categories. Tree‐based learning algorithms include GBDT, RF and AdaBoost. GBDT is a boosting ensemble algorithm that integrates multiple weak classifiers to form a strong classifier. The weak classifier used by GBDT is the CART regression tree. RF is a bagging ensemble learning method for classification. The randomness of random forest is reflected in that the training samples of each tree are random, and the set of split attributes of each node in the tree is also randomly selected and determined. AdaBoost is a very popular boosting technique that aims at using an iterative approach to learn from the mistakes of weak classifiers and turn them into strong classifiers.
Evaluation metrics
Accuracy, F1‐score, AUC, sensitivity and specificity were used as criteria to evaluate the accuracy of various machine learning models. For the model explanation, SHapley Additive exPlanation (SHAP) values were used to provide accurate attribution values for each feature. The main concept of SHAP is coalitional game theory to compute the Shapley values for each characteristic of the sample to be interpreted, where each Shapley value denotes the influence of the related feature on the prediction. This makes it possible to comprehend the output of any machine learning model.
Statistical analysis
We carried out clinical characteristics data analysis within the training, testing and external validation set, respectively. Means (and standard deviation) were used for continuous data, and counts (n) and percentages (%) were expressed for the categorical index. The independent t‐test was used for comparisons of continuous variables between datasets, and the Kolmogorov–Smirnov test was used for categorical variables to evaluate if there is a significant difference between two sets of data distributions. Differences were considered significant when a P‐value was <0.05.
We used kernel density estimation to fit the laboratory test data of participants, which can intuitively reflect the distribution characteristics of the sample data. We adopted a Gaussian kernel as the smoothing kernel for kernel density estimation.
RESULTS
Study population
A total of 4,722 type 2 diabetes mellitus patients, from 2010 to 2014, were included in the analysis after data cleaning, and the development of ASCVD was noted in 375 (7.94%) participants over the 3 years of follow up (Figure 2). A total of 719 patients were randomly sampled for model development and validation. Of them, 575 cases were included in the training set, 144 cases were included in the test set and 278 cases were included in the external validation dataset. The training set was utilized for the training of machine learning models, and the test set functions as an internal validation set for evaluating the performance of the models and selecting the best‐performing model. The external validation set was used to assess the model's portability and generalizability. Baseline clinical characteristics of the training set, test set and external validation set are summarized in Table 1, and all the variables listed were included for modeling. Generally, there was good consistency in the data between the training set and testing set.
Figure 2.

Analysis overview for identifying the best‐performing atherosclerotic cardiovascular disease risk prediction model. 3BExt, 3BExt database.
Table 1.
Clinical characteristics of the training set, test set and external validation set
| Characteristics | Train set (n = 575) | Test set (n = 144) | External set (n = 278) | P‐value (train‐test) | P‐value (train‐external) |
|---|---|---|---|---|---|
| Outcome categories | |||||
| ASCVD | 289 (50%) | 74 (51%) | 12 (4%) | 1.0 | <0.001 |
| Non‐ASCVD | 286 (50%) | 70 (49%) | 266 (96%) | ||
| Hospital information | |||||
| Classification of Chinese hospitals | |||||
| Primary hospital | 230 (40%) | 63 (44%) | 0 (<1%) | 1.0 | <0.001 |
| Secondary hospital | 231 (40%) | 56 (39%) | 38 (14%) | ||
| Tertiary hospital | 114 (20%) | 25 (17%) | 240 (86%) | ||
| Area | |||||
| Northwest China | 136 (23%) | 37 (26%) | 123 (44%) | 1.0 | <0.001 |
| North China | 73 (12%) | 13 (9%) | 58 (21%) | ||
| Northeast China | 81 (14%) | 25 (17%) | 0 (<1%) | ||
| South Central China | 108 (18%) | 26 (18%) | 2 (<1%) | ||
| East China | 64 (11%) | 15 (10%) | 0 (<1%) | ||
| Southwest China | 113 (19%) | 28 (19%) | 95 (34%) | ||
| Demographic characteristics | |||||
| Sex | |||||
| Male | 245 (43%) | 61 (42%) | 159 (57%) | 1.0 | <0.001 |
| Female | 330 (57%) | 83 (58%) | 119 (43%) | ||
| Race | |||||
| Han | 562 (98%) | 141 (98%) | 276 (99%) | 1.0 | 1.0 |
| Hui | 5 (<1%) | 2 (1.4%) | 1 (<1%) | ||
| Other | 8 (1.4%) | 1 (<1%) | 1 (<1%) | ||
| Age (years) | 67.2 (9.2) | 67.3 (9.3) | 61.8 (11.4) | 0.95 | <0.001 |
| Height (cm) | 162.1 (8.2) | 162.1 (7.2) | 165.7 (8.6) | 1.0 | <0.001 |
| Weight (kg) | 67.5 (11.1) | 66.8 (10.3) | 70.2 (11.1) | 0.47 | 0.001 |
| BMI | 25.7 (3.5) | 25.4 (3.3) | 25.5 (3.3) | 0.41 | 0.53 |
| Waist (cm) | 88.5 (9.4) | 87.7 (10.0) | 89.0 (7.9) | 0.35 | 0.42 |
| Diastolic blood pressure | 80.4 (9.0) | 81.1 (9.5) | 84.1 (9.8) | 0.45 | <0.001 |
| Systolic blood pressure | 140.2 (13.0) | 141.6 (14.3) | 140.3 (14.4) | 0.29 | 0.92 |
| Smoking | |||||
| Current smoker | 118 (21%) | 20 (14%) | 82 (29.5%) | 0.66 | 0.09 |
| Non‐smoker | 457 (79%) | 124 (86%) | 196 (70.5%) | ||
| Smoking for 5 years | |||||
| Yes | 101 (18%) | 24 (17%) | 22 (8%) | 1.0 | 0.06 |
| No | 474 (82%) | 256 (83%) | 256 (92%) | ||
| No smoking for 5 years | |||||
| Yes | 41 (7%) | 11 (8%) | 11 (4%) | 1.0 | 0.99 |
| No | 534 (93%) | 133 (92%) | 267 (96%) | ||
| State of motion | |||||
| Not exercising | 231 (40%) | 40 (28%) | 37 (13%) | 0.23 | <0.001 |
| Occasional | 49 (9%) | 13 (9%) | 80 (29%) | ||
| <3 times a week | 48 (8%) | 25 (17%) | 67 (25%) | ||
| >3 times a week | 247 (43%) | 66 (46%) | 94 (34%) | ||
| Marital status | |||||
| Single | 2 (<1%) | 0 (<1%) | 4 (1%) | 1.0 | 0.66 |
| Married | 514 (89%) | 126 (88%) | 260 (94%) | ||
| Divorced | 4 (<1%) | 3 (2%) | 1 (<1%) | ||
| Widowed | 55 (10%) | 15 (10%) | 13 (5%) | ||
| Education level | |||||
| Illiterate | 51 (9%) | 15 (10%) | 4 (1%) | 0.85 | <0.001 |
| Primary school | 145 (25%) | 42 (29%) | 34 (12%) | ||
| Middle school | 264 (46%) | 61 (42%) | 106 (38%) | ||
| Junior college | 80 (14%) | 18 (13%) | 80 (29%) | ||
| University or above | 35 (6%) | 7 (5%) | 54 (19%) | ||
| Health insurance | |||||
| Yes | 541 (94%) | 140 (97%) | 254 (91%) | 1.0 | 1.0 |
| No | 34 (6%) | 4 (3%) | 24 (9%) | ||
| Compliance | |||||
| Yes | 522 (91%) | 131 (91%) | 233 (84%) | 1.0 | 0.30 |
| No | 53 (9%) | 13 (9%) | 45 (16%) | ||
| Hypoglycemia | |||||
| Yes | 156 (27%) | 27 (19%) | 50 (18%) | 0.37 | 0.08 |
| No | 419 (73%) | 117 (81%) | 228 (82%) | ||
| Laboratory indexes | |||||
| HbA1c (%) | 7.4 (2.0) | 7.4 (2.3) | 7.9 (2.2) | 0.94 | 0.002 |
| FPG (mmol/L) | 8.1 (2.8) | 8.0 (2.9) | 8.7 (3.2) | 0.60 | 0.01 |
| TCHO (mmol/L) | 5.1 (1.1) | 5.1 (1.2) | 4.9 (1.1) | 0.71 | 0.13 |
| HDL (mmol/L) | 1.3 (0.4) | 1.3 (0.5) | 1.3 (0.7) | 0.95 | 0.86 |
| LDL (mmol/L) | 2.9 (0.8) | 2.9 (0.9) | 2.6 (0.9) | 0.68 | <0.001 |
| TG (mmol/L) | 2.0 (1.4) | 1.8 (1.1) | 2.3 (1.9) | 0.04 | 0.03 |
| Disease history | |||||
| Family history of diabetes | |||||
| Yes | 361 (63%) | 92 (64%) | 183 (66%) | 1.0 | 1.0 |
| No | 154 (27%) | 36 (65%) | 71 (25%) | ||
| Unknown | 60 (10%) | 16 (11%) | 24 (9%) | ||
| Family history of cardiovascular disease | |||||
| Yes | 128 (22%) | 25 (17%) | 44 (16%) | 0.93 | 0.40 |
| No | 447 (78%) | 119 (83%) | 234 (84%) | ||
| History of diabetic peripheral vascular disease | |||||
| Yes | 212 (37%) | 50 (65%) | 80 (28%) | 1.0 | 0.16 |
| No | 363 (63%) | 94 (35%) | 198 (72%) | ||
| History of microvascular complications | |||||
| Yes | 250 (43%) | 62 (43%) | 145 (52%) | 1.0 | 0.11 |
| No | 325 (57%) | 82 (57%) | 133 (48%) | ||
| History of other cardiovascular diseases | |||||
| Yes | 91 (16%) | 26 (18%) | 11 (4%) | 1.0 | 0.009 |
| No | 484 (84%) | 118 (82%) | 267 (96%) | ||
| Diagnostic age | 57.6 (9.9) | 58.6 (9.9) | 52.6 (11.6) | 0.27 | <0.001 |
| Diabetes duration | 9.7 (7.3) | 8.7 (6.6) | 9.2 (6.8) | 0.13 | 0.37 |
| Medicine information | |||||
| Antidiabetic drug | |||||
| Yes | 423 (74%) | 114 (79%) | 162 (58%) | 0.84 | <0.001 |
| No | 152 (26%) | 30 (21%) | 116 (42%) | ||
| Antihypertensive drug | |||||
| Yes | 335 (62%) | 90 (62.5%) | 185 (67%) | 1.0 | 0.76 |
| No | 220 (38%) | 54 (37.5%) | 93 (33%) | ||
| Hypolipidemic agents | |||||
| Yes | 158 (27%) | 36 (25%) | 138 (50%) | 1.0 | <0.001 |
| No | 417 (73%) | 108 (75%) | 140 (50%) | ||
Data are presented as mean (standard deviation) or number (%). ASCVD, atherosclerotic cardiovascular disease; BMI, body mass index; FPG, fasting plasma glucose; HbA1c, glycosylated hemoglobin; HDL, high‐density lipoprotein cholesterol; LDL, low‐density lipoprotein cholesterol; TCHO, total cholesterol; TG, triglyceride.
We carried out kernel density estimation to further investigate the distribution of the laboratory tests between patients with and without ASCVD (Figure 3). The horizontal axis of the kernel density plot represents the value of clinical laboratory indexes, and the vertical axis represents the estimated kernel density. A higher kernel density estimate indicates a larger number of patients in that interval. Blue and orange curves represent the distribution of non‐ASCVD and ASCVD patients, respectively. We found that the distributions of laboratory indexes in these patients were much the same, and all were approximately normally distributed. Compared with patient non‐ASCVD, the high‐density lipoprotein cholesterol and triglyceride (TG) indexes of patient ASCVD were relatively high.
Figure 3.

Kernel density plot for (a) fasting plasma glucose (FPG), (b) glycosylated hemoglobin (HbA1c), (c) low‐density lipoprotein (LDL), (d) total cholesterol (TCHO), (e) triglycerides (TG) and (f) high‐density lipoprotein (HDL). ASCVD, atherosclerotic cardiovascular disease.
Model performance
We built the machine learning models using the Scikit‐Learn library of Python programming language. For LR we used L2 regularization, also referred to as ridge regularization, as a method to avoid overfitting. For the support vector machine, we used the radial basis function kernel and set the regularization term to 1. In case of GBDT, we constructed a forest with 350 trees. The maximum depth of the tree was set to 9, and the Gini impurity was used as the function to measure the quality of a split. We trained the AdaBoost at a learning rate of 0.002, and the number of trees in the forest was set to 104. To train the RF classifier, we used 600 trees in the forest, set the maximum depth of each tree to 9, used entropy as the measure for the quality of a split, and required a minimum number of 11 samples for both leaf nodes and split internal nodes. The remaining parameters were left at their default values.
Table 2 presents the metric scores for comparison methods on the test set, and the receiver operating characteristic curves are presented in Figure 4. All five ML models achieved good performance, with AUCs ranging from 0.809 to 0.859. Compared with the other models, the RF showed the best performance, obtaining an accuracy of 0.826, F1‐score of 0.832, AUC of 0.859, sensitivity of 0.838 and specificity of 0.814. Relatively, the logistic regression model showed a slightly lower prediction value.
Table 2.
Performance of different models in the prediction of atherosclerotic cardiovascular disease risk in type 2 diabetes mellitus patients in the test set
| Model | AUC | Accuracy | F1‐score | Sensitivity | Specificity |
|---|---|---|---|---|---|
| LR | 0.809 | 0.750 | 0.746 | 0.716 | 0.786 |
| SVM | 0.811 | 0.764 | 0.770 | 0.770 | 0.757 |
| AdaBoost | 0.834 | 0.792 | 0.792 | 0.770 | 0.814 |
| GBDT | 0.855 | 0.806 | 0.813 | 0.824 | 0.786 |
| RF | 0.859 | 0.826 | 0.832 | 0.838 | 0.814 |
AdaBoost, adaptive boosting; AUC, area under the curve; GBDT, gradient boosting decision tree; LR, logistic regression; RF, random forest; SVM, support vector machine.
Figure 4.

Receiver operating curves for the prediction of atherosclerotic cardiovascular disease using different machine learning models in the testing set. AdaBoost, adaptive boosting; GBDT, gradient boosting decision tree; LR, logistic regression; RF, random forest; SVM, support vector machine.
Table 3 shows the metric scores for the external validation set of the comparative methods, and the receiver operating characteristic curves can be seen in Figure 5. In comparison with the performance of the models on the test set, the metric scores on the external validation set showed a slight decrease. The RF model still performed the best, obtaining an accuracy of 0.799, F1‐score of 0.857, AUC of 0.823, sensitivity of 0.833 and specificity of 0.797.
Table 3.
Performance of different models in the prediction of atherosclerotic cardiovascular disease risk in type 2 diabetes mellitus patients in the external validation set
| Model | AUC | Accuracy | F1‐score | Sensitivity | Specificity |
|---|---|---|---|---|---|
| LR | 0.800 | 0.712 | 0.798 | 0.750 | 0.711 |
| SVM | 0.812 | 0.701 | 0.790 | 0.750 | 0.700 |
| AdaBoost | 0.820 | 0.766 | 0.835 | 0.833 | 0.763 |
| GBDT | 0.821 | 0.766 | 0.835 | 0.833 | 0.763 |
| RF | 0.823 | 0.799 | 0.857 | 0.833 | 0.797 |
AUC, area under the curve; AdaBoost, adaptive boosting; GBDT, gradient boosting decision tree; LR, logistic regression; RF, random forest; SVM, support vector machine.
Figure 5.

Receiver operating curves for the prediction of atherosclerotic cardiovascular disease using different machine learning models in the external validation set. AdaBoost, adaptive boosting; GBDT, gradient boosting decision tree; LR, logistic regression; RF, random forest; SVM, support vector machine.
Feature importance
The importance matrix plot for the RF model is shown in Figure 6, and showed that the top five most important features contributing to the model were age, diabetes duration, previous history of diabetic peripheral vascular disease, total cholesterol and TG. To explore the positive or negative contribution of a single feature to the model, the SHAP summary plot of RF was used (Figure 7). The higher the SHAP value of a variable, the more likely ASCVD becomes. It was found that previous history of diabetic peripheral vascular disease, older populations, longer diabetes duration, greater hospital grade and a higher level of TG contributed to the risk of ASCVD. Interestingly, type 2 diabetes mellitus patients living in the north of China were associated with a higher risk of ASCVD. Furthermore, the SHAP dependence plot further showed that patients aged >65 years, diabetes duration exceeding 10 months and TG >1.5 mmol/L were likely to represent an increased risk of ASCVD (Figure 8).
Figure 6.
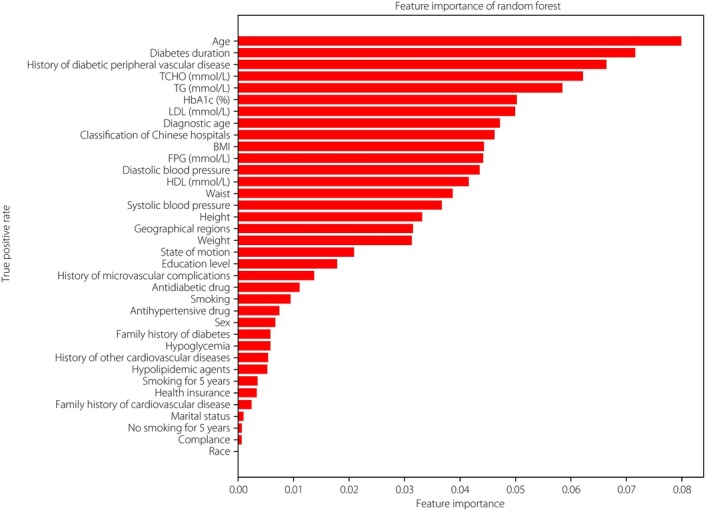
Importance matrix plot of the random forest model. BMI, body mass index; FPG, fasting plasma glucose; HbA1c, glycosylated hemoglobin; HDL, high‐density lipoprotein cholesterol; LDL, low‐density lipoprotein cholesterol; TCHO, total cholesterol; TG, triglycerides.
Figure 7.

SHapley Additive explanation (SHAP) summary plot of the 10 most predictive features of the RF model. HbA1c, glycosylated hemoglobin; TCHO, total cholesterol; TG, triglycerides.
Figure 8.

SHapley Additive exPlanation (SHAP) dependence plot of the random forest model for (a) age, (b) diabetes duration, (c) triglycerides (TG) and (d) diagnostic age.
To investigate the impact of different features on the prediction of ASCVD risk, we carried out a comparison experiment. Four additional models, incorporating clinical features, laboratory features, the top 10 ranked features by importance and the top 20 ranked features by importance, were developed using RF, respectively. The detailed features of each model are presented in Table 4. The results of the experiment, as shown in Table 5, show that patient clinical features contribute more to the model than laboratory features. The model using all features performed the best, whereas the model using only the top 20 ranked features also showed strong predictive ability for ASCVD risk, with an AUC of 0.852, accuracy of 0.819, F1‐score of 0.822, sensitivity of 0.811 and specificity of 0.829.
Table 4.
Features used in different models for the prediction of atherosclerotic cardiovascular disease risk in individuals with type 2 diabetes mellitus
| Features | Laboratory | Clinical | Top 10 | Top 20 | All |
|---|---|---|---|---|---|
| Hospital information | |||||
| Classification of Chinese hospitals | ✓ | ✓ | ✓ | ✓ | |
| Geographical regions | ✓ | ✓ | ✓ | ||
| Demographic characteristics | |||||
| Sex | ✓ | ✓ | |||
| Race | ✓ | ✓ | |||
| Age | ✓ | ✓ | ✓ | ✓ | |
| Height (cm) | ✓ | ✓ | ✓ | ||
| Weight (kg) | ✓ | ✓ | ✓ | ||
| BMI | ✓ | ✓ | ✓ | ✓ | |
| Waist (cm) | ✓ | ✓ | ✓ | ||
| Diastolic blood pressure | ✓ | ✓ | ✓ | ||
| Systolic blood pressure | ✓ | ✓ | ✓ | ||
| Smoking | ✓ | ✓ | |||
| Smoking for 5 years | ✓ | ✓ | |||
| No smoking for 5 years | ✓ | ✓ | |||
| State of motion | ✓ | ✓ | ✓ | ||
| Marital status | ✓ | ✓ | |||
| Education level | ✓ | ✓ | ✓ | ||
| Health insurance | ✓ | ✓ | |||
| Compliance | ✓ | ✓ | |||
| Hypoglycemia | ✓ | ✓ | |||
| Laboratory indexes | |||||
| HbA1c (%) | ✓ | ✓ | ✓ | ✓ | |
| FPG (mmol/L) | ✓ | ✓ | ✓ | ||
| TCHO (mmol/L) | ✓ | ✓ | ✓ | ✓ | |
| HDL (mmol/L) | ✓ | ✓ | ✓ | ||
| LDL (mmol/L) | ✓ | ✓ | ✓ | ✓ | |
| TG (mmol/L) | ✓ | ✓ | ✓ | ✓ | |
| Disease history | |||||
| Family history of diabetes | ✓ | ✓ | |||
| Family history of cardiovascular disease | ✓ | ✓ | |||
| History of diabetic peripheral vascular disease | ✓ | ✓ | ✓ | ✓ | |
| History of microvascular complications | ✓ | ✓ | |||
| History of other cardiovascular diseases | ✓ | ✓ | |||
| Diagnostic age | ✓ | ✓ | ✓ | ✓ | |
| Diabetes duration | ✓ | ✓ | ✓ | ✓ | |
| Medicine information | |||||
| Antidiabetic drug | ✓ | ✓ | |||
| Antihypertensive drug | ✓ | ✓ | |||
| Hypolipidemic agents | ✓ | ✓ | |||
BMI, body mass index; FPG, fasting plasma glucose; HbA1c, glycosylated hemoglobin; HDL, high‐density lipoprotein cholesterol; LDL, low‐density lipoprotein cholesterol; TCHO, total cholesterol; TG, triglyceride.
Table 5.
Performance of random forest models with different variables in predicting atherosclerotic cardiovascular disease risk in type 2 diabetes mellitus patients in the test set
| Variables | AUC | Accuracy | F1‐score | Sensitivity | Specificity |
|---|---|---|---|---|---|
| Laboratory | 0.665 | 0.653 | 0.662 | 0.662 | 0.643 |
| Clinical | 0.842 | 0.792 | 0.795 | 0.784 | 0.8 |
| Top 10 | 0.821 | 0.757 | 0.759 | 0.743 | 0.771 |
| Top 20 | 0.852 | 0.819 | 0.822 | 0.811 | 0.829 |
| All | 0.859 | 0.826 | 0.832 | 0.838 | 0.814 |
AUC, area under the curve.
DISCUSSION
In the present study, we described details of five ML models capable of stratifying ASCVD risk in Chinese type 2 diabetes mellitus patients with high sensitivity and specificity. The feature importance analysis provides information on which variables are most important in predicting risk and how each feature is associated with the outcome. These results foster confidence in the adoption of ML in clinical settings.
The five ML models achieved good performance, with the RF model showing the best discrimination ability in both the test set (AUC 0.859) and the external validation set (AUC 0.823). This is consistent with the results of a previous study that investigated six ML methods to build CVD prediction models, and found RF outperforming the other methods (AUC 0.787) 27 . One possible explanation for its good performance is that RF combines multiple models to overcome the limitations of a single model, thereby reducing variance and improving prediction accuracy.
The ML risk prediction models update previous CVD risk scores developed using conventional statistical methods. Most classical risk scores were developed in Western settings and did not work well in Asian populations 28 . These models need to be validated and updated before their actual use in clinical practice in China. The China‐PAR equations were established from Chinese cohorts, and performed well in predicting ASCVD risk with good internal consistency and external validation 29 . However, it is designed for the general population, the performance of which might be impaired when applied to patients with type 2 diabetes mellitus. The models in the present study were developed specifically from a recent Chinese type 2 diabetes mellitus cohort. Taking advantage of handling big data, many more variables, including diabetes mellitus‐specific variables, were incorporated into our ML models, which enables a more detailed description of the characteristics of type 2 diabetes mellitus patients and therefore a more accurate prediction of ASCVD risk.
History of diabetic peripheral vascular disease was found to be the most important factor for predicting ASCVD in type 2 diabetes mellitus patients. In these patients, peripheral artery disease has an early onset, progresses rapidly and is always asymptomatic, making this condition underdiagnosed and undertreated 30 . Evidence has shown that peripheral artery disease is a strong predictor of coronary artery disease 31 . It is estimated that ischemic stroke, myocardial infarction and vascular death occur in 5%–7% of patients with peripheral artery disease per year 32 . Based on the above findings, early identification and intervention of complications in type 2 diabetes mellitus patients are necessary and urgent to reduce the progression of cardiovascular events.
Dyslipidemia is indeed associated with an increased risk of cardiovascular events 33 , and plays a key role in atherosclerosis. Patients with type 2 diabetes mellitus typically develop a set of lipid anomalies, including low high‐density lipoprotein cholesterol, high TG, elevated levels of small dense low‐density lipoprotein (despite the presence of low‐density lipoprotein cholesterol levels commonly in the normal range) and remnant lipoproteins. There is evidence that high TG might lead to increased cardiovascular mortality in diabetes patients 34 . Additionally, total cholesterol has previously been widely used to account for cardiovascular risk 35 .
Geographic regions have also been found to be associated with CVD risk in previous studies 9 . This might be due to the different geographical profiles of the CVD risk factors, such as obesity and hypertension (north China), and consumption of unhealthy non‐staple food (low intake of fruits and vegetables or high intake of red meat; northeast China) 36 . In addition, we found a positive association between hospital level and ASCVD risk, which might be caused by the tendency of patients with more severe diseases to visit higher‐level hospitals. Furthermore, both low and high glycosylated hemoglobin (HbA1c) were found to be associated with increased ASCVD risk the present study. A certain number of studies have shown a relationship between higher HbA1c levels and a higher risk of cardiovascular events 37 . The danger of low HbA1c has been identified by a previous study, which showed that compared with mid‐level HbA1c, low HbA1c was associated with increased all‐cause mortality 38 . In terms of the effect of education level, the present results are contrary to what is commonly believed. One possible explanation is that people with higher education levels usually work in jobs with less physical activity. Overall, the feature importance analysis in our study yielded meaningful insights into the impact of the considered risk factors on the ensemble model's decisions, making the model interpretable and able to support clinical decision‐making.
One of the strengths of the present study is the incorporation of a considerable number of patients representative of the Chinese type 2 diabetes mellitus population. These samples increase the applicability of the model in clinical practice in China. In contrast, existing ASCVD risk prediction models in type 2 diabetes mellitus are mainly based on advanced statistics, such as logistic regression and Cox proportional hazard regression. In this study, five ML models were successfully established, justifying the efficiency of state‐of‐the‐art ML approaches in predicting complications of patients with type 2 diabetes mellitus. Compared with traditional statistics, ML methods are better able to handle large and complex datasets 39 . Furthermore, we compared the performance of models incorporating different types of features and found that models using all features, including clinical and laboratory features, performed best.
Limitations of the present study should be acknowledged. First, compared with the diabetes lifetime‐perspective prediction (DIAL) model, whose prediction outcomes include CVD‐free life expectancy, lifetime risk and 10‐year CVD risk in people with type 2 diabetes mellitus, our predictive end‐points were limited to the 3‐year ASCVD risk only. Second, additional features that might help improve ASCVD risk prediction, such as socioeconomic status, triglyceride‐glucose index and coronary calcium scores, have not been incorporated into this model due to difficulties or deficiencies in data collection. Furthermore, possible changes in risk factor levels over time were not taken into account. For example, blood pressure and cholesterol levels were assumed to remain stable over time, which might not correspond to reality. Overall, ML models in this study are largely considered exploratory, requiring future external validation studies before clinical implementation.
Considering the importance of assessing and stratifying ASCVD risk in type 2 diabetes mellitus patients, prediction models have increasingly been included in clinical guidelines 3 . The latest European Society of Cardiology guidelines specifically recommend the use of the DIAL model to assess lifetime CVD risk in patients with type 2 diabetes mellitus 40 . Future work will focus on the external validation of the proposed methods on datasets of larger size and heterogeneity to accomplish the ultimate goal of providing a reliable ASCVD risk prediction model for clinical practice. Furthermore, integrating the model into a Web‐based medical decision support system that incorporates concise and user‐friendly charts and tables is expected to facilitate clinical utility.
In conclusion, the present study shows that ML algorithms, especially RF, can precisely predict ASCVD risk, and thus aid in clinical decision‐making and resource allocation. We provide an exploratory tool for early ASCVD risk assessment and stratification in Chinese type 2 diabetes mellitus patients, making it possible to personalize treatment and maximize the benefits of these medical interventions. Furthermore, the interpretability of our model helps provide clinicians with insights into the predictors, which are most important in the prediction of ASCVD risk.
DISCLOSURE
The authors declare no conflict of interest. Linong Ji is an Editorial Board member of Journal of Diabetes Investigation and a co‐author of this article. To minimize bias, he was excluded from all editorial decision‐making related to the acceptance of this article for publication.
Approval of the research protocol: Protocol for the research project has been approved. Ethical approval was obtained by the ethics committees of Peking University People's Hospital and all participating hospitals, and it conforms to the provisions of the Declaration of Helsinki.
Informed consent: All patients signed the informed consent before data collection.
Registry and the registration no. of the study/trial: N/A.
Animal studies: N/A.
ACKNOWLEDGMENTS
This work was supported by Shanghai AI Laboratory and Beijing Municipal Science & Technology Commission (Project No.: Z181100001618010).
Contributor Information
Jie Xu, Email: xujie@pjlab.org.cn.
Linong Ji, Email: jiln@bjmu.edu.cn.
REFERENCES
- 1. Magliano D, Boyko EJ. IDF Diabetes Atlas. Brussels, Belgium: International Diabetes Federation, 2021. [PubMed] [Google Scholar]
- 2. Ke C, Narayan KV, Chan JC, et al. Pathophysiology, phenotypes and management of type 2 diabetes mellitus in Indian and Chinese populations. Nat Rev Endocrinol 2022; 18: 413–432. [DOI] [PMC free article] [PubMed] [Google Scholar]
- 3. Draznin B, Aroda VR, Bakris G, et al. 10. Cardiovascular disease and risk management: Standards of medical Care in Diabetes‐2022. Diabetes Care 2022; 45(Supplement_1): S144–S174. [DOI] [PubMed] [Google Scholar]
- 4. Arnett DK, Blumenthal RS, Albert MA, et al. 2019 ACC/AHA guideline on the primary prevention of cardiovascular disease: Executive summary: A report of the American College of Cardiology/American Heart Association task force on clinical practice guidelines. Circulation 2019; 140: e563–e595. [DOI] [PMC free article] [PubMed] [Google Scholar]
- 5. Petruzzo M, Reia A, Maniscalco GT, et al. The Framingham cardiovascular risk score and 5‐year progression of multiple sclerosis. Eur J Neurol 2021; 28: 893–900. [DOI] [PubMed] [Google Scholar]
- 6. D'Agostino RB, Grundy S, Sullivan LM, et al. Validation of the Framingham coronary heart disease prediction scores: Results of a multiple ethnic groups investigation. JAMA 2001; 286: 180–187. [DOI] [PubMed] [Google Scholar]
- 7. Chen J, Budoff MJ, Reilly MP, et al. Coronary artery calcification and risk of cardiovascular disease and death among patients with chronic kidney disease. JAMA Cardiol 2017; 2: 635–643. [DOI] [PMC free article] [PubMed] [Google Scholar]
- 8. McClelland RL, Jorgensen NW, Budoff M, et al. 10‐year coronary heart disease risk prediction using coronary artery calcium and traditional risk factors: Derivation in the MESA (multi‐ethnic study of atherosclerosis) with validation in the HNR (Heinz Nixdorf recall) study and the DHS (Dallas heart study). J Am Coll Cardiol 2015; 66: 1643–1653. [DOI] [PMC free article] [PubMed] [Google Scholar]
- 9. Yang X, Li J, Hu D, et al. Predicting the 10‐year risks of atherosclerotic cardiovascular disease in Chinese population: The China‐PAR project (prediction for ASCVD risk in China). Circulation 2016; 134: 1430–1440. [DOI] [PubMed] [Google Scholar]
- 10. Pylypchuk R, Wells S, Kerr A, et al. Cardiovascular disease risk prediction equations in 400 000 primary care patients in New Zealand: A derivation and validation study. Lancet 2018; 391: 1897–1907. [DOI] [PubMed] [Google Scholar]
- 11. DeFilippis AP, Young R, Carrubba CJ, et al. An analysis of calibration and discrimination among multiple cardiovascular risk scores in a modern multiethnic cohort. Ann Intern Med 2015; 162: 266–275. [DOI] [PMC free article] [PubMed] [Google Scholar]
- 12. Dalton JE, Perzynski AT, Zidar DA, et al. Accuracy of cardiovascular risk prediction varies by neighborhood socioeconomic position: a retrospective cohort study. Ann Intern Med 2017; 167: 456–464. [DOI] [PMC free article] [PubMed] [Google Scholar]
- 13. Piri J, Mohapatra P. An analytical study of modified multi‐objective Harris hawk optimizer towards medical data feature selection. Comput Biol Med 2021; 135: 104558. [DOI] [PubMed] [Google Scholar]
- 14. Zreik M, Van Hamersvelt RW, Wolterink JM, et al. A recurrent CNN for automatic detection and classification of coronary artery plaque and stenosis in coronary CT angiography. IEEE Trans Med Imaging 2018; 38: 1588–1598. [DOI] [PubMed] [Google Scholar]
- 15. Shi Z, Miao C, Schoepf UJ, et al. A clinically applicable deep‐learning model for detecting intracranial aneurysm in computed tomography angiography images. Nat Commun 2020; 11: 6090. [DOI] [PMC free article] [PubMed] [Google Scholar]
- 16. Flores AM, Demsas F, Leeper NJ, et al. Leveraging machine learning and artificial intelligence to improve peripheral artery disease detection, treatment, and outcomes. Circ Res 2021; 128: 1833–1850. [DOI] [PMC free article] [PubMed] [Google Scholar]
- 17. Li Q, Campan A, Ren A, et al. Automating and improving cardiovascular disease prediction using machine learning and EMR data features from a regional healthcare system. Int J Med Inform 2022; 163: 104786. [DOI] [PubMed] [Google Scholar]
- 18. Nabrdalik K, Kwiendacz H, Drożdż K, et al. Machine learning predicts cardiovascular events in patients with diabetes: The Silesia diabetes‐heart project. Curr Probl Cardiol 2023; 48: 101694. [DOI] [PubMed] [Google Scholar]
- 19. Ji L, Hu D, Pan C, et al. Primacy of the 3B approach to control risk factors for cardiovascular disease in type 2 diabetes patients. Am J Med 2013; 126: 925.e11–925.e22. [DOI] [PubMed] [Google Scholar]
- 20. Zhang H, Jiang L, Webb GI. Rigorous non‐disjoint discretization for naive Bayes. Pattern Recognit 2023; 140: 109554. [Google Scholar]
- 21. Jia W, Weng J, Zhu D, et al. Standards of medical care for type 2 diabetes in China 2019. Diabetes Metab Res Rev 2019; 35: e3158. [DOI] [PubMed] [Google Scholar]
- 22. Hosmer DW Jr, Lemeshow S, Sturdivant RX. Applied Logistic Regression. Hoboken, NJ: John Wiley & Sons, 2013. [Google Scholar]
- 23. Platt J. Sequential Minimal Optimization: A Fast Algorithm for Training Support Vector Machines. 1998.
- 24. Friedman JH. Greedy function approximation: A gradient boosting machine. Ann Stat 2001; 29: 1189–1232. [Google Scholar]
- 25. Breiman L. Random forests. Mach Learn 2001; 45: 5–32. [Google Scholar]
- 26. Freund Y, Schapire RE. A decision‐theoretic generalization of on‐line learning and an application to boosting. J Comput Syst Sci 1997; 55: 119–139. [Google Scholar]
- 27. Yang L, Wu H, Jin X, et al. Study of cardiovascular disease prediction model based on random forest in eastern China. Sci Rep 2020; 10: 5245. [DOI] [PMC free article] [PubMed] [Google Scholar]
- 28. Jung KJ, Jang Y, Oh DJ, et al. The ACC/AHA 2013 pooled cohort equations compared to a Korean risk prediction model for atherosclerotic cardiovascular disease. Atherosclerosis 2015; 242: 367–375. [DOI] [PubMed] [Google Scholar]
- 29. Expert Panel on Detection, Evaluation, and Treatment of High Blood Cholesterol in Adults . Executive summary of the third report of the National Cholesterol Education Program (NCEP) expert panel on detection, evaluation, and treatment of high blood cholesterol in adults (adult treatment panel III). JAMA 2001; 285: 2486–2497. [DOI] [PubMed] [Google Scholar]
- 30. Peach G, Griffin M, Jones K, et al. Diagnosis and management of peripheral arterial disease. BMJ 2012; 345: 345. [DOI] [PubMed] [Google Scholar]
- 31. Criqui MH, Matsushita K, Aboyans V, et al. Lower extremity peripheral artery disease: contemporary epidemiology, management gaps, and future directions: a scientific statement from the American Heart Association. Circulation 2021; 144: e171–e191. [DOI] [PMC free article] [PubMed] [Google Scholar]
- 32. Campia U, Gerhard‐Herman M, Piazza G, et al. Peripheral artery disease: past, present, and future. Am J Med 2019; 132: 1133–1141. [DOI] [PubMed] [Google Scholar]
- 33. Nordestgaard BG, Varbo A. Triglycerides and cardiovascular disease. Lancet 2014; 384: 626–635. [DOI] [PubMed] [Google Scholar]
- 34. Taskinen M‐R, Borén J. New insights into the pathophysiology of dyslipidemia in type 2 diabetes. Atherosclerosis 2015; 239: 483–495. [DOI] [PubMed] [Google Scholar]
- 35. Liu J, Hong Y, D'Agostino RB Sr, et al. Predictive value for the Chinese population of the Framingham CHD risk assessment tool compared with the Chinese multi‐provincial cohort study. JAMA 2004; 291: 2591–2599. [DOI] [PubMed] [Google Scholar]
- 36. Li X, Wu C, Lu J, et al. Cardiovascular risk factors in China: A nationwide population‐based cohort study. Lancet Public Health 2020; 5: e672–e681. [DOI] [PubMed] [Google Scholar]
- 37. Kranenburg G, van der Graaf Y, van der Leeuw J, et al. The relation between HbA1c and cardiovascular events in patients with type 2 diabetes with and without vascular disease. Diabetes Care 2015; 38: 1930–1936. [DOI] [PubMed] [Google Scholar]
- 38. Inoue K, Nianogo R, Telesca D, et al. Low HbA1c levels and all‐cause or cardiovascular mortality among people without diabetes: the US National Health and nutrition examination survey 1999–2015. Int J Epidemiol 2021; 50: 1373–1383. [DOI] [PMC free article] [PubMed] [Google Scholar]
- 39. Ngiam KY, Khor W. Big data and machine learning algorithms for health‐care delivery. Lancet Oncol 2019; 20: e262–e273. [DOI] [PubMed] [Google Scholar]
- 40. Berkelmans GF, Gudbjörnsdottir S, Visseren FL, et al. Prediction of individual life‐years gained without cardiovascular events from lipid, blood pressure, glucose, and aspirin treatment based on data of more than 500 000 patients with type 2 diabetes mellitus. Eur Heart J 2019; 40: 2899–2906. [DOI] [PMC free article] [PubMed] [Google Scholar]