

Summary
An immune correlate of risk (CoR) is an immunologic biomarker in vaccine recipients associated with an infectious disease clinical endpoint. An immune correlate of protection (CoP) is a CoR that can be used to reliably predict vaccine efficacy (VE) against the clinical endpoint and hence is accepted as a surrogate endpoint that can be used for accelerated approval or guide use of vaccines. In randomized, placebo-controlled trials, CoR analysis is limited by not assessing a causal vaccine effect. To address this limitation, we construct the controlled risk curve of a biomarker, which provides the causal risk of an endpoint if all participants are assigned vaccine and the biomarker is set to different levels. Furthermore, we propose a causal CoP analysis based on controlled effects, where for the important special case that the biomarker is constant in the placebo arm, we study the controlled vaccine efficacy curve that contrasts the controlled risk curve with placebo arm risk. We provide identification conditions and formulae that account for right censoring of the clinical endpoint and two-phase sampling of the biomarker, and consider G-computation estimation and inference under a semiparametric model such as the Cox model. We add modular approaches to sensitivity analysis that quantify robustness of CoP evidence to unmeasured confounding. We provide an application to two phase 3 trials of a dengue vaccine indicating that controlled risk of dengue strongly varies with 50 neutralizing antibody titer. Our work introduces controlled effects causal mediation analysis to immune CoP evaluation.
Keywords: Controlled direct effects, COVID-19 vaccine, Dengue vaccine efficacy, E-value, Immune correlate of protection, Sensitivity analysis
1. Introduction
Safe and effective vaccines to prevent SARS-CoV-2 acquisition and coronavirus disease 2019 (COVID-19) disease are needed to curtail the COVID-19 pandemic. Approval of a vaccine requires demonstration that the vaccine confers a favorable benefit-to-risk profile in reducing clinically significant endpoints, usually established through phase 3 randomized, placebo-controlled, vaccine efficacy (VE) trials (e.g., Baden and others, 2021). Where SARS-CoV-2 vaccines are approved and widely locally available, placebo arms in future efficacy trials will likely be infeasible. Thus, there is a need for alternative approaches to approving SARS-CoV-2 vaccines, such as surrogate endpoint trials that use as primary endpoint an antibody response biomarker measured postvaccination. Effectiveness of this approach would require that the biomarker be measured using a validated assay and has been “scientifically well established to reliably predict clinical benefit” (traditional approval) or be “reasonably likely to predict clinical benefit” (accelerated approval) (Fleming and Powers, 2012; US Food and Drug Administration, 1999).
Immunologic surrogate endpoints based on binding or functional antibody assays have been accepted by regulatory agencies for many licensed vaccines (Plotkin, 2010; Plotkin and Gilbert, 2018). Acceptance has been based on evidence from a variety of sources, including statistical analysis of phase 3 VE trials, natural history studies, vaccine challenge studies in animals and in humans, and passive monoclonal antibody transfer studies (Plotkin, 2010). Phase 3 trials constitute one of the most important sources of evidence, because they rigorously characterize the level of VE, and biomarker levels from breakthrough infection or disease case samples can be analyzed and contrasted with biomarker levels from noncase samples to infer immune correlates of risk (CoRs) and immune correlates of protection (CoPs) (Qin and others, 2007). By CoR, we mean an immunologic biomarker measured from vaccine recipients associated with subsequent occurrence of a clinical endpoint of interest (Qin and others, 2007). In contrast, by CoP, we mean an immunologic biomarker that has been established to provide reliable predictions of VE and hence has been accepted for use in either accelerated or traditional approval (Plotkin and Gilbert, 2018). Establishing a CoP typically requires multiple phase 3 placebo-controlled trials, with the placebo arm needed to enable assessment of criteria for a valid CoP within various statistical frameworks, including surrogate endpoint evaluation (Prentice, 1989; Molenberghs and others, 2008), principal stratification VE moderation evaluation (Follmann, 2006; Moodie and others, 2018), natural effects mediation evaluation (Cowling and others, 2019), stochastic interventional VE evaluation (Hejazi and others, 2021), and meta-analysis (Molenberghs and others, 2008).
This manuscript has two objectives. The first is to propose a new causal inference approach to CoP evaluation based on randomized, placebo-controlled trials—controlled risk and controlled vaccine efficacy (CVE) analysis. Closely linked to the first objective, the second is to propose a causal inference approach to CoP evaluation based on analysis of the vaccine arm only, which is especially relevant for studies without a placebo arm. As a case in point, several ongoing SARS-CoV-2 placebo-controlled VE trials have crossed over placebo recipients to the vaccine arm (Baden and others, 2021), precluding the study of CoPs against longer-term endpoints via methods requiring a contemporaneous placebo arm. These trials follow large numbers of vaccine recipients for SARS-CoV-2 acquisition and disease outcomes, providing the requisite data for CoP analysis based on the vaccine arm only.
Based on analysis of a vaccinated group in a phase 3 or postapproval trial, regression methods (e.g., Cox regression accounting for case-cohort biomarker sampling (Moodie and others, 2018)) may be used to identify CoRs. However, a CoR may fail to be a CoP, because the association parameter (e.g., hazard ratio) may not reflect a causal relationship (VanderWeele, 2013). Consequently, identification of a CoR—while an important intermediate step—is insufficient for validating a CoP (Prentice, 1989; Fleming and Powers, 2012). We address this challenge in two steps. First, building on ideas from Joffe and Greene (2009) applied to the VE trial setting, we define two causal effect parameters whose interpretations directly address criteria for a CoP, and derive formal inferential procedures. Second, acknowledging that estimation of these two parameters requires the absence of unmeasured confounders, we propose a sensitivity analysis and conservative estimation strategy that accounts for potential violations of this assumption.
2. Controlled risk and VE CoPs
2.1. Notation and counterfactual definitions
Let  indicate assignment to vaccine, and, if the study included a placebo, let
  indicate assignment to placebo. Let
  be a vector of baseline covariates chosen with purpose to render the identifiability assumptions of Sections 2.2 and 3.1 as plausible as possible.
  may also include additional baseline prognostic factors that are not strictly needed for identification but may increase the precision of resulting inferences. Let
  be an immunologic biomarker measured at a given postvaccination visit occurring at some fixed time
  , for example, the Day 57 visit in the Moderna COVE phase 3 trial (Baden and others, 2021). Let
  be the time from baseline until the clinical endpoint of interest. We will focus on studying the occurrence of the endpoint by a given fixed time
  of interest after
  . We assume that
  for each participant but discuss a relaxation of this assumption in Section A of the Supplementary Material available at Biostatistics online.
For each  , we denote by
  and
and  the potential values of
  and
and  , respectively, under an intervention that sets
  , and by
  the potential value of
  under an intervention that sets both
  and
and  . The controlled risk
 |
(2.1) |
is the probability of endpoint occurrence by  in the counterfactual scenario in which all trial participants are assigned to
  and have their biomarker level
  set to
  . For
. For  , this counterfactual estimand is defined even in the absence of a placebo arm. We refer to the function
  corresponding to vaccine recipients as the controlled risk curve. For a placebo-controlled trial, we define the CVE surface as
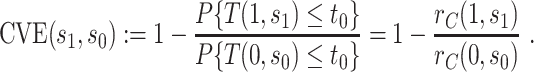 |
(2.2) |
In the literature on controlled effects causal mediation (Robins and Greenland, 1992; Pearl, 2001; Joffe and Greene, 2009), for any value  ,
,  represents an average controlled direct effect at
  based on a multiplicative (rather than the traditional additive) contrast.
For many VE trials, including COVID-19 and HIV-1 studies, the primary study population is naive to the pathogen under study. Consequently, because  measures an adaptive immune response specific to the pathogen,
  is known to be “negative” (i.e., below the assay limit
  of detection) for all placebo recipients. By convention, we set such negative values to an arbitrary number
  . In this scenario in which
  is constant,
  is well-defined for
  but undefined for all
  ; see Gilbert and others (2011) for further discussion of this point. Therefore, in this scenario, the CVE surface can be summarized by the CVE curve
  , defined over possible values that
  can take. Because in this scenario
  almost surely, the CVE curve at biomarker level
  can be expressed as
 |
(2.3) |
For other VE trials, the primary study population may instead include individuals previously infected with the pathogen, so that  varies also in placebo recipients. In this case, the surface
  can be considered over scientifically relevant values of
  .
.
In either scenario, the vaccine arm provides the most relevant information for adjudicating a CoP, and we define  to be a controlled risk CoP if
  varies in
  . The curve
  describes the strength and nature of the CoP, with a most useful CoP having a large decrease in
  as
as  moves from small to large values. For a placebo-controlled trial with
  constant, we define
  to be a CVE CoP if
  varies in
  . An ideal CoP has
 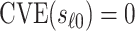 —that is, no average controlled direct effect at level
  —indicating that
  fully mediates the effect of the vaccine. For
  variable, we define
  to be a CVE CoP if
  varies in
  for
for  , and an ideal CoP has no average direct effects:
 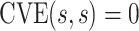 for all
  .
.
In the constant  scenario, because
  depends on
  entirely through
  ,
,  is a controlled risk CoP if and only if it is a CVE CoP. In this case, the distinction for applications is whether a placebo arm is available. Where available, a CVE CoP has a preferred interpretation, namely facilitating the prediction of VE in new settings (immunobridging). Advantageously, in the constant
  scenario,
  has a special connection to the natural effects mediation literature (Cowling and others, 2019), where the average controlled direct effect at
  equals the natural direct effect, and VE is completely mediated through
  if and only if
  .
.
2.2. Basic identification formulas with fully observed data
We first consider a simplified trial setting in which the data unit available on each study participant consists of  , where
  is independent of
  for each
  by randomization. Define the marginalized risk at level
  to be
to be
 |
(2.4) |
with  and where the outer expectation is over the marginal distribution of
  in the study population. The expression for
  is the single time-point G-computation formula, equivalent to direct standardization using the marginal distribution of
  as standard. We focus on the vaccine arm parameter
  . The placebo arm parameter
  can be studied similarly in the variable
  scenario. In the constant
  scenario,
  is only defined for
  , with
The parameter  is a CoR association parameter, which averages the biomarker-conditional risk over the marginal distribution of
  . In contrast,
  and
and  are causal parameters, which means they convey more useful information for whether and how a biomarker
  meets the “provisional approval” goalpost that an immunologic biomarker is reasonably likely to predict VE. To illustrate this, we note that if
  for
for  , then by definition, risk decreases (and VE increases) if the antibody biomarker is increased from
  to
to  . In contrast, this implication does not necessarily follow if
  for
for  , because an unmeasured confounder not included in
  could create a reversal wherein
  even though
  .
.
Suppose that, for a given biomarker level  : (A1) the Stable Unit Treatment Value assumption (stated in Section B.1.1 of the Supplementary Material available at Biostatistics online) holds; (A2) the covariate vector
  is sufficient to deconfound the relationship between
  and
and  (stated in two parts as (A2.1) and (A2.2) below), and (A3) there is sufficient overlap, in that the conditional density function of
  evaluated at
  given
given  and
and  is positive almost surely (positivity assumption). Then, the controlled risk is identified by the marginalized risk:
 |
(2.5) |
For identifying the  surface in the variable
  scenario, conditions (A1) and (A3) are required for both the vaccine and placebo arms. Using the terminology of Joffe and Greene (2009), (A2) can be expressed as requiring both (A2.1) [initial randomization]
  and
and  are independent given
  for each
  , and (A2.2) [strong sequential ignorability]
  and
and  are independent given
  for each
  . In the constant
  scenario, (A2.1) and (A2.2) are only needed for
  , and the assumption that
  and
and  are independent given
  is added to initial randomization. Figure 1 shows the directed acyclic graph (DAG) expressing (A2.1) and (A2.2) (Robins and Greenland, 1992) as well as a DAG relaxing (A2.2) to allow unmeasured confounding
  (addressed in Sections 4 and 5).
Fig. 1.

(A) DAG expressing the causal assumptions (A2.1) (initial randomization) and (A2.2) (strong sequential ignorability); (B) DAG relaxing (A2.2) to a more realistic causal model that allows an unmeasured confounder  of the effect of
  on
on  . The variables in light gray are unobserved.
3. Statistical inference under a two-phase sampling study design
3.1. Identification formulas based on two-phase sampling data with incomplete follow-up
In practice, the time-to-event outcome  is observed subject to right-censoring by a random variable
  , which we can consider to only take values no greater than
  . Since measuring
  is resource-intensive, a two-phase sampling design may be employed, where
  is only measured for a subset of trial participants, possibly selected on the basis of all available data at time
  . The observed data unit for a participant can thus be written as
  , where
  is the observed follow-up time,
  is the event indicator, and
  is the indicator that
  is recorded. The notation
  emphasizes that
  is only available if
  .
.
In view of the missingness induced by two-phase sampling and right-censoring, conditions (A1)–(A3) alone do not identify  . As argued above, under these conditions,
  can be expressed as
  , a summary of the distribution of the ideal observed data unit (i.e., with neither missingness nor loss to follow-up). Additional conditions are needed to express
  itself as a summary of the distribution of the actually observed data unit, namely: (A4)
  is missing at random given
  and
and  , in that
  with
with  ; and (A5)
  is independent of
  given
given  and
and  . In the variable
  scenario, the placebo arm versions of (A4)–(A5) identify
  ; without loss of generality, we focus on
  based on the vaccine arm
  .
.
3.2. Inference on controlled risk and CVE
Various approaches can be used, many of which are based on positing a model for  , estimating the unknown parameters of this model, and obtaining predicted values
  for each vaccine recipient
  . Consistent estimation of
  requires accounting for the biased sampling of the two-phase sampling design, typically by incorporating estimated inverse-probability-of-sampling weights (Prentice, 1986; Breslow and Holubkov, 1997). Consistent estimation of
  can usually be guaranteed in VE trials because the investigator controls which participants are sampled for measurement of
  . Given the resulting estimate
  for each of the
  participants assigned
  ,
,  is then estimated by
 |
(3.6) |
If there is a placebo arm, the average can be taken over vaccine and placebo recipients combined.
For prospective cohort studies or VE trials with two-phase sampling designs for measuring  , semiparametric failure time models (e.g., the semiparametric linear transformation model) have been widely used to estimate the conditional risk
  . For example, Self and Prentice (1988) showed how
  and hence
  can be consistently estimated under (A1)–(A5) through correct specification of a proportional hazards model (Section C of the Supplementary Material available at Biostatistics online). A flexible parametric approach tailored to vaccine studies may also be used (e.g., Son and Fong, 2021). For parametric or simple semiparametric approaches, valid confidence intervals (CIs) for
  can be constructed either via the bootstrap or influence functions.
To reduce the risk of bias due to model misspecification, flexible nonparametric or machine learning-based regression approaches could be used to estimate  (Price and others, 2018; Westling and others, 2021). However, to our knowledge, no nonparametric method currently exists to provide inference on
  while handling all the complexities present in VE trials, including a continuous “exposure”
  measured via two-phase sampling and a continuous failure time subject to right-censoring. Nonparametric methods for this problem are theoretically complex since they admit nonstandard asymptotics (Westling and Carone, 2020) and the nonparametric bootstrap typically fails. Accordingly, in this manuscript, we only consider traditional semiparametric modeling approaches to estimating
  .
.
4. Sensitivity analysis: conservative bound estimation of the controlled risk ratio and controlled risk curve
4.1. E-values and conservative upper bounds
As CoR analysis is based on observational data—the biomarker value is not randomly assigned—a central concern is that unmeasured or uncontrolled confounding of the association between  and
and  could render
  . Therefore, for any two fixed
  values
  and
and  , the estimate of the marginalized risk ratio
  may be biased for the controlled risk ratio
  .
.
Sensitivity analysis is useful for evaluating how strong unmeasured confounding would have to be to explain away an inferred causal association, that is, inference on  indicates an association yet
  is flat in
  . We supplement results on estimation and inference on
  through the equation
  (under the identifiability assumptions) with the reporting of E-values, which summarize the evidence of a causal effect accounting for potential unmeasured confounding. The E-value is the minimum strength of association, on the risk ratio scale, that an unmeasured confounder would need to have with both exposure
  and outcome
  to fully explain away a specific observed exposure–outcome association, conditional on the measured covariates (VanderWeele and Ding, 2017; VanderWeele and Mathur, 2020). We use the E-value defined in terms of marginalized means, such that “explained away” means that under the E-value-level of unmeasured confounding the causal effect would be nullified (
 ). Because
  , evidence for
  is equivalently evidence for
  . Thus, in a placebo-controlled trial,
  can be interpreted as the multiplicative degree of superior VE caused by marker level
  compared to level
  .
.
Consider two marker-level subgroups  and
and  with
with  and
and  . We focus on two prespecified values
  and do not consider simultaneous inference over a set of values. The E-value for the point estimate
  is
is
 |
(4.7) |
The E-value  for the upper 95
 confidence limit
  for
for  is
is
 |
These two E-values quantify confidence in an immunologic biomarker as a controlled risk CoP—and as a CVE CoP in the constant  scenario if there is a placebo arm—with E-values near one suggesting weak support and evidence increasing with greater E-values.
It is also useful to provide conservative estimates of controlled risk ratios and of the controlled risk curve, accounting for unmeasured confounding. We approach these tasks based on the sensitivity/bias analysis approach of Ding and VanderWeele (2016). Define two context-specific sensitivity parameters for any given  :
:  is the maximum risk ratio for the outcome
  comparing any two categories of the unmeasured confounder
  , within either exposure group
  or
or  , conditional on the vector
  of observed covariates; and
  is the maximum risk ratio for any specific level of the unmeasured confounder
  comparing individuals with
  to those with
  , with adjustment already made for the measured covariate vector
  . Thus,
  quantifies the importance of the unmeasured confounder
  for the outcome, and
  quantifies how imbalanced the exposure/marker subgroups
  and
and  are in the unmeasured confounder
  . The two sensitivity parameters are defined mathematically in Section D of the Supplementary Material available at Biostatistics online. We suppose that
  for the values
  used in a data analysis—this is the case of interest for immune correlates assessment.
Define the bias factor
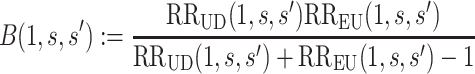 |
for  , and define
  the same way as
  except marginalizing over the joint distribution of
  and
and  . Then, it follows that
  , where
  with
with  and
and  (Ding and VanderWeele, 2016). Translating this result into our context, under (A1) and (A3), we have that
  , so that
 |
(4.8) |
It follows that a conservative (upper bound) estimate of  is
is  , and a conservative 95
 CI is obtained by multiplying each confidence limit for
  by
by  . These estimates account for the presumed-maximum plausible amount of deviation from the no unmeasured confounders assumption specified by user-supplied values
  and
and  . The bound (4.8) holds without making any assumption about the observed potential confounder
  or unmeasured confounder
  (Ding and VanderWeele, 2016).
To provide conservative inference for  , we next select a central value
  of
of  such that
  matches the observed overall risk,
  . At value
  the observed marginalized risk equals the observed overall risk. Next, we “anchor” the analysis by assuming
  where picking the central value
  makes this plausible to be at least approximately true. Under this assumption, the bound (4.8) implies the bounds
 |
(4.9) |
 |
(4.10) |
Therefore, after specifying  and
and  for all
  , we conservatively estimate
  by plugging
  into the formulas (4.9) and (4.10). Because
  is always greater than 1 for
  , formula (4.9) pulls the observed risk
  upwards for subgroups with high biomarker values, and formula (4.10) pulls the observed risk
  downwards for subgroups with low biomarker values. This makes the estimate of the controlled risk curve flatter, closer to the null curve, as desired for a sensitivity/robustness analysis.
To specify  , we note that it should have greater magnitude for a greater distance of
  from
from  , as determined by specifying
  and
and  increasing with
  for
for  . We consider one specific approach, which sets
  to the common value
  specified log-linearly as
  for
for  . Then, for a user-selected pair of fixed values
  and
and  with
with  , we set a sensitivity parameter
  to some value above 1. It follows that, for
  ,
,
 |
Figure 2 illustrates the surfaces determined by  and
and  .
.
Fig. 2.

 and
and  surfaces for
  with user-supplied sensitivity parameter
  with
with  the median of
  and
and  the 95th percentile of
  (the specified degree of unmeasured confounding) where
4.2. Use of marginalized risk and generality of the approach
Our approach focuses on marginalized covariate-adjusted association parameters. This choice provides a simple conversion of the association parameters to causal parameters through the equation  . Moreover, a very common approach to covariate-adjusted CoR analysis consists of fitting a two-phase sampling regression (e.g., logistic, Cox) model to the immunologic biomarker and observed confounders, and reporting estimates of the association parameter (e.g., odds ratio, hazard ratio) corresponding to the immunologic biomarker covariate. Because odds ratios and hazard ratios are not collapsible, the conditional odds ratio and conditional hazard ratio do not in general equal the marginalized odds ratio and marginalized hazard ratio, respectively (Robins and Greenland, 1992; Loux and others, 2017). The dependency of the conditional odds/hazard ratio on the set of confounders conditioned upon may make these parameters less useful for generalizability of inferences than the marginalized parameters. Yet, the same approach applies for alternative marginalized parameters, for example, the marginalized odds ratio
  . The same specification of
  and
and  can be used, as the outcome in VE trials is generally rare (Ding and VanderWeele, 2016; VanderWeele and Ding, 2017).
5. Estimation of CVE with sensitivity analysis
5.1. Constant  scenario
As evidence for a CVE CoP should be robust to potential bias from unmeasured confounding, we propose reporting conservative estimates and CIs for  that include a margin for potential unmeasured confounding making the estimated CVE curve flatter. To do this, we write
  and estimate the bounds (4.9) and (4.10) rather than
  itself. The denominator is the placebo arm marginalized risk, which equals
  in view of randomization; there is thus no concern about unmeasured confounding. Robust and efficient approaches for estimation of this probability accounting for right-censoring include one-step debiasing (Westling and others, 2021) and targeted minimum loss-based estimation (TMLE) (Benkeser and others, 2019); additional details are provided in Section C.2 of the Supplementary Material available at Biostatistics online. We apply the latter for the dengue example that follows. While the bootstrap could be used whenever parametric or certain semiparametric regression approaches are used to estimate
  , we instead consider Wald intervals with influence function-based estimators of the standard error; additional details are provided in Section C.3 of the Supplementary Material available at Biostatistics online.
5.2. Variable  scenario
If  is variable, estimation and inference for
  does not change, whereas estimation and inference for
  proceeds similarly as
  but reversing the role of the vaccine and placebo arms. Again, influence function-based inference can be conducted for
  using a delta method argument. Given that vaccination can generally only increase immune responses compared to nonvaccination/placebo so that
  almost certainly, it is only relevant to study
  for values
  . One strategy for sensitivity analysis is based on the approach described for the constant
  scenario, first applied to inject unmeasured confounding that makes
  flatter, and secondly applied to inject unmeasured confounding that alters
  to further flatten
  . In the dengue example, we apply a simpler approach that only injects unmeasured confounding that flattens the estimated curve
  , assuming no unmeasured confounding for estimation of
  .
.
6. Analysis of two dengue VE trials
In the CYD14 (NCT01373281) (Capeding and others, 2014) and CYD15 (NCT01374516) (Villar and others, 2015) trials, participants were randomized 2:1 to receive CYD-TDV dengue vaccine or placebo, administered at Months 0, 6, and 12. The primary analyses assessed VE against symptomatic, virologically confirmed dengue (VCD) occurring at least 28 days after the third immunization through to the Month 25 visit. The Benkeser and others (2019) TMLE method (unbounded version) implemented with the survtmle R package estimated VE to be 57.0 (95
(95 CI 44.5–65.9) in CYD14 and 61.7
 (95
(95 CI 51.9–68.4) in CYD15. Sanofi Pasteur conducted the CYD14 and CYD15 trials and provided access to the data.
Month 13 (M13) neutralizing antibody (nAb) titers to each serotype were measured through case-cohort Bernoulli random sampling of all randomized participants at enrollment and from all participants who experienced the VCD endpoint after M13 and by Month 25 (cases). A participant’s average M13 log -transformed geometric mean titer across serotypes (“M13 average titer”) has been studied as a CoR of VCD (Vigne and others, 2017; Moodie and others, 2018); we study this biomarker as a controlled risk CoP and as a CVE CoP.
With  the number of days from M13 to VCD studied through
  the M25 visit, we estimate
  using the case-cohort sampling Cox partial likelihood regression method used in Moodie and others (2018) (Section C of the Supplementary Material available at Biostatistics online). The baseline covariate vector
  includes protocol-specified age categories, sex, and country. Participants without VCD through the M13 visit and with M13 average titer measured are included in analyses.
We first investigate how the marginalized risk of VCD compares between vaccine recipients with highest versus lowest tertile values of M13 average titer, coded  and
and  . The tasks of CoR analysis are to estimate
  ,
,  and
and  . Given the sampling design,
  is 1.0 for all observed VCD cases
  and is 0.195 (0.096) for observed noncases
  sampled into the CYD14 (CYD15) subcohort. We estimate each
  based on equation (3.6). We use the bootstrap to obtain 95
 pointwise CIs for each marginalized risk and marginalized risk ratio, which directly provide CIs for each controlled risk and controlled risk ratio assuming no unmeasured confounding (A2.1) and (A2.2). Plugging the results into the E-value formulas quantify robustness to unmeasured confounding. The results in Table 1 show E-values for
  much larger than 1.0 with 95
 CIs lying below 1.0 for both trials, supporting a controlled risk CoP robust to unmeasured confounding. For instance, the CYD15 results with 95
 CI 0.04–0.20 about
  that builds in margin for unmeasured confounding can be interpreted as M13 average titer in the third vs. first tertile causing at least five times (5 = 1/0.20) greater VE, accounting for uncertainty both due to sampling variability and unmeasured confounding.
Table 1.
Analysis of M13 average titer (upper vs. lower tertile) as a CoR and a controlled risk CoP: CYD14 and CYD15 dengue VE trials
Marginalized risk ratio 
|
Controlled risk ratio 
|
e(0,1)
|
||||
|---|---|---|---|---|---|---|
| Trial | Point Est. | 95 CI CI |
Point Est. | 95 CI CI |
Point Est. | 95 CI UL CI UL |
| CYD14 | 0.17 | 0.08–0.29 | 0.38 | 0.18–0.66 | 11.6 | 6.3 |
| CYD15 | 0.05 | 0.02–0.09 | 0.10 | 0.04–0.20 | 43.7 | 22.0 |
 Conservative (upper bound) estimate assuming unmeasured confounding at level
  and thus
  .
.
 E-values are computed for upper tertile
  vs. lower tertile
  biomarker subgroups after controlling for age, sex, and country; UL = upper limit of 95
 confidence interval.
Next, we repeat the analysis treating  as a quantitative variable, where
  is again estimated by two-phase Cox partial likelihood regression. Let
  and
and  be the 15th and 85th percentile of M13 average titer in vaccine recipients. The results for
  are
are  = 0.20 (95
 CI 0.12–0.31) for CYD14 and
  = 0.13 (95
 CI 0.09–0.18) for CYD15. For CYD14, the E-value
  is 9.2, with E-value
  for the upper limit equal to 5.8. For CYD15, the E-value
  is 14.6, with E-value
  for the upper limit equal to 10.5. Next, we set
  , such that
  . The resulting upper bound estimates of the controlled risk ratio are
  = 0.47 (95
 CI 0.28–0.72) for CYD14 and
  = 0.30 (95
 CI 0.19–0.42) for CYD15. Figure 3 shows the sensitivity analysis technique described in Section 4. After building in the margin for unmeasured confounding, for CYD14, estimated VCD risk decreases from 0.032 at low M13 average titer value
  to 0.01 at high titer value
  ; for CYD15, these estimates are 0.033 and 0.008, respectively. Supplementary Figure S2 of the Supplementary Material available at Biostatistics online repeats the analysis under (A2.1) and (A2.2) using Wald CIs constructed using analytic variance estimation based on the influence function of
  under the Cox model (Section C.3 of the Supplementary Material available at Biostatistics online); the intervals are similar to the bootstrap intervals.
Fig. 3.

Analysis of M13 average titer  (quantitative with anti-log
 x-axis label) as a CoR and a controlled risk CoP: CYD14 and CYD15 dengue VE trials. Solid lines are point estimates and dashed lines are 95
 CIs. The bands that start higher on the left with a steeper shape are for marginalized risk
  and the bands with a shallower shape are conservative estimates of controlled risk
  , with
  and hence
  , where
  and
and  are 15th and 85th percentiles of
  .
.
Figure 4 shows results for the  surface for
  with
with  fixed at the median of
  (
(
 for CYD14 (CYD15)). The results show that after accounting for potential unmeasured confounding the point estimate of
  in CYD14 monotonically increases from 30.4
 (95
(95 CI 3.4–48.1) at
  (an average controlled direct effect) to 78.2
 (95
(95 CI 67.4–86.7) at
  . The degree of increase is similar for CYD15: from 37.5
 (95
(95 CI 23.9–48.2) at
  to 77.2
 (95
(95 CI 70.1–84.0) at value
  . This supports a robust controlled VE CoP.
Fig. 4.

Analysis of M13 average titer  (quantitative with anti-log
 x-axis label) as a CVE CoP: CYD14 and CYD15 dengue VE trials. Solid lines are point estimates of
  for
for  with
with  fixed at the median of the distribution of
  [
[
 for CYD14 (CYD15)] and dashed lines are 95
 CIs. The faint lines are estimates of
  assuming no unmeasured confounding and the darker lines are conservative estimates of
  accounting for potential unmeasured confounding, using the same sensitivity parameters as for Figure 3.
For validity, the analyses require positivity (A3). Price and others (2018) showed that M13 average titer in vaccine recipients varied over its whole range at each level of  in CYD14 and in CYD15, supporting this assumption. In conclusion, the evidence for M13 nAb titer as a controlled risk CoP and as a controlled VE CoP is robust to unmeasured confounding. As some vaccine recipients with high titer experienced VCD, the CoP is a relative CoP, not an absolute CoP, in the vaccine field nomenclature (Plotkin, 2010; Plotkin and Gilbert, 2018).
The same methods were applied to the Moderna phase 3 trial (Gilbert and others, 2022).
7. Discussion
In virtually all immune correlates analyses of VE trials or prospective cohort studies, immunologic biomarkers are studied as correlates of risk in vaccine recipients. Given the goal to establish a biomarker as an immune correlate of protection/surrogate endpoint, it is generally of interest to evaluate the extent to which the correlates of risk results—which are based on associational parameters—can be interpreted in terms of causal effects, making them constitute a more reliable basis for decision-making for various vaccine research applications. We proposed a general approach to augment correlates of risk analysis with a conservative analysis of the controlled risk curve  , and also, if there was a randomized placebo arm, of the controlled vaccine efficacy curve
  (if
(if  is constant) and controlled vaccine efficacy surface
  (if
(if  is variable). The approach is general in that it allows the use of any semiparametric modeling method for estimation of the underlying conditional risk curve. It is conservative since it provides estimates and CIs incorporating a specified amount of unmeasured confounding, thus making it more difficult to conclude a controlled risk or controlled vaccine efficacy CoP. For the controlled risk ratio, the conservative estimation and inference is achieved by reporting E-values for the point estimate and upper 95
 confidence limit, whereas for the controlled risk and controlled vaccine efficacy curve/surface it is quantified through a parametrization of the bias function that makes the controlled risk estimate flatter/closer to the null.
In line with VanderWeele and Ding (2017), we do not think a particular E-value magnitude indicating a truly robust result should be prespecified, as the E-value interpretation depends on the problem context, including the study endpoint, the vaccine, the set of potential confounders that are adjusted for, and the plausible magnitude of unmeasured confounders. The assessment of controlled CoPs should include the study of the strength of observed confounding as context for interpreting potential unmeasured confounding (see Section E of the Supplementary Material available at Biostatistics online).
Our sensitivity analysis only addresses unmeasured confounding; violation of the positivity assumption, selection bias, and missing data could also make the controlled CoP results misleading. For prospective cohort studies with investigator control over which blood samples are selected for biomarker measurement, selection bias, and missing data should not be a problem, unless a large percentage of participants have missing blood samples at the biomarker sampling time point. The positivity assumption is required for identification of our causal parameters, and so, we recommend that the approach only be applied if diagnostics support that the biomarker in vaccine recipients tends to vary over its full range within each level of the potential confounders adjusted for. Alternatively, specialized methods designed to be more robust to positivity violations (e.g., van der Laan and Gruber, 2010) could be incorporated into our proposed framework.
Additionally, a premise of the proposed approach is that it is conceivable to assign every vaccine recipient to have an immunologic biomarker set to a given value  . Again, diagnostics may be helpful to examine this premise. For example, if immunocompromised participants tend to have low immune responses, it may be difficult to conceive of assigning their biomarker to the highest levels of
  . One way to address this problem would be to base CoP evaluation on the stochastic interventional risk curve (Hejazi and others, 2021), which sets each vaccine recipient’s biomarker to some random draw from a specified distribution that may be more plausible.
In our application, we relied upon the two-phase Cox regression, a commonly used method, as the basis of the analysis of the marginalized risk curve  . Yet, given the need to control for confounding and minimize systematic bias, it is appealing to alternatively employ nonparametric doubly robust methods for estimating
  under minimal assumptions, along the lines of Westling and others (2021). However, additional research is needed to achieve this goal.
Prior to sensitivity analysis, our methods make the initial randomization and strong sequential ignorability assumptions (Figure 1), which adjust for baseline confounders  of the effect of
  on
on  . In some VE trials, postrandomization confounders
  are collected before
  is measured at
  . Section B of the Supplementary Material available at Biostatistics online describes how our methods can also be applied adjusting for both
  and
and  using longitudinal G-computation.
Among surrogate endpoint evaluation approaches, the principal stratification approach may most closely resemble the controlled vaccine efficacy approach, because it estimates a VE curve across principal strata defined by the level  of the immunologic biomarker if assigned vaccine, or a VE surface across principal strata defined by
  and
and  if assigned vaccine or placebo (Gilbert and Hudgens, 2008), and these analyses produce seemingly similar outputs. However, the two approaches address different scientific objectives, with principal stratification assessing VE across “natural” subgroups without assignment of the marker, whereas controlled effects assign/control the marker level. Thus, an advantage of principal stratification is obviating the need to conceive assignment of a marker that was not randomly assigned, yet this implies the limitation of not fully addressing causal mediation of VE (e.g., VanderWeele, 2008). Consequently, while it is more challenging to conceptualize controlled vaccine efficacy, if this challenge is overcome, then inferences are more relevant for core applications such as bridging, which predicts efficacy for a new population or vaccine based on the marker.
Lastly, the science of the biological assays used to define immunologic biomarkers should be highlighted as fundamental to the establishment and utility of a CoP. Prespecified validation criteria are typically required for an immunologic biomarker to be accepted as a surrogate endpoint (FDA, 2018). Postacceptance, effective use of a surrogate endpoint requires that the biomarker be measured by the same lab that established the CoP, or that a new lab conducting the immunoassay have validated concordance of its assay compared to the original assay conducted by the original lab. Thus, standardization and validation of the immunoassay used to measure the CoP is a basic requirement for use of a CoP for approving/bridging vaccines.
Supplementary Material
Acknowledgments
We thank the participants, investigators, and sponsor (Sanofi Pasteur) of the CYD14 and CYD15 trials, and Lindsay Carpp for technical document contributions.
Conflict of Interest: Peter Gilbert and Youyi Fong have received salary support from Sanofi Pasteur contracts to their institution.
Contributor Information
Peter B Gilbert, Vaccine and Infectious Disease Division, Fred Hutchinson Cancer Center, Seattle, WA, USA and Department of Biostatistics, University of Washington, Seattle, WA, USA.
Youyi Fong, Vaccine and Infectious Disease Division, Fred Hutchinson Cancer Center, Seattle, WA, USA and Department of Biostatistics, University of Washington, Seattle, WA, USA.
Avi Kenny, Department of Biostatistics, University of Washington, Seattle, WA, USA.
Marco Carone, Fred Hutchinson Cancer Center, Vaccine and Infectious Disease Division, 1100 Fairview Ave N, PO Box 19024 Seattle, WA 98109, USA and University of Washington, Department of Biostatistics, Hans Rosling Center for Population Health, 3980 15th Avenue NE, Box 351617 Seattle, WA 98195-1617, USA.
Data and software
The CYD14 and CYD15 data are available upon request to Sanofi Pasteur. The computing code is available at the Github repository https:/github.com/youyifong/CoPcontrolledVE.
Supplementary Material
Supplementary material is available at http://biostatistics.oxfordjournals.org.
Funding
The National Institute Of Allergy and Infectious Diseases of the National Institutes of Health (UM1AI068635 and R37AI054165 to P.B.G.). The content is solely the responsibility of the authors and does not necessarily represent the official views of the National Institutes of Health.
References
- Baden, L. R., ElSahly, H., Essink, B., Kotloff, K., Frey, S., Novak, R., Diemert, D., Spector, S. A., Rouphael, N., Creech, C. B.. and others. (2021). Efficacy and safety of the mRNA-1273 SARS-CoV-2 vaccine. New England Journal of Medicine 384, 403–416. [DOI] [PMC free article] [PubMed] [Google Scholar]
- Benkeser, D., Gilbert, P. B. and Carone, M. (2019). Estimating and testing vaccine sieve effects using machine learning. Journal of the American Statistical Association, 114, 1038–1049. [DOI] [PMC free article] [PubMed] [Google Scholar]
- Breslow, N. E. and Holubkov, R. (1997). Maximum likelihood estimation of logistic regression parameters under two-phase, outcome-dependent sampling. Journal of the Royal Statistical Society: Series B (Statistical Methodology) 59, 447–461. [Google Scholar]
- Capeding, M. R., Tran, N. H., Hadinegoro, S., Muhammad, I., Chotpitayasunondh, T., Chua, M. N., Luong, C. Q., Rusmil, K., Wirawan, D. N., Nallusamy, R.. and others. (2014). Clinical efficacy and safety of a novel tetravalent dengue vaccine in healthy children in Asia: a phase 3, randomised, observer-masked, placebo-controlled trial. The Lancet 384, 1358–1365. [DOI] [PubMed] [Google Scholar]
- Cowling, B. J., Lim, W. W., Perera, R. A., Fang, V. J., Leung, G. M., Peiris, J. M. and Tchetgen Tchetgen, E. J. (2019). Influenza hemagglutination-inhibition antibody titer as a mediator of vaccine-induced protection for influenza B. Clinical Infectious Diseases 68, 1713–1717. [DOI] [PMC free article] [PubMed] [Google Scholar]
- Ding, P. and VanderWeele, T. J. (2016). Sensitivity analysis without assumptions. Epidemiology 27, 368. [DOI] [PMC free article] [PubMed] [Google Scholar]
- FDA, U.S. (2018). Bioanalytical method validation guidance for industry, US department of health and human services. Food and Drug Administration, Center for Drug Evaluation and Research (CDER), Center for Veterinary Medicine (CVM), Biopharmaceutics, 1–44. https://www.fda.gov/files/drugs/published/Bioanalytical-Method-Validation-Guidance-for-Industry.pdf [Google Scholar]
- Fleming, T. R. and Powers, J. H. (2012). Biomarkers and surrogate endpoints in clinical trials. Statistics in Medicine 31, 2973–2984. [DOI] [PMC free article] [PubMed] [Google Scholar]
- Follmann, D. (2006). Augmented designs to assess immune response in vaccine trials. Biometrics 62, 1161–1169. [DOI] [PMC free article] [PubMed] [Google Scholar]
- Gilbert, P. B. and Hudgens, M. G. (2008). Evaluating candidate principal surrogate endpoints. Biometrics 64, 1146–1154. [DOI] [PMC free article] [PubMed] [Google Scholar]
-
Gilbert, P. B., Hudgens, M. G. and Wolfson, J. (2011). Commentary on “
 stratification – a goal or a tool?” by
  . The International Journal of Biostatistics 7, Article 36, 1–15. [DOI] [PMC free article] [PubMed] [Google Scholar]
 - Gilbert, P. B., Montefiori, D. C., McDermott, A. B., Fong, Y., Benkeser, D., Deng, W., Zhou, H., Houchens, C. R., Martins, K., Jayashankar, L.. and others. (2022). Immune correlates analysis of the mRNA-1273 COVID-19 vaccine efficacy clinical trial. Science 375, 43–50. [DOI] [PMC free article] [PubMed] [Google Scholar]
- Hejazi, N., van der Laan, M. J., Janes, H. E., Gilbert, P. B. and Benkeser, D. C. (2021). Efficient nonparametric inference on the effects of stochastic interventions under two-phase sampling, with applications to vaccine efficacy trials. Biometrics 77, 1241–1253. [DOI] [PMC free article] [PubMed] [Google Scholar]
- Joffe, M.M. and Greene, T. (2009). Related causal frameworks for surrogate outcomes. Biometrics 65, 530–538. [DOI] [PubMed] [Google Scholar]
- Loux, T.M., Drake, C. and Smith-Gagen, J. (2017). A comparison of marginal odds ratio estimators. Statistical Methods in Medical Research 26, 155–175. [DOI] [PubMed] [Google Scholar]
- Molenberghs, G., Burzykowski, T., Alonso, A., Assam, P., Tilahum, A. and Buyse, M. (2008). The meta-analytic framework for the evaluation of surrogate endpoints in clinical trials. Journal of Statistical Planning and Inference 138, 432–449. [Google Scholar]
- Moodie, Z., Juraska, M., Huang, Y., Zhuang, Y., Fong, Y., Carpp, L.N., Self, S.G., Chambonneau, L., Small, R., Jackson, N.. and others. (2018). Neutralizing antibody correlates analysis of tetravalent dengue vaccine efficacy trials in Asia and Latin America. Journal of Infectious Diseases 217, 742–753. [DOI] [PMC free article] [PubMed] [Google Scholar]
- Pearl, J. (2001). Direct and Indirect Effects. San Francisco: Morgan Kaufmann. [Google Scholar]
- Plotkin, S. A. (2010). Correlates of protection induced by vaccination. Clinical Vaccine Immunology 17, 1055–1065. [DOI] [PMC free article] [PubMed] [Google Scholar]
- Plotkin, S. A. and Gilbert, P. B. (2018). Correlates of protection. In: Plotkin, S., Orenstein, W., Offit, P. and Edwards, K. (editors), Vaccines, 7th edition. New York: Elsevier Inc., pp. 35–40. [Google Scholar]
- Prentice, R. L. (1986). A case-cohort design for epidemiologic cohort studies and disease prevention trials. Biometrika 73, 1–11. [Google Scholar]
- Prentice, R. L. (1989). Surrogate endpoints in clinical trials: definition and operational criteria. Statistics in Medicine 8, 431–440. [DOI] [PubMed] [Google Scholar]
- Price, B. L., Gilbert, P. B. and van der Laan, M. J. (2018). Estimation of the optimal surrogate based on a randomized trial. Biometrics 74, 1271–1281. [DOI] [PMC free article] [PubMed] [Google Scholar]
- Qin, L., Gilbert, P. B., Corey, L., McElrath, J. and Self, S. G. (2007). A framework for assessing immunological correlates of protection in vaccine trials. The Journal of Infectious Diseases 196, 1304–1312. [DOI] [PubMed] [Google Scholar]
- Robins, J. M. and Greenland, S. (1992). Identifiability and exchangeability of direct and indirect effects. Epidemiology 3, 143–155. [DOI] [PubMed] [Google Scholar]
- Self, S. G. and Prentice, R. L. (1988). Asymptotic distribution theory and efficiency results for case-cohort studies. Annals of Statistics 16, 64–81. [Google Scholar]
- Son, H. and Fong, Y. (2021). Fast grid search and bootstrap-based inference for continuous two-phase polynomial regression models. Environmetrics 32, e2664. [DOI] [PMC free article] [PubMed] [Google Scholar]
- US Food and Drug Administration. (1999). US Code of Federal Regulations FDA Subpart H – accelerated approval of new drugs for serious or life-threatening illnesses. secs. 314.500–314.560. 21 CFR. [Google Scholar]
- van der Laan, M. J. and Gruber, S. (2010). Collaborative double robust targeted maximum likelihood estimation. The International Journal of Biostatistics 6, Article 17, 1–68. [DOI] [PMC free article] [PubMed] [Google Scholar]
- VanderWeele, T. J. (2008). Simple relations between principal stratification and direct and indirect effects. Statistics and Probability Letters 78, 2957–2962. [Google Scholar]
- VanderWeele, T. J. (2013). Surrogate measures and consistent surrogates. Biometrics 69, 561–568. [DOI] [PMC free article] [PubMed] [Google Scholar]
- VanderWeele, T. J. and Ding, P. (2017). Sensitivity analysis in observational research: introducing the E-value. Annals of Internal Medicine 167, 268–274. [DOI] [PubMed] [Google Scholar]
- VanderWeele, T. J. and Mathur, M. B. (2020). Commentary: developing best-practice guidelines for the reporting of E-values. International Journal of Epidemiology 49, 1495–1497. [DOI] [PMC free article] [PubMed] [Google Scholar]
- Vigne, C., Dupuy, M., Richetin, A., Guy, B., Jackson, N., Bonaparte, M., Hu, B., Saville, M., Chansinghakul, D., Noriega, F.. and others. (2017). Integrated immunogenicity analysis of a tetravalent dengue vaccine up to 4 years after vaccination. Human Vaccines & Immunotherapeutics 13, 2004–2016. [DOI] [PMC free article] [PubMed] [Google Scholar]
- Villar, L., Dayan, G. H., Arredondo-García, J. L., Rivera, D. M., Cunha, R., Deseda, C., Reynales, H., Costa, M. S., Morales-Ramírez, J. O., Carrasquilla, G.. and others. (2015). Efficacy of a tetravalent dengue vaccine in children in Latin America. New England Journal of Medicine 372, 113–123. [DOI] [PubMed] [Google Scholar]
- Westling, T. and Carone, M. (2020). A unified study of nonparametric inference for monotone functions. Annals of Statistics 48, 1001–1024. [DOI] [PMC free article] [PubMed] [Google Scholar]
- Westling, T., Luedtke, A., Gilbert, P. and Carone, M. (2021). Inference for treatment-specific survival curves using machine learning. arXiv preprint arXiv:2106.06602. [DOI] [PMC free article] [PubMed] [Google Scholar]
Associated Data
This section collects any data citations, data availability statements, or supplementary materials included in this article.