Abstract
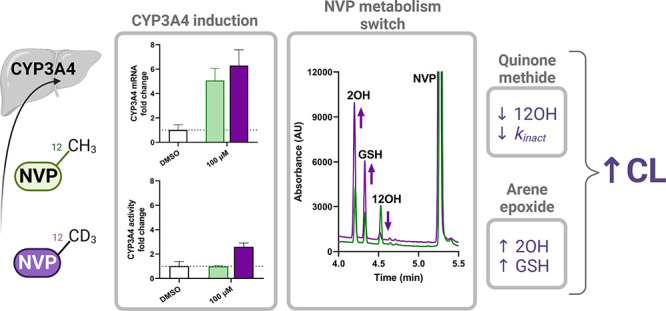
Idiosyncratic drug reactions (IDRs) in their most deleterious form can lead to serious medical complications and potentially fatal events. Nevirapine (NVP), still widely used in developing countries for combinatorial antiretroviral and prophylactic therapies against HIV infection, represents a prototypical example of IDRs causing severe skin rashes and hepatotoxicity. Complex metabolic pathways accompanied by production of multiple reactive metabolites often complicate our understanding of IDR’s origin. While assessment of NVP analogs has helped characterize the pathways involved in IDRs for NVP, which are largely driven by metabolism at the 12-methyl position, it has yet to be investigated if some of these analogs could be valuable replacement drugs with reduced reactive metabolite properties and drug–drug interaction (DDI) risks. Here, we evaluated a set of eight NVP analogs, including the deuterated 12-d3-NVP and two NVP metabolites, for their efficacy and inhibitory potencies against HIV reverse transcriptase (HIV-RT). A subset of three analogs, demonstrating >85% inhibition for HIV-RT, was further assessed for their hepatic CYP induction-driven DDI risks. This led to a closer investigation of the inactivation properties of 12-d3-NVP for hepatic CYP3A4 and a comparison of its propensity in generating reactive metabolite species. The metabolic shift triggered with 12-d3-NVP, increasing formation of the 2-hydroxy and glutathione metabolites, emphasized the importance of the dynamic balance between induction and metabolism-dependent inactivation of CYP3A4 and its impact on clearance of NVP during treatment. Unfortunately, the strategy of incorporating deuterium to reduce NVP metabolism and production of the electrophile species elicited opposite results, illustrating the great challenges involved in tackling IDRs through deuteration.
Introduction
Nevirapine (NVP), the first approved nonnucleoside reverse transcriptase inhibitor (NNRTI) targeting the human immunodeficiency virus (HIV), is still prescribed as part of the combinatorial antiretroviral therapy (cART) regimen to treat HIV-1 infection, although second-generation NNRTIs with increased safety profiles and lower propensities for viral resistance are gradually replacing it.1−4 Employed for prophylactic therapy, NVP is also used with sensitive population groups, such as pregnant people, breastfeeding mothers, or neonates, yet more frequently in developing countries where newer generation NNRTI drugs may not be as readily available due to cost constraints.5−8 Undeniably, prophylactic HIV treatment during childbirth and the neonatal period has positively impacted the prevention of its perinatal transmission worldwide. In the U.S., NVP is recommended as one of the preferred initial regimens for HIV-naive newborns of <14 days of age.9 However, NVP treatment is associated with severe adverse effects including idiosyncratic life-threatening skin reactions and liver toxicities, which prompted the U.S. Food and Drug Administration (FDA) in 2000 to issue a black box warning regarding its potential for fatal adverse events.10−13
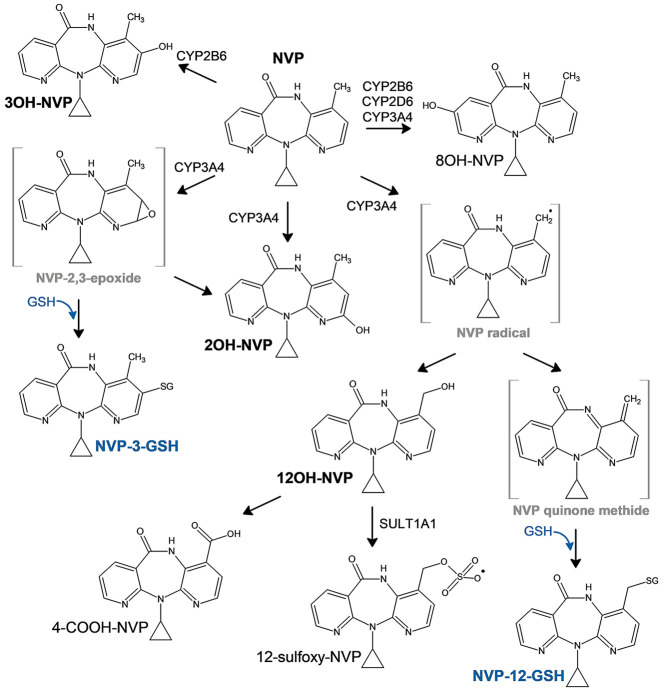
NVP skin and liver toxicities are believed to emerge primarily from metabolism at the 12-methyl position through hepatic cytochrome P450 (CYP) oxidation that can either yield to the 12-hydroxy-NVP (12OH-NVP) product or formation of a reactive quinone methide species (Figure 1).14,15 The quinone methide electrophile can then covalently adduct protein nucleophilic groups, which may lead to hepatotoxicity. The 12OH-NVP metabolite can be further oxidized to the 4-carboxy-NVP (4-COOH-NVP) or sulfated by the sulfotransferase 1A1 (SULT1A1) to the 12-sulfoxy-NVP metabolite.14,16,17 Interestingly, both the 12OH-NVP and 12-sulfoxy-NVP have been linked to the NVP-induced skin rashes usually observed a few weeks after starting NVP treatment, which frequently result in NVP therapy discontinuation.14,18,19 Indeed, the NVP phase I metabolic pathway (Figure 1) is complex involving several CYP enzymes including CYP3A4, CYP2B6, and CYP2D6 and producing four primary oxidative metabolites, the 2-, 3-, 8-, and 12-hydroxy-NVP, detected in vivo as glucuronide conjugates in human urine.16 A NVP CYP reaction phenotyping study by Erickson et al. associated the formation of the 2- (2OH-NVP) and 3-hydroxy-NVP (3OH-NVP) metabolites with CYP3A and CYP2B6 isoforms, respectively.20 From that same study, CYP2B6, CYP2D6, and CYP3A4 were linked to the 8-hydroxy-NVP (8OH-NVP), usually considered as a less significant metabolite, while the 12OH-NVP was strongly associated with the CYP3A4 isoform. Furthermore, several studies using an analog of NVP with deuterium substitution of the 12-methyl hydrogens (12-d3-NVP) in order to restrict metabolism at the 12-carbon position have shown improvement of skin rash in rodents and increased mouse hepatic cell viability, reinforcing the association between metabolism at the 12-methyl position and increased risk of adverse drug reactions.14,21 Conversely, other studies have argued for the formation of a reactive 2,3-epoxide intermediate that would instead react to form a 3-glutathione-NVP (NVP-3-GSH) product, which would then degrade to its mercapturic form.22,23 Two mercapturic derivatives have been detected in human urine from HIV-positive patients under NVP treatment and identified as the 3- and 12-conjugates based on 1D 1H and 2D nuclear magnetic resonance (NMR) structural characterization of the corresponding rat bile metabolites, with the 12-mercapturic conjugate present only at very low abundance in human urine compared to the 3-conjugate derivative.22 Although the formation of the 3-mercapturic conjugate is unarguable since it was detected in vivo, the precise metabolic pathway, in particular, the CYP isoform(s) involved in the formation of the epoxide leading to the glutathione (GSH) conjugate, is still unclear.
Figure 1.
Proposed metabolic scheme of NVP with the associated CYP-metabolizing enzymes.
While the intricate NVP metabolic pathway can lead to multiple potential reactive metabolites, enhancing the risk for adverse events, drug–drug interaction (DDI) is another aspect of NVP that needs to be accounted for. Effectively, NVP, extensively metabolized by hepatic CYP enzymes, is not only a CYP3A4 inhibitor but also a CYP inducer.13,20,24,25 CYP3A4 inactivation kinetics by NVP in human liver microsomes (HLMs) have shown time- and concentration-dependency for inactivation and were characterized by a KI of 31 μM and a kinact of 0.029 min–1.26 Inactivation of CYP3A4 is thought to be mediated by the NVP-reactive quinone methide electrophile and its direct covalent binding with cysteine 239 in the CYP3A4 F/G loop region.27 Interestingly, no hepatic CYP drug-metabolizing enzymes other than CYP3A4 have been shown to be inhibited by NVP.20 In parallel to the CYP3A4 inactivation, NVP can also induce CYP3A4 and CYP2B6 expression and actually result in increased oral clearance of the NNRTI after several weeks of treatment.13 The induction effect of NVP has been demonstrated to have pharmacokinetic (PK) interactions with saquinavir, indinavir, and methadone resulting in significant decreases of their plasma-drug area under the curve (AUC).28 According to these PK studies, including the PK characteristics observed for NVP dosing itself and the associated increase in clearance, the induction component of NVP seems to prevail over inhibition.
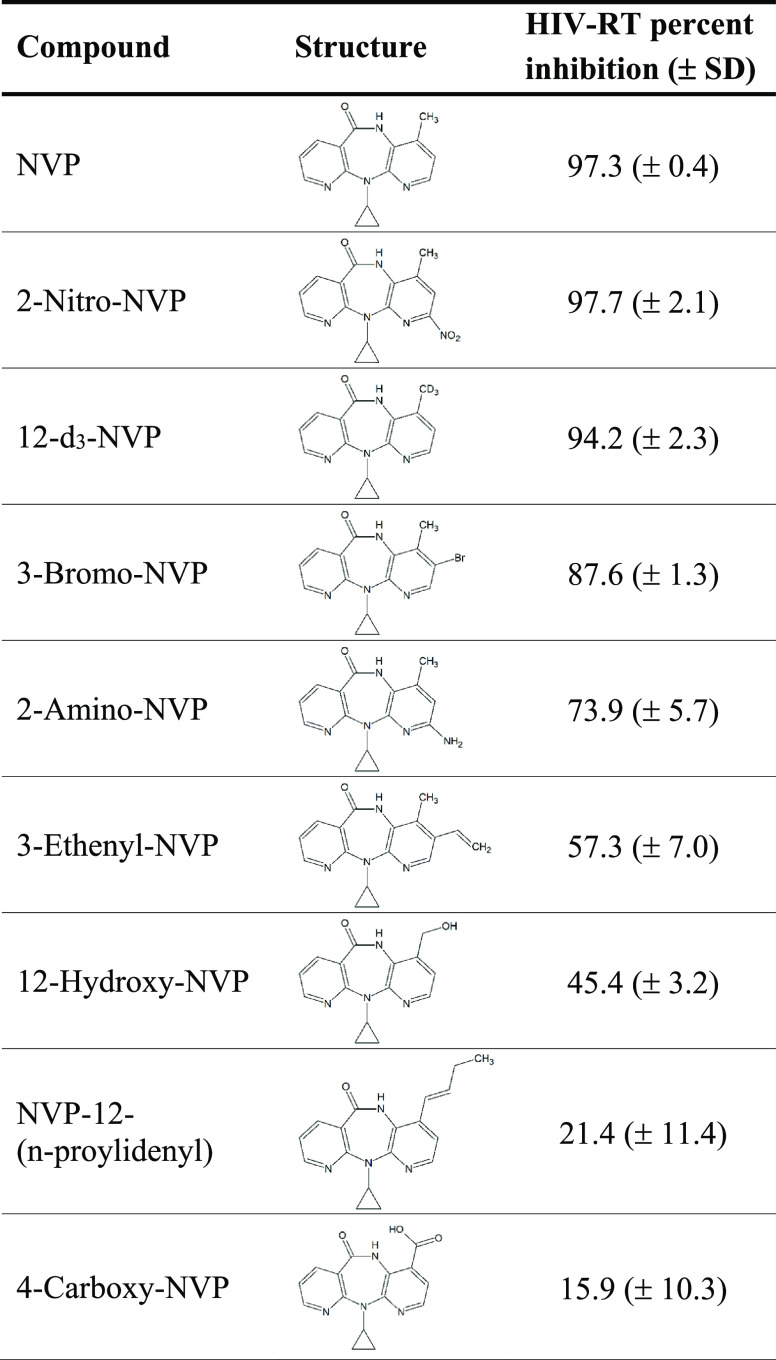
Evidence for sex differences in the NVP toxicity profile has also been reported with women presenting a 7-fold increased risk for severe rash reactions.18,29 Furthermore, the 12OH-NVP metabolite has been detected at higher proportions in women, reinforcing the association for higher toxicity risk in women.30 In consideration of these findings and the recommendations for use of NVP in some of the most vulnerable patient groups, further assessments of NVP analogs to limit reactive electrophile formation through metabolism, and thus NVP-linked toxicities, would be valuable. The use of deuteration has shown great success in limiting metabolic conversion, with the first deuterated drug, deutetrabenazine, recently receiving market approval by the FDA.31 The 12-d3-NVP has previously demonstrated enhanced safety properties with decreased skin rash in rodents and improved hepatocyte viability.14,21 Here, we evaluated a set of eight NVP analogs (Table 1) for their inhibitory potencies against the HIV reverse transcriptase (HIV-RT), which included the deuterated analog 12-d3-NVP. A subset of the NVP analogs showing the highest HIV-RT inhibition potency were further analyzed for their DDI risks by measuring the induction and inactivation propensity for the hepatic CYP3A4 enzyme.
Table 1. Inhibition Screening of NVP and NVP Analogs (10 μM) for HIV Reverse Transcriptasea.
Percent inhibition values represent the mean of three replicates ± standard deviation (SD). NVP, nevirapine; HIV-RT, HIV reverse transcriptase.
Experimental Procedures
Materials
NVP, the 2OH-NVP standard, and eight NVP analogs, 12-d3-NVP, 2-nitro-NVP, 3-bromo-NVP, 2-amino-NVP, 3-ethenyl-NVP, 4-COOH-NVP, 12OH-NVP, and NVP-12-(n-proylidenyl), were purchased from Toronto Research Chemicals (Toronto, ON). Stock solutions of test compounds were prepared in dimethyl sulfoxide (DMSO), acetonitrile (ACN), or methanol. Rifampicin (RIF), glucose-6-phosphate dehydrogenase, midazolam (MDZ), 4-hydroxy-midazolam (4OH-MDZ), and the internal standard α-hydroxymidazolam-d4 were acquired from Sigma-Aldrich (St. Louis, MO). Glucose-6-phosphate, β-nicotinamide adenine dinucleotide phosphate (NADP+), and reduced l-glutathione were obtained from Alfa Aesar (Haverhill, MA). The metabolite standard 1′-hydroxy-midazolam (1’OH-MDZ) was purchased from Cayman Chemical (Ann Arbor, MI). All other chemicals and solvents (reagent or analytical grade) were purchased from standard suppliers. CYP3A4 Supersomes (catalog number: 456202) were purchased from Corning (Corning, NY) with human cytochrome P450 reductase and cytochrome b5 coexpressed in Sf9 insect cells using a baculovirus expression system. CYP2B6 bactosomes (catalog number: CYP/EZ041) with coexpressed human cytochrome P450 reductase and supplemented with purified human cytochrome b5 were purchased from Cypex Ltd. (Dundee, Scotland., UK). Pooled mixed gender HLMs (catalog number: H2610) were obtained from XenoTech, LLC/BioIVT (Kansas City, KS).
Reverse Transcriptase Inhibition Assays
Inhibition of HIV-RT by NVP and its chemical analogs was measured using an ELISA-based colorimetric RT assay from Roche (catalog number: 11468120910) (Basel, Switzerland). The manufacturer’s protocol was followed, with the first two incubation steps combined and taking place in the precoated microplate modules. All NVP test compounds were added at 1% DMSO, except for the 12-d3-NVP added at 4% ACN. An initial screen at 10 μM was performed for each compound. Test compounds were incubated with recombinant HIV-RT and reaction mixture (containing nucleotides and template) for 1 h at 37 °C. Wells were washed, and the antibody conjugated to peroxidase was added and incubated further for 1 h at 37 °C. The wells were washed again, and the peroxidase substrate was added and incubated for 20 min at room temperature. Absorbance from the colorimetric product was measured at 405 nm on a Tecan Infinite M Plex plate reader (Männedorf, Switzerland). Percent inhibition was calculated using the corresponding solvent control as a reference for the 100% control activity. Dose–response curves for NVP, a subset of three analogs, chosen based on their inhibition performance in the screen, and 12OH-NVP were carried out following the same procedure as the screening experiments but using adjusted ranges of test compound concentrations. Percent of the remaining HIV-RT activity was calculated based on the 100% control activity from the solvent control, and values were plotted against the NVP test compound concentrations and analyzed with GraphPad Prism nonlinear regression (GraphPad Prism software, v. 9.5.1; San Diego, CA). All experiments were performed in triplicate.
Primary Human Hepatocyte Induction Assays for NVP and Its Analogs
Preplated, cryopreserved primary human hepatocytes (10 donor pool, mixed gender, seeded at 1.3 × 10⁶ cells/mL) were purchased from XenoTech, LLC/BioIVT (catalog number: HPCH10+; Kansas City, KS). Upon receipt, the medium was changed, and cells were maintained in a humidified incubator at 37 °C and 5% CO2 for 24 h. The test compounds, NVP, 12-d3-NVP, 2-nitro-NVP, and 3-bromo-NVP, were dissolved in DMSO and diluted in OptiCulture media (XenoTech, LLC/BioIVT) to the final concentrations of 25 and 100 μM (0.1% v/v final DMSO). Controls included 10 μM RIF and a DMSO solvent control. The hepatocytes were dosed with fresh media containing the test compounds or vehicle every 24 h for 3 days. Between three to six biological replicates were included for each treatment. After the 72-h treatment, the hepatocytes were incubated with 3 μM midazolam for 30 min at 37 °C and 5% CO2. Supernatant aliquots (150 μL) were then collected, and the same volume of methanol containing the internal standard α-hydroxymidazolam-d4 (10 ng/mL) was added. After centrifugation, the MDZ supernatants were analyzed by liquid chromatography tandem mass spectrometry (LC-MS/MS) for relative quantification of the metabolite 1’OH-MDZ.
The remaining hepatocytes were washed with phosphate-buffered saline (PBS) solution, and total RNA was isolated from each well with the ThermoFisher PureLink RNA Mini kit (Waltham, MA) or the Qiagen RNeasy Mini kit (Hilden, Germany). Manufacturer protocols were followed, with the inclusion of the DNase step. The end-product RNA was eluted in nuclease-free water and RNA concentrations and purity were determined based on the absorbance at 260 and 280 nm using the NanoQuant plate with the Tecan Infinite M Plex plate reader. cDNA was prepared from purified RNA (40–750 ng) using the iScript Reverse Transcriptase Supermix kit from Bio-Rad (Hercules, CA) following the manufacturer protocol. Quantitative polymerase chain reaction (qPCR) was performed in duplicate on a Bio-Rad CFX96 instrument with predesigned Taqman probes (Thermo Fisher, Waltham, MA) for CYP3A4 (Hs00430021_m1), CYP2B6 (Hs03044634_m1), and the GAPDH reference gene (Hs02786624_g1). The fold changes in mRNA levels were calculated via the ΔΔCt method. To assess cell health, the hepatocyte monolayer was examined visually daily, and lactate dehydrogenase (LDH) release was measured with the LDH-Glo cytotoxicity kit from Promega (Madison, WI). At 72 h, supernatant aliquots were taken and diluted 100-fold in LDH storage buffer (200 mM Tris-HCl pH 7.3, 10% glycerol, 1% bovine serum albumin), and an equal amount of LDH detection reagent was added and incubated for 40 min. Luminescent signal was measured with a Tecan Infinite M Plex plate reader. Normalized LDH release for all treatments was calculated compared to that of the DMSO control.
NVP and 12-d3-NVP IC50 Shift for Midazolam 1′-Hydroxylation by Recombinant CYP3A4 Enzyme
IC50 shift assays were carried out to determine the time-dependent inactivation kinetics of NVP and 12-d3-NVP for the CYP3A4 recombinant enzyme. NVP and 12-d3-NVP (2.5–450 μM) were preincubated with recombinant CYP3A4 Supersomes for 0 (with NADPH) or 30 min (with and without NADPH). Incubations (200 μL) were performed in triplicate at 37 °C with 2 pmol/mL of CYP3A4 enzyme in 100 mM potassium phosphate buffer (pH 7.4) and 3 mM MgCl2. MDZ (1 μM) was used as the probe substrate and probe reactions were initiated with the addition of MDZ, or MDZ plus NADPH for the 30 min preincubation without cofactor. The NADPH cofactor, prepared as a regenerating system mix, was added to obtain final incubation concentrations of 1 mM NADP+, 10 mM glucose-6-phosphate, and 2 IU/mL glucose-6-phosphate dehydrogenase. After 5 min, MDZ reactions were stopped by the addition of an equal volume of ice-cold methanol containing the internal standard α-hydroxymidazolam-d4 (60 ng/mL). Precipitated proteins were collected by centrifugation for 20 min at 2000 × g and 4 °C, and supernatants were analyzed by LC-MS/MS for formation of the 1’OH-MDZ metabolite. The solvent control (2% methanol, v/v) served as reference for the 100% activity.
NVP and 12-d3-NVP Inactivation Kinetics for Recombinant CYP3A4 Enzyme
NVP and 12-d3-NVP time- and concentration-dependent inhibition assays were performed for the recombinant CYP3A4 enzyme. Preincubations (300 μL) with NVP and 12-d3-NVP (5–400 μM; 2% methanol, v/v) were carried out using 20 pmol/mL CYP3A4 Supersomes in 100 mM potassium phosphate buffer (pH 7.4) and 3 mM MgCl2. Preincubation reactions were initiated by the addition of the NADPH-regenerating system mix. After 0, 6, 12, and 18 min at 37 °C, a 20-μL aliquot of the CYP3A4 preincubation was transferred to a MDZ probe reaction to yield a 200-μL incubation consisting of 10 μM MDZ, 100 mM potassium phosphate buffer (pH 7.4), 3 mM MgCl2, and the NADPH-regenerating system mix. The MDZ incubations were stopped after 4 min at 37 °C by the addition of ice-cold methanol (200 μL) containing 20 ng/mL of the α-hydroxymidazolam-d4 internal standard. Incubations without the NADPH-regenerating system mix served as negative controls. Precipitated proteins were collected by centrifugation for 20 min at 2000 × g and 4 °C and resulting supernatants were transferred to high performance liquid chromatography (HPLC) vials and aliquots of 2 μL were analyzed for relative quantification by LC-MS/MS of the 1’OH-MDZ metabolite.
Analytical Method for MDZ Hydroxylation
Formation of the 1’OH-MDZ metabolite in human hepatocytes and recombinant CYP3A4 incubations was determined by LC-MS/MS analysis with a Waters Acquity Ultra-Performance Liquid Chromatography (UPLC) system interfaced by electrospray ionization with a Waters Xevo TQ-S micro tandem quadrupole mass spectrometer (Waters Corp., Milford, MA). The following source conditions were applied: 0.5 kV for the capillary voltage, 150 °C for the source temperature, 500 °C for the desolvation temperature, and 900 L/h for the desolvation gas flow. Multiple-reaction monitoring (MRM) scan type in positive ionization mode was used to detect MDZ, 1’OH-MDZ, and the α-hydroxymidazolam-d4 internal standard. The following mass transitions (including collision energies, CE, and cone voltages, CV) were used for the respective analytes: 326 > 291 (CE = 28 V, CV = 10 V) for MDZ, 342 > 203 (CE = 28 V, CV = 15 V) for 1’OH-MDZ, and 346 > 203 (CE = 26 V, CV = 25 V) α-hydroxymidazolam-d4. The analytes were separated on a Waters BEH C18 column (1.7 μm, 2.1 mm × 50 mm) by flowing water and methanol with 0.1% formic acid at 0.5 mL/min and using the following gradient: 10% organic held for 0.5 min, increased to 98% over 2.5 min, and held at 98% for 1 min. The MS peaks were integrated using the QuanLynx software (version 4.1, Waters Corp., Milford, MA) and the analyte/internal standard peak area ratios were used for relative quantification.
IC50 Shift and Inactivation Kinetic Analysis
For the NVP and 12-d3-NVP IC50 experiments with the recombinant CYP3A4 enzyme, the mean analyte/internal standard peak area ratio for the 1’OH-MDZ metabolite was determined for the solvent control samples and was referred to as 100% control activity to calculate the percent remaining activity in samples containing increasing concentrations of NVP or its deuterated analog. GraphPad Prism software was used for the dose–response curve fitting. In addition, a fold-shift of >1.5 was indicative of a time-dependent inhibitor when comparing the IC50 values obtained after 0 and 30 min (without NADPH) preincubation or a metabolism-dependent inactivator (MDI) when comparing the IC50 values obtained after 30 min preincubation without and with NADPH.32,33 The inactivation kinetic data were analyzed using the standard replot method, although other comparable modeling methods have recently emerged for determination of the inactivation kinetic parameters.34−37 The CYP3A4 percent remaining activity was calculated for each preincubation time for the different inhibitor concentration tested and was based on the peak area ratios of 1’OH-MDZ/α-hydroxymidazolam-d4 compared to the matching solvent control peak area ratios used as the reference for the 100% activity. The observed inactivation rate constant (kobs) was estimated using linear fit of the mean natural logarithm of the remaining activity versus the preincubation time. The inactivation constants kinact and KI were determined based on the kobs versus the NVP test compound concentration in the preincubation using GraphPad Prism for curve fitting. Furthermore, the rate of covalent modification was calculated based on the inactivation constant ratio of kinact over KI, as previously described by Strelow.38
NVP and 12-d3-NVP Reactive Metabolite Glutathione Trapping Assays
Formation of the hydroxy and reactive metabolites by the recombinant CYP3A4 and CYP2B6 was assessed for NVP and its deuterated analog 12-d3-NVP by conducting glutathione trapping experiments. Both compounds (50 or 100 μM) were incubated with 100 pmol/mL recombinant CYP enzyme in 100 mM potassium phosphate buffer (pH 7.4), 3 mM MgCl2, and 1 mM reduced l-glutathione (GSH). Incubations with 1 mg/mL adult pooled HLMs were also carried out. All reactions were initiated by the addition of the NADPH-regenerating system mix. After 60 min at 37 °C, incubations were stopped by the addition of the same volume of cold methanol (alternatively, reactions were stopped by the addition of acetic acid at 2% final concentration). For experiments requiring relative quantification, an internal standard, 4OH-MDZ (1 μM), was added to the methanol stop solution. Precipitated proteins were then collected by centrifugation for 20 min at 2000 × g and 4 °C and resulting supernatants were transferred to HPLC vials for metabolite identification and relative quantification using an LC-UV-MS instrument.
Analytical Method for NVP and 12-d3-NVP Metabolites Detected in Glutathione-Trapping Reactions
The same Waters LC-MS instrumentation described above was used for metabolite identification, except for a Waters Acquity PDA detector inserted inline in front of the mass spectrometer instrument to measure absorbance from NVP, 12-d3-NVP and their derivatives. The PDA detector covered the range between 190 and 500 nm. The following MS source conditions were applied: 0.5 kV for the capillary voltage, 150 °C for the source temperature, 500 °C for the desolvation temperature, and 900 L/h for the desolvation gas flow. Multiple positive ionization mode scan types (MRM, MSMS, and full scan) were used to detect and characterize NVP, 12-d3-NVP, and their corresponding metabolites. For the MRM scan type, the following mass transitions (including CE and CV) were used for the respective analytes: 267 > 107 (CE = 26 V, CV = 25 V) for NVP, 283 > 161 (CE = 25 V, CV = 25 V) for 2OH-NVP, 283 > 242 (CE = 22 V, CV = 25 V) for 3OH-NVP, 283 > 223 (CE = 25 V, CV = 25 V) for 12OH-NVP, 572 > 443 (CE = 15 V, CV = 20 V) for NVP-GSH, 270 > 110 (CE = 26 V, CV = 25 V) for 12-d3-NVP, 286 > 161 (CE = 25 V, CV = 25 V) for 2OH-12-d3-NVP, 286 > 245 (CE = 22 V, CV = 25 V) for 3OH-12-d3-NVP, 285 > 225 (CE = 25 V, CV = 25 V) for 12OH-12-d2-NVP, 575 > 446 (CE = 15 V, CV = 20 V) for 12-d3-NVP-GSH, and 342 > 234 (CE = 20 V, CV = 10 V) for 4OH-MDZ (IS). The analytes were separated on a Waters BEH C18 column (1.7 μm, 2.1 × 100 mm) by flowing water and ACN with 0.1% formic acid at 0.4 mL/min and using the following gradient: 2% organic held for 0.5 min, increased to 30% over 5 min, then increased to 98% over 1 min, and held at 98% for 1.5 min. UV peaks detected at 280 nm were integrated using the QuanLynx software (version 4.1, Waters Corp., Milford, MA) and the analyte/internal standard peak area ratios were used for relative quantification of the NVP and 12-d3-NVP metabolites.
Results
Inhibition of HIV Reverse Transcriptase by NVP and NVP Analogs
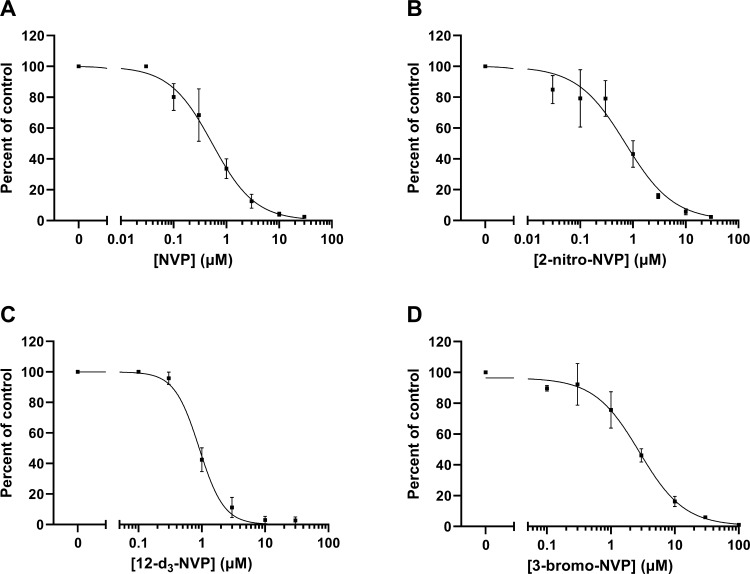
In an effort to identify NVP analogs that might retain the efficacy of the parent compound but demonstrate reduced hepatotoxicity, eight commercially available analogs were selected based on their structural similarity to the parent drug, but with electron-withdrawing substituents at various positions that might potentially limit metabolism at the 12-position. The eight NVP analogs were first assessed for their ability to inhibit HIV-RT. Percent inhibition of HIV-RT was determined for NVP and each NVP chemical derivative tested at 10 μM in the RT reactions (Table 1). NVP and 2-nitro-NVP showed the highest HIV-RT inhibition (>97%), followed by 12-d3-NVP (94.2%) and 3-bromo-NVP (87.6%). Additionally, the two human NVP metabolites included in the screening, 12OH-NVP and 4-COOH-NVP, demonstrated 45.4% and 15.9% inhibition for HIV-RT, respectively. In order to determine the inhibition potency of the NVP analogs exhibiting >85% inhibition in the screening, dose-inhibition curve experiments were conducted for NVP, 2-nitro-NVP, 12-d3-NVP, and 3-bromo-NVP (Figure 2). An IC50 value of 0.540 μM was obtained for NVP. The inhibition potencies of the 2-nitro-NVP and 12-d3-NVP were on the same order of magnitude as NVP with IC50 values of 0.721 and 0.910 μM, respectively. The IC50 value for 3-bromo-NVP was about five times higher than that of NVP at 2.78 μM. Lastly, the inhibition potency of the human 12OH-NVP metabolite was tested, and an IC50 value of 26.5 μM was determined (Supplemental Information, Figure S1), therefore indicating a weak inhibition activity against HIV-RT of the human metabolite.
Figure 2.
Dose–response curves of NVP, 2-nitro-NVP, 12-d3-NVP, and 3-bromo-NVP against HIV reverse transcriptase. HIV-RT inhibition by NVP (A), 2-nitro-NVP (B), 12-d3-NVP (C), and 3-bromo-NVP (D) was characterized by the following IC50 value ± standard error (with respective coefficient of determination, R2, in parentheses): 0.540 ± 0.055 μM (R2 = 0.972), 0.721 ± 0.111 μM (R2 = 0.937), 0.910 ± 0.042 μM (R2 = 0.989), and 2.78 ± 0.38 μM (R2 = 0.977), respectively. Each data point represents the average of triplicate measurements, with error bars representing standard deviations. NVP, nevirapine; HIV-RT, HIV reverse transcriptase.
Primary Human Hepatocyte Induction for NVP and Its Three Most Potent Analogs
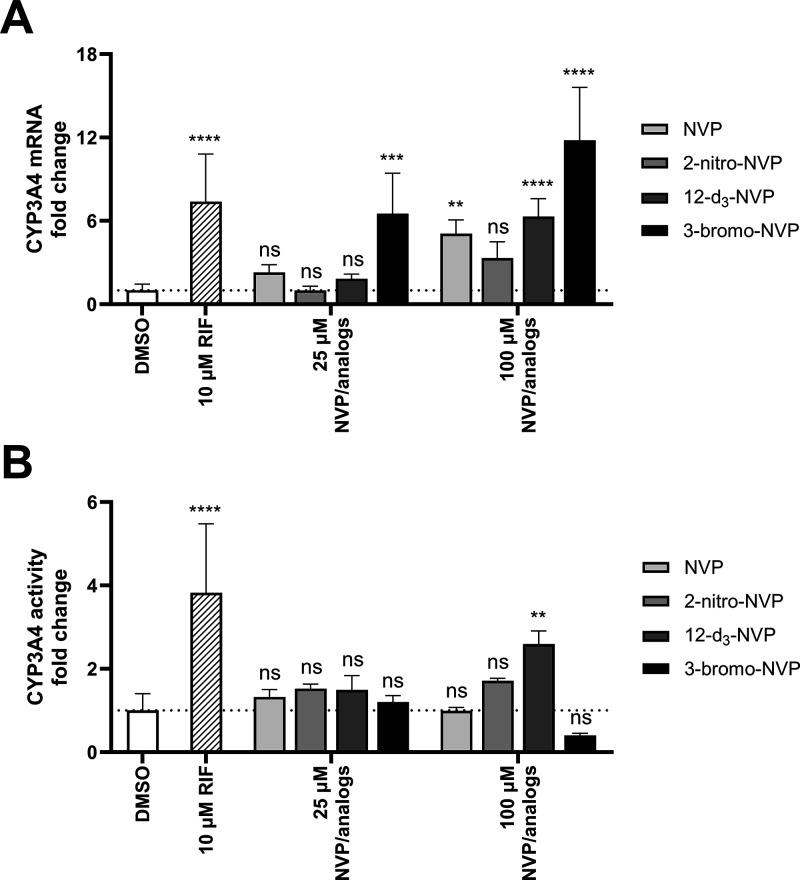
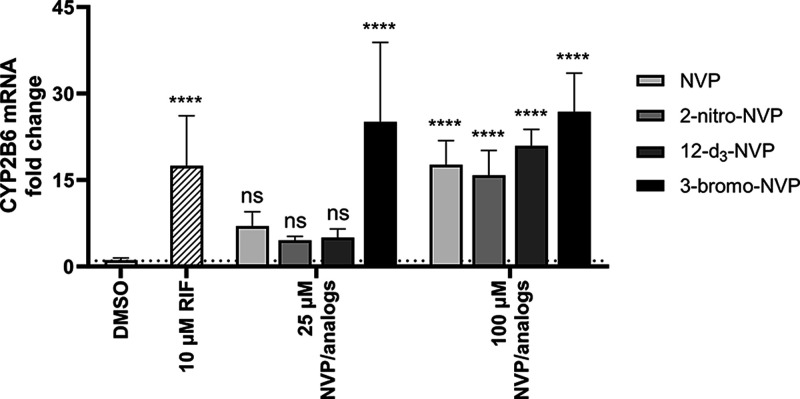
A well-known concern with NVP is its propensity to induce hepatic drug-metabolizing enzymes potentially impacting its own PK, but also that of other coadministered drugs. To assess if the NVP analogs characterized in our study (which were potent HIV-RT inhibitors) have the same property, human hepatocyte induction experiments were carried out at 25 and 100 μM concentrations of NVP or its analogs (Figures 3A and 4). In general, induction of the CYP3A4 and CYP2B6 expression was insignificant at the 25 μM concentration, except for the 3-bromo-NVP showing 6.5- and 25-fold changes for CYP3A4 and CYP2B6 mRNA levels, respectively. However, at 100 μM, all four drugs showed a significant change in CYP mRNA levels compared to the DMSO control. While NVP and 12-d3-NVP exhibited comparable mRNA fold change for CYP3A4 and CYP2B6, 3-bromo-NVP demonstrated further increase in CYP3A4 mRNA fold induction with an 11-fold change at 100 μM. The 2-nitro-NVP showed the least induction effect for CYP3A4, but a comparable induction effect to NVP with CYP2B6. Furthermore, to understand the extent of the mRNA induction on the CYP3A4 activity, MDZ 1′-hydroxylation was measured after the 72-h treatment of the primary human hepatocytes with NVP and the different analogs (Figure 3B). Interestingly, no significant change in CYP3A4 1′-hydroxylation of MDZ was detected, except for the positive control rifampicin and the 100 μM 12-d3-NVP treatment. A 2.6-fold increase in CYP3A4 1′-hydroxylation was determined for the 100 μM 12-d3-NVP treatment. While the 3-bromo-NVP showed the highest CYP3A4 mRNA-fold induction at 25 and 100 μM, no change in CYP3A4 1′-hydroxylation activity was observed in the treated primary hepatocytes. In addition, concurrently with the induction experiment, the health of the treated primary human hepatocytes was assessed by LDH release cytotoxicity assay and showed no signs of toxicity for the different treatments (Supplemental Information, Figure S2).
Figure 3.
Induction effects of NVP and its analogs on CYP3A4 gene expression and activity in primary human hepatocytes. Fold change of CYP3A4 mRNA (A) and midazolam 1′-hydroxylation activity (B) in pooled primary human hepatocytes dosed for 72 h with 25 μM and 100 μM NVP, 2-nitro-NVP, 12-d3-NVP, or 3-bromo-NVP. DMSO and rifampicin (10 μM) treatments were used for solvent control and positive control for induction, respectively. Bars represent the means of at least four biological replicates ± standard deviations. Data were analyzed by one-way ANOVA against the DMSO control. Statistical differences are shown by **, ***, and **** corresponding to the following significance levels: p < 0.01, p < 0.001, and p < 0.0001, respectively. ns, not significant; NVP, nevirapine; RIF, rifampicin.
Figure 4.
Induction effects of NVP and its analogs on CYP2B6 gene expression in primary human hepatocytes. Fold change of CYP2B6 mRNA in pooled primary human hepatocytes dosed for 72 h with 25 and 100 μM NVP, 2-nitro-NVP, 12-d3-NVP, or 3-bromo-NVP. DMSO and rifampicin (10 μM) treatments were used for solvent control and positive control for induction, respectively. Bars represent the means of at least four biological replicates ± standard deviations. Data were analyzed by one-way ANOVA against the DMSO control. Statistical difference is shown by **** corresponding to the p < 0.0001 significance. ns, not significant; NVP, nevirapine; RIF, rifampicin.
Metabolism-Dependent Inactivation of the Recombinant CYP3A4 by NVP and 12-d3-NVP
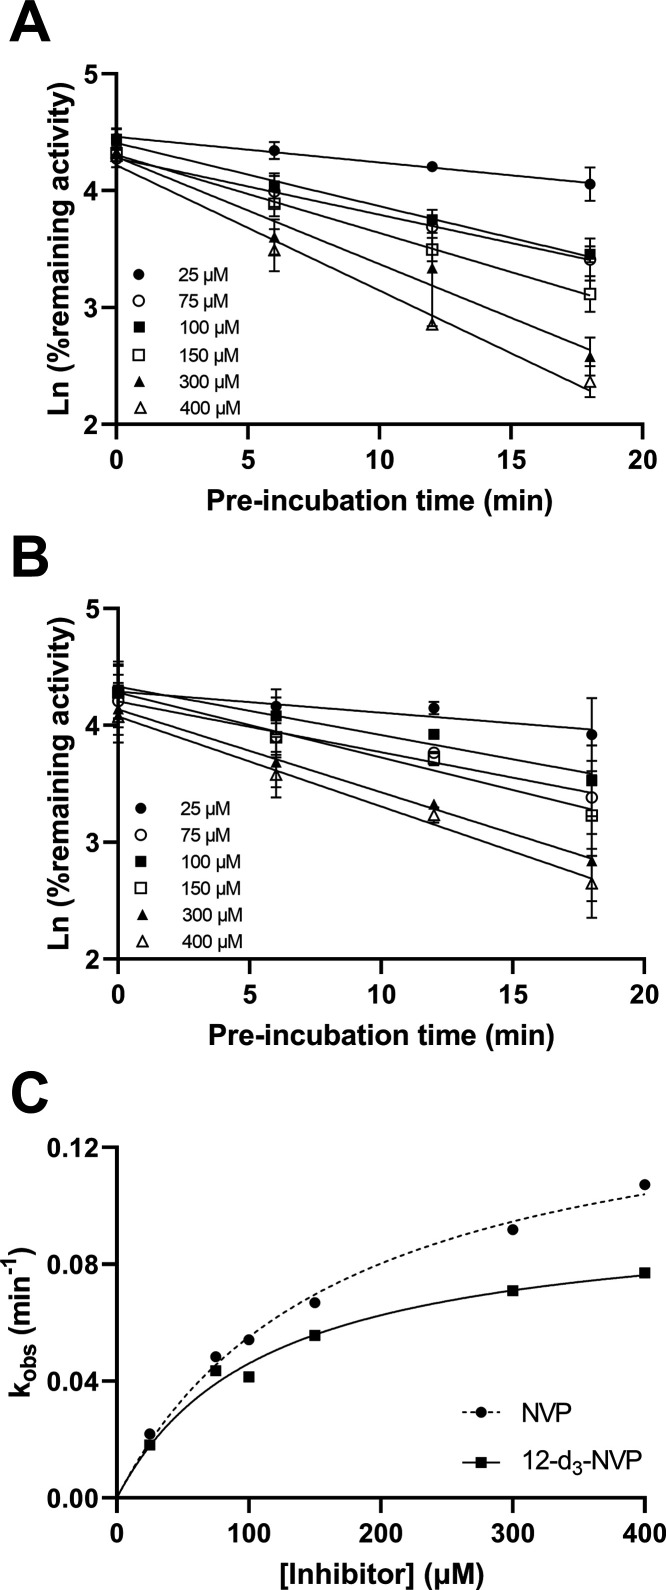
The difference between the 12-d3-NVP and NVP treatment on the hepatic CYP3A4 activity level compelled us to further characterize the inactivation properties of these two compounds for CYP3A4. First, an IC50 shift experiment was carried out to assess the time- and metabolism-dependent inhibition potency of NVP and 12-d3-NVP using the nondilution methodology (Table 2 and Figure 5). Unexpectedly, 12-d3-NVP was a stronger inhibitor of CYP3A4 than NVP with or without accounting for the preincubation. The time component of the inhibition for both NVP and 12-d3-NVP was inconsequential since the shift between the IC50 at 0 and 30 min preincubation without NADPH was less than 1.5-fold. In contrast, the IC50 shift determined for the metabolism component was significant with 5.7- and 3.3-fold shifts for NVP and 12-d3-NVP, respectively. To further refine the comparison between the metabolism-dependent inactivation of CYP3A4 by NVP and 12-d3-NVP, inactivation kinetic experiments were conducted assessing the remaining CYP3A4 MDZ 1′-hydroxylation activity with increasing preincubation time and inhibitor concentrations. Here, the dilution method was used with the standard replot approach. The decrease of activity of the recombinant CYP3A4 enzyme was preincubation time-dependent and concentration-dependent for both NVP and 12-d3-NVP (Figure 6A,B). The derived kobs values with the corresponding inhibitor concentrations allowed for the estimation of the following kinetic inactivation constants: a kinact and a KI value of 0.148 min–1 and 168 μM for NVP and 0.0977 min–1 and 112 μM for 12-d3-NVP (Table 2 and Figure 6C). Although the maximum rate of inactivation is markedly lower for 12-d3-NVP, the rate of covalent modification calculated by dividing kinact by KI was in fact equivalent between NVP and 12-d3-NVP (Table 2).
Table 2. Inhibitory Potency and Inactivation Kinetic Parameters of NVP and 12-d3-NVP for Midazolam 1′-Hydroxylation by the Recombinant CYP3A4 Enzymea.
| NVP | 12-d3-NVP | |
|---|---|---|
| IC50 shift assay | IC50 ± SE (μM) (R2) | |
| 0 min preincubation | 23.9 ± 2.0 (0.983) | 11.3 ± 1.9 (0.943) |
| 30 min preincubation (−) NADPH | 30.0 ± 2.8 (0.974) | 9.38 ± 1.57 (0.948) |
| 30 min preincubation (+) NADPH | 5.30 ± 1.01 (0.935) | 2.85 ± 0.44 (0.976) |
| IC50 shift [(−)NADPH/(+)NADPH] | 5.7 | 3.3 |
| Inactivation assay | ||
| KI ± SE (μM) | 168 ± 22 | 112 ± 18 |
| kinact ± SE (min–1) | 0.148 ± 0.009 | 0.0977 ± 0.0061 |
| R2 | 0.991 | 0.982 |
| kinact/KI (mM–1·min–1) | 0.881 | 0.872 |
NVP, nevirapine; SE, standard error.
Figure 5.
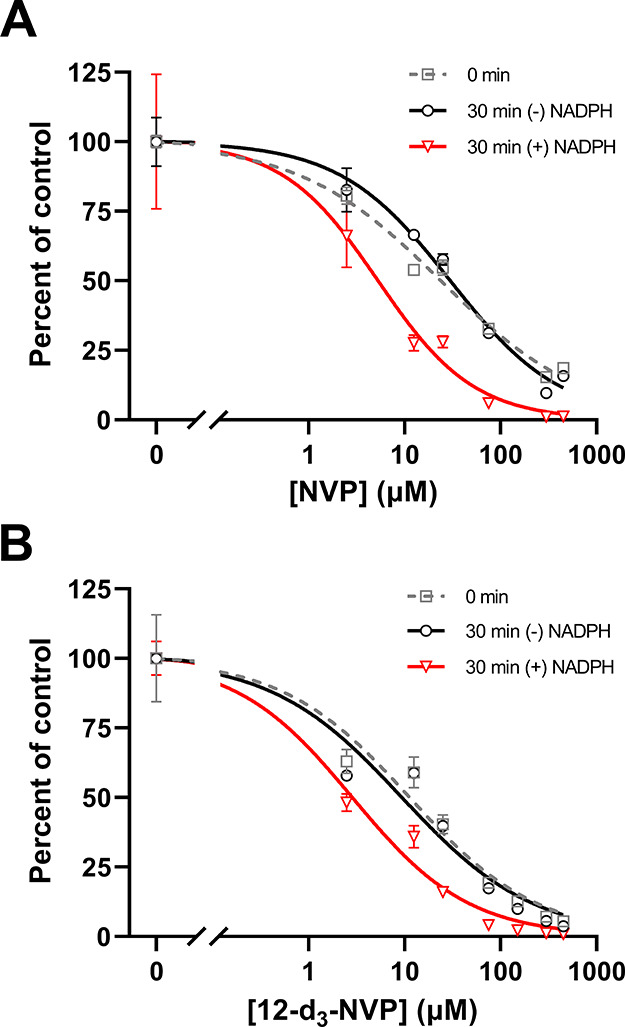
NVP and 12-d3-NVP time- and metabolism-dependent inhibition of recombinant CYP3A4. Inhibition of CYP3A4-mediated midazolam 1′-hydroxylation by NVP (A) and the 12-d3-NVP analog (B) was assessed using the IC50 shift assay with the nondilution method. Percent of control was determined for increasing drug concentrations and after 0 and 30 min preincubation with and without the NADPH cofactor. Each data point represents the average of triplicate measurements with error bars representing standard deviations. The IC50 and IC50 shift values and coefficients of determination, R2, for the regression model fit obtained for NVP and 12-d3-NVP inhibition are summarized in Table 2.
Figure 6.
Time-dependent inactivation of CYP3A4 midazolam 1′-hydroxylation by NVP and 12-d3-NVP. Pseudo-first-order kinetic plots for six concentrations of NVP (A) and 12-d3-NVP (B) were based on the percent CYP3A4 remaining activity versus the preincubation time and led to the nonlinear regression fits (C) of the inactivation rate constants (kobs) at the six inhibitor concentrations assessed. The KI and kinact values were determined to be 168 μM and 0.148 min–1 for NVP and 112 μM and 0.0977 min–1 for 12-d3-NVP, respectively.
NVP and 12-d3-NVP Reactive Metabolite Glutathione Trapping
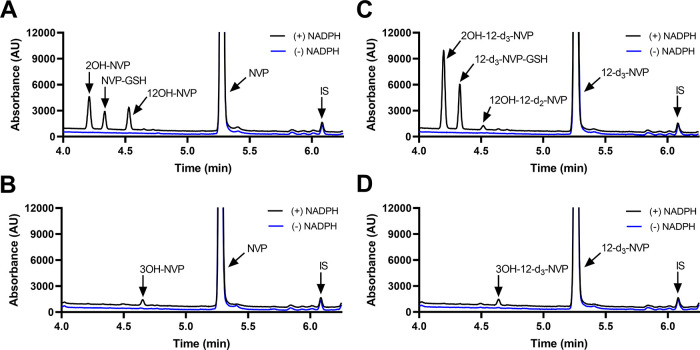
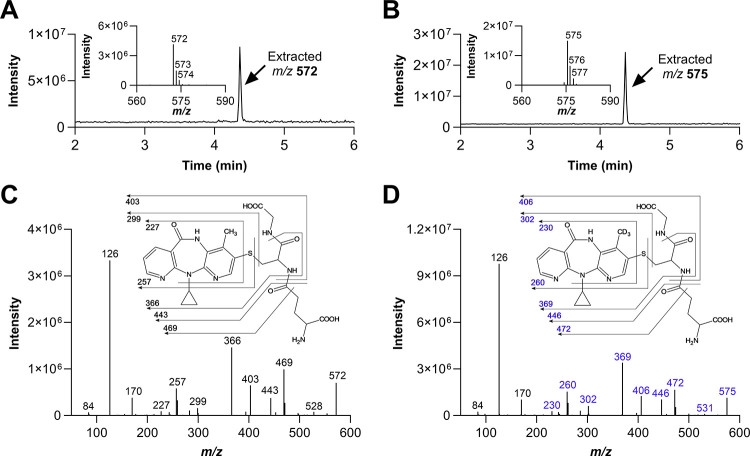
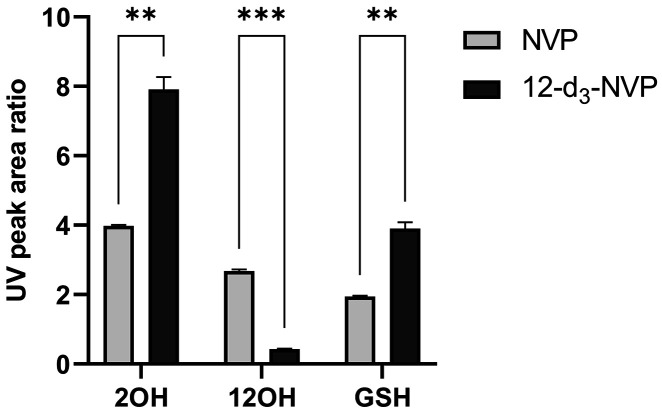
The metabolism-dependent inactivation of CYP enzymes is generally driven by formation of reactive metabolites.39 Thus, in order to understand the impact of deuteration at the 12-methyl on the formation of reactive metabolites, GSH trapping experiments were conducted with recombinant CYP3A4, CYP2B6, and HLMs. Figure 7 illustrates the UV profiles obtained for the metabolites formed with NVP and 12-d3-NVP incubated with 100 pmol/mL recombinant CYP3A4 or CYP2B6. The 2- and 12-hydroxy metabolites were detected for both NVP and 12-d3-NVP incubations with CYP3A4 and matched the corresponding authentic unlabeled standards (Supplemental Information, Figure S3). A third UV peak was detected in both NVP and 12-d3-NVP incubations at the retention time of 4.33 min. Full MS and MSMS scans allowed the identification of that metabolite as the GSH derivative of NVP and 12-d3-NVP, respectively (Figure 8). The m/z of 575 and the isotopic distribution (Figure 8B) associated with the GSH metabolite detected in the CYP3A4 incubations with the 12-d3-NVP excluded the possibility for the GSH group to be localized on the 12-carbon which would have in fact resulted in a m/z of 574 due to the loss of one isotope deuterium atom. Indeed, a comparison of the MSMS spectra of the GSH metabolites deriving from NVP (Figure 8C) and 12-d3-NVP (Figure 8D) showed a mass difference of three for several fragment ions, suggesting an intact CD3 deuterated methyl group. In the proposed fragmentation assignment associated with the GSH metabolite MSMS spectra (Figure 8C,D), the GSH adducts are represented at the carbon 3-position. While our MSMS data could not warrant this specific assignment, the positioning of the GSH was proposed based on the previous NMR work by Srivastava et al. in 2010 identifying in vivo mercapturic derivatives of NVP.22 Furthermore, in our reactive metabolite search, we carefully looked for formation of a potential NVP-12-GSH metabolite from NVP and 12-d3-NVP, but our UV and MS analyses were infructuous. Incubations of NVP and 12-d3-NVP with the recombinant CYP2B6 generated only one small UV peak at the retention time of 4.64 min (Figure 7B,D). This hydroxy metabolite was detected by MS with the MRM 283 > 242 (data not shown), mass transitions previously employed by Heck et al. in 2020 for the 3OH-NVP, hence, likely corresponding to the 3-hydroxy metabolite, the main metabolite formed by CYP2B6.21 Importantly, no GSH metabolite was detected in the recombinant CYP2B6 incubations under the conditions tested. Interestingly, the metabolite profiles of NVP and 12-d3-NVP in HLM incubations closely matched the profiles obtained with the recombinant CYP3A4 (Supplemental Information, Figure S4). With limited information about the effect of the deuteration on the ionization efficiency of NVP and its metabolites, relative quantification of the 2-hydroxy, 12-hydroxy, and GSH metabolites was undertaken for NVP and its deuterated analog using the UV absorbance signal (Figure 9). As expected, formation of the 12-hydroxy metabolite decreased considerably with the 12-d3-NVP. A 2-fold increase in the 2-hydroxy metabolite was measured with the 12-d3-NVP, signifying a metabolic shift in favor of the 2-hydroxy metabolite pathway with the 12-methyl deuteration. Most remarkably, a similar 2-fold increase in the GSH metabolite was observed with the 12-d3-NVP, interconnecting to some extent the 2-hydroxy and GSH pathways.
Figure 7.
Recombinant CYP3A4 and CYP2B6 metabolite and glutathione-trapped reactive metabolite screening for NVP and 12-d3-NVP. Representative UV chromatograms (280 nm) for NVP (A, B) and 12-d3-NVP (C, D) incubated at 50 μM for 60 min with recombinant CYP3A4 (A, C) and CYP2B6 (B, D) (100 pmol/mL) in the presence of 1 mM reduced l-glutathione and with or without the cofactor NADPH. IS, internal standard.
Figure 8.
Glutathione metabolites of NVP and 12-d3-NVP formed by recombinant CYP3A4. MS and MSMS analysis of glutathione metabolites formed in recombinant CYP3A4 incubations with NVP (A and C) and 12-d3-NVP (B and D). Extracted m/z 572 (A) and 575 (B) chromatograms from full scan MS measurements (m/z 100–1000), including the inset for isotopic distribution of the parent ion. MSMS spectra for glutathione metabolite of NVP (C) and 12-d3-NVP (D) detected in CYP3A4 incubations, including the inset with proposed fragmentation assignment.
Figure 9.
Quantitation by UV of the major NVP and 12-d3-NVP metabolites formed in the recombinant CYP3A4 glutathione-trapping reactions. The 2-hydroxy (2OH), 12-hydroxy (12OH), and GSH metabolites formed in recombinant CYP3A4 (100 pmol/mL) incubations with NVP or 12-d3-NVP (50 μM) were analyzed by LC-UV-MS and quantified based on their UV peak signals at 280 nm. Metabolite UV peak area ratios were calculated using 4-hydroxy-midazolam as the internal standard. Bars represent the mean of three replicates ± standard deviations. Statistical differences between the NVP and its deuterium-labeled analog 12-d3-NVP were analyzed by unpaired t test with Welch correction and with the following significance levels: p < 0.01 for ** and p < 0.001 for ***. GSH, glutathione; NVP, nevirapine.
Discussion
As the first NNRTI drug approved, NVP has been widely employed for the treatment of HIV infection, even though it is now strategically being replaced with safer second-generation NNRTI drugs. Nonetheless, it is still prescribed as part of combinatorial ART regimens for some of the most vulnerable patient populations, such as neonates and pregnant people. Despite its common use, NVP is associated with various severe adverse effects, including skin rashes and liver toxicities, which are driven by the oxidative metabolism of the drug. Therefore, identification of analogs limiting these adverse effects would be beneficial, especially for vulnerable patient groups. Here, we assessed eight NVP analogs (Table 1), including two human NVP metabolites, the 12OH- and 4-COOH-NVP, and a deuterated analog at the 12-position, using an HIV-RT inhibition assay. Undeniably, leveraging the prospect for active metabolite formation has been a productive trend in the pharmaceutical industry.40 While both human hydroxy metabolites showed some inhibition propensity for HIV-RT during screening, their inhibition potency was too low to be efficacious. From the HIV-RT inhibition screening, three analogs were selected: 2-nitro-NVP, 12-d3-NVP, and 3-bromo-NVP, which all demonstrated >85% HIV-RT inhibition. Unexpectedly, the 2-nitro-NVP and 12-d3-NVP showed submicromolar IC50 values comparable to NVP (Figure 2). The submicromolar inhibitory potency of the 12-d3-NVP analog further raised our interest, since this compound has demonstrated enhanced safety properties with decreased skin rash in rodents and improved mouse hepatocyte viability.14,21 The kinetic isotope effect from the deuterium atoms incorporated at the 12-position reduces the rate of oxidative metabolism by CYP3A4 due to decreased zero-point energy and, therefore, limits formation of the electrophile quinone methide species and the 12OH-NVP metabolite.21 The use of the deuterium isotope in drug design has been of increased interest for the pharmaceutical industry, in particular to limit metabolic conversion and improve dosing.41 However, it was not until 2017 that the first deuterated drug, deutetrabenazine, was approved by the FDA for the treatment of the neurological disorder chorea associated with Huntington’s disease.31 Following the approval of deutetrabenazine, several other deuterated drug derivatives are now undergoing clinical trials (e.g., ALK-001, AVP-786, VX-561).
The risk for adverse drug reactions with NVP is associated with the formation of reactive metabolites and with its capacity to induce the expression of CYP-metabolizing enzymes and to inactivate CYP3A4.28,42,43 Given this, it was essential to evaluate if the three most potent NVP analogs identified in our HIV-RT inhibition screening would demonstrate similar DDI risks to NVP. We initially evaluated the induction of CYP3A4 and CYP2B6 gene expression in primary human hepatocytes (Figures 3 and 4). Although no effect was observed for CYP3A4 and CYP2B6 gene expression at the lowest drug concentration (25 μM, a comparable concentration to the reported Cmax for NVP at steady state24), except for the 3-bromo analog, a significant increase in CYP mRNA levels was obtained for all test compounds at the 100 μM concentration. These results unfortunately suggest similar, or potentially even more potent, as in the case of the 3-bromo-NVP, induction effects for the NVP analogs. Both CYP mRNA and enzyme activity level changes are valuable end points for comprehensive understanding of the potential for CYP induction. Because changes in CYP mRNA levels do not always translate directly to changes in CYP protein level, CYP activity levels are a more valuable measure of CYP function, as they are more responsive to enzyme inhibition and/or cytotoxicity. In fact, it is well established that CYP3A4 is inactivated by NVP.20,26 Effectively, no change in CYP3A4 activity was observed for NVP, 2-nitro-NVP, and 3-bromo-NVP at the 100 μM concentration when the mRNA level increased (Figure 3). The effects observed in the primary human hepatocyte induction studies from the treatment with NVP and its analogs illustrate the complexity of the DDI phenomenon mitigated in part by the change in CYP3A4 expression and in another part by its inactivation. This results in a dynamic balancing act between increased enzyme activity through induction and decreased enzyme activity through inhibition, the extent of each being regulated by the dose of the drug. Interestingly, data from several human PK studies reporting decreased AUC for saquinavir, indinavir, and methadone when coadministrated with NVP indicate that the NVP induction component seems to outweigh the inactivation, at least in vivo.28 Yet, the most intriguing result from these induction studies was the change in CYP3A4 activity level with the 12-d3-NVP analog treatment. Even though the 12-d3-NVP showed similar changes in CYP3A4 mRNA levels to NVP, the deuterated analog triggered a 2.6-fold increase in CYP3A4 activity, suggesting alteration in the inactivation extent of the 12-d3-NVP.
To further explore the differences between NVP and 12-d3-NVP regarding the inhibition of CYP3A4, an IC50 shift experiment was carried out (Figure 5 and Table 2). In general, 12-d3-NVP demonstrated higher inhibition potency for the 1′-hydroxylation of MDZ over NVP. No time-dependent inhibition was noticed in either case; however, MDI was conspicuous with IC50 shift [(−)NADPH/(+)NADPH] of 5.7 and 3.3 for NVP and 12-d3-NVP, respectively. These results, then, triggered further characterization of the recombinant CYP3A4 inactivation kinetics for both compounds. The KI and kinact inactivation constants were determined using the dilution method with the standard replot approach (Figure 6 and Table 2). The KI was slightly decreased for 12-d3-NVP, while the maximum potential rate of inactivation was substantially lower (1.5-fold). The tighter CYP3A4 IC50 and KI inhibition values measured for the deuterated NVP may results from nuclear quantum effects of deuteration modifying the hydrogen bonding network within the CYP3A4 active site.44 The lower inactivation rate for the deuterated analog would per consequence constitute the main rationale for the increase in CYP3A4 activity measured in the human primary hepatocytes. Nevertheless, the CYP3A4 inactivation features of the 12-d3-NVP were rather unpredicted since metabolism at the 12-position should be restricted by the deuterium isotopes. Another possible explanation for the inactivation observed with 12-d3-NVP may be that a different metabolic pathway is involved in the CYP3A4 MDI.
Two mercapturic derivatives of NVP have been identified in vivo in human urine, and rodent bile and urine, the 3- and 12-mercapturic conjugates.22 The 3-mercapturic metabolite was detected at higher abundance and is thought to originate from a 2,3-epoxide reactive intermediate (Figure 1).23,45 While the CYP enzyme responsible for formation of that epoxide metabolite has not yet been characterized, CYP3A4 and CYP2B6, known to be responsible for production of the 2- and 3-hydroxy NVP metabolites, respectively, represent suitable candidates.20 Our GSH trapping with the recombinant CYP3A4 and CYP2B6 enzymes identified only one GSH metabolite formed in the recombinant incubations and pointed to CYP3A4 as the most efficient enzyme in forming that adduct (Figure 7). Comparison of the m/z and MSMS spectra of the GSH conjugates detected in NVP and 12-d3-NVP incubations supported that the GSH metabolite had an intact 12-deuterated methyl group (Figure 8), and thus, the GSH conjugate could not originate from the quinone methide intermediate. Surprisingly, no other GSH adduct, including the NVP-12-GSH, was detected in the CYP3A4 incubations with the unlabeled NVP. It is possible that under our experimental conditions using high concentration of recombinant enzyme, the electrophile quinone methide produced by CYP3A4 may instantaneously covalently adduct a residue of its active site (e.g., Cys23927), inactivating the enzyme and restricting the metabolite release into the incubation media containing excess GSH molecules. Furthermore, NVP deuteration at the 12-methyl position, while decreasing formation of the 12-hydroxy metabolite, completely shifted the metabolism toward the 2-hydroxy and GSH NVP metabolites (Figure 9). The 2-fold increase measured for these two metabolites indicated a higher CYP3A4 metabolic rate for the deuterated drug, and thus, minimal inactivation of the CYP enzyme. Effectively, dosing of the 12-d3-NVP in rodents yielded only very low levels of the deuterated analog in the animal blood; however, its concentration increased substantially when dosed with the nonspecific CYP inhibitor 1-aminobenzotriazole.14 This suggests that the combined lack of CYP3A4 inactivation by 12-d3-NVP and metabolic switching to the production of the 2-hydroxy and GSH NVP metabolites ultimately leads to increased drug clearance and, possibly, reduced drug efficacy. This may be an important consideration when undertaking a deuteration project to reduce drug toxicity, particularly for drugs that must maintain a high circulating plasma concentration to preserve efficacy such as antivirals or antineoplastics.
Together, our results indicate that reducing the hepatotoxicity risks of NVP may be challenging. First, of the three NVP analogs with the highest HIV-RT inhibition potencies, all demonstrated similar, or worse, CYP induction properties compared to NVP, thus not improving the DDI risk. Second, deuteration at the 12-position, a strategy advantageous in reducing formation of the electrophile quinone methide species and production of the 12OH-NVP, would in fact yield further increased clearance and metabolic shift toward the arene epoxide pathway that may likewise trigger idiosyncratic hepatotoxicity over time. Lastly, the quinone methide intermediate, which on the one hand is primarily responsible for the idiosyncratic skin and liver toxicities, is on the other hand positively mitigating the CYP3A4 induction effect by inactivating the enzyme. Hence, being able to improve the DDI risks and toxicity profile for NVP may be compared to the funambulist “walking on a tightrope” where induction and MDI weigh on each side of the balancing pole.
Glossary
ABBREVIATIONS
- ACN
acetonitrile
- AUC
area under the curve
- 4-COOH-NVP
4-carboxy-nevirapine
- cART
combinatorial antiretroviral therapies
- CDC
Centers for Disease Control
- CE
collision energy
- CV
cone voltage
- CYP
cytochrome P450
- DDI
drug–drug interaction
- DMSO
dimethyl sulfoxide
- FDA
Food and Drug Administration
- GSH
glutathione
- HIV
human immunodeficiency virus
- HIV-RT
HIV reverse transcriptase
- HLMs
human liver microsomes
- HPLC
high performance liquid chromatography
- 1’OH-MDZ
1′-hydroxy-midazolam
- 4OH-MDZ
4-hydroxy-midazolam
- 2OH-NVP
2-hydroxy-nevirapine
- 3OH-NVP
3-hydroxy-nevirapine
- 8OH-NVP
8-hydroxy-nevirapine
- 12OH-NVP
12-hydroxy-nevirapine
- IDRs
idiosyncratic drug reactions
- IS
internal standard
- kobs
observed inactivation rate constant
- LC-MS/MS
liquid chromatography tandem mass spectrometry
- LDH
lactate dehydrogenase
- MDI
metabolism-dependent inactivator
- MDZ
midazolam
- MRM
multiple reaction monitoring
- MS
mass spectrometry
- NADP+
β-nicotinamide adenine dinucleotide phosphate
- NADPH
β-nicotinamide adenine dinucleotide phosphate reduced
- NMR
nuclear magnetic resonance
- NNRTI(s)
non-nucleoside reverse transcriptase inhibitor(s)
- NVP
nevirapine
- NVP-3-GSH
nevirapine-3-glutathione
- PBS
phosphate-buffered saline
- PK
pharmacokinetic
- qPCR
quantitative polymerase chain reaction,
- RIF
rifampicin
- SULT
sulfotransferase
- TDI
time-dependent inhibitor
- UPLC
ultra-performance liquid chromatography
Supporting Information Available
The Supporting Information is available free of charge at https://pubs.acs.org/doi/10.1021/acs.chemrestox.3c00192.
Dose–response curve of 12-hydroxy-NVP against HIV reverse transcriptase; hepatocyte LDH cytotoxicity; representative UV and MRM chromatograms for NVP hydroxy metabolite standards; and NVP and 12-d3-NVP metabolism in HLMs (PDF)
Author Contributions
† S.E.K. and E.G.G. contributed equally to this work and are co-first authors. CRediT: Sylvie E Kandel conceptualization, data curation, formal analysis, investigation, methodology, validation, visualization, writing-original draft, writing-review & editing; Emily G Gracey data curation, formal analysis, investigation, methodology, validation, visualization, writing-original draft, writing-review & editing; Jed N Lampe conceptualization, data curation, formal analysis, funding acquisition, investigation, methodology, project administration, resources, supervision, validation, writing-review & editing.
The research reported here was supported by the National Institutes of Health, National Institute of Allergy and Infectious Diseases (NIAID) Award Number R01AI150494 (J.N.L.). The content is solely the responsibility of the authors and does not necessarily represent the official views of the National Institutes of Health.
The authors declare no competing financial interest.
Supplementary Material
References
- Nevirapine, the first of a new class of NNRTI drugs arrives in pharmacies. Crit. Path AIDS Proj. 1996, (31), , 18–−19.. [PubMed] [Google Scholar]
- Ghosn J.; Chaix M. L.; Delaugerre C. HIV-1 resistance to first- and second-generation non-nucleoside reverse transcriptase inhibitors. AIDS Rev. 2009, 11 (3), 165–173. [PubMed] [Google Scholar]
- Ripamonti D.; Bombana E.; Rizzi M. Rilpivirine: drug profile of a second-generation non-nucleoside reverse transcriptase HIV-inhibitor. Expert Rev. Anti Infect. Ther. 2014, 12 (1), 13–29. 10.1586/14787210.2014.863708. [DOI] [PubMed] [Google Scholar]
- Himmel D. M.; Arnold E. Non-Nucleoside Reverse Transcriptase Inhibitors Join Forces with Integrase Inhibitors to Combat HIV. Pharmaceuticals 2020, 13 (6), 122. 10.3390/ph13060122. [DOI] [PMC free article] [PubMed] [Google Scholar]
- Nevirapine use to reduce mother-to-child transmission of HIV in Canada. Paediatr. Child Health 2001, 6 (3), 121–122. 10.1093/pch/6.3.121. [DOI] [PMC free article] [PubMed] [Google Scholar]
- Mofenson L. M. Prevention in neglected subpopulations: prevention of mother-to-child transmission of HIV infection. Clin. Infect. Dis. 2010, 50 (Suppl 3), S130–S148. 10.1086/651484. [DOI] [PubMed] [Google Scholar]
- Drugs and Lactation Database (LactMed®). Nevirapine. Bethesda (MD): National Institute of Child Health and Human Development, https://www.ncbi.nlm.nih.gov/pubmed/30000595 (accessed June 2023).
- Cressey T. R.; Punyawudho B.; Le Coeur S.; Jourdain G.; Saenjum C.; Capparelli E. V.; Jittayanun K.; Phanomcheong S.; Luvira A.; Borkird T.; et al. Assessment of Nevirapine Prophylactic and Therapeutic Dosing Regimens for Neonates. J. Acquir. Immune Defic. Syndr. 2017, 75 (5), 554–560. 10.1097/QAI.0000000000001447. [DOI] [PMC free article] [PubMed] [Google Scholar]
- What to start: regimens recommended for initial therapy of antiretroviral-naive children. Clinicalinfo.HIV.gov, https://clinicalinfo.hiv.gov/en/guidelines/pediatric-arv/regimens-recommended-initial-therapy-antiretroviral-naive-children#:%7E:text=For%20treatment-naive%20children%2C%20the%20Panel%20on%20Antiretroviral%20Therapy,transcriptase%20inhibitor%2C%20or%20a%20boosted%20protease%20inhibitor%20%28AI%2A%29 (accessed June 2023).
- Warren K. J.; Boxwell D. E.; Kim N. Y.; Drolet B. A. Nevirapine-associated Stevens-Johnson syndrome. Lancet 1998, 351 (9102), 567. 10.1016/S0140-6736(98)24008-6. [DOI] [PubMed] [Google Scholar]
- Popovic M.; Shenton J. M.; Chen J.; Baban A.; Tharmanathan T.; Mannargudi B.; Abdulla D.; Uetrecht J. P. Nevirapine hypersensitivity. Handb. Exp. Pharmacol. 2010, 196, 437–451. 10.1007/978-3-642-00663-0_15. [DOI] [PubMed] [Google Scholar]
- LiverTox: Clinical and Research Information on Drug-Induced Liver Injury [Internet]. Nevirapine. National Institute of Diabetes and Digestive and Kidney Diseases: Bethesda, MD. https://www.ncbi.nlm.nih.gov/books/NBK548895/ (accessed June 2023).
- Viramune (nevirapine) package insert (revision November 2011). https://www.accessdata.fda.gov/drugsatfda_docs/label/2011/020636s039_020933s030lbl.pdf (accessed June 2023).
- Chen J.; Mannargudi B. M.; Xu L.; Uetrecht J. Demonstration of the metabolic pathway responsible for nevirapine-induced skin rash. Chem. Res. Toxicol. 2008, 21 (9), 1862–1870. 10.1021/tx800177k. [DOI] [PubMed] [Google Scholar]
- Sharma A. M.; Li Y.; Novalen M.; Hayes M. A.; Uetrecht J. Bioactivation of nevirapine to a reactive quinone methide: implications for liver injury. Chem. Res. Toxicol. 2012, 25 (8), 1708–1719. 10.1021/tx300172s. [DOI] [PMC free article] [PubMed] [Google Scholar]
- Riska P.; Lamson M.; MacGregor T.; Sabo J.; Hattox S.; Pav J.; Keirns J. Disposition and biotransformation of the antiretroviral drug nevirapine in humans. Drug Metab. Dispos. 1999, 27 (8), 895–901. [PubMed] [Google Scholar]
- Sharma A. M.; Novalen M.; Tanino T.; Uetrecht J. P. 12-OH-nevirapine sulfate, formed in the skin, is responsible for nevirapine-induced skin rash. Chem. Res. Toxicol. 2013, 26 (5), 817–827. 10.1021/tx400098z. [DOI] [PubMed] [Google Scholar]
- Bersoff-Matcha S. J.; Miller W. C.; Aberg J. A.; van Der Horst C.; Hamrick H. J. Jr.; Powderly W. G.; Mundy L. M. Sex differences in nevirapine rash. Clin. Infect. Dis. 2001, 32 (1), 124–129. 10.1086/317536. [DOI] [PubMed] [Google Scholar]
- Sarfo F. S.; Sarfo M. A.; Norman B.; Phillips R.; Chadwick D. Incidence and determinants of nevirapine and efavirenz-related skin rashes in West Africans: nevirapine’s epitaph?. PLoS One 2014, 9 (4), e94854 10.1371/journal.pone.0094854. [DOI] [PMC free article] [PubMed] [Google Scholar]
- Erickson D. A.; Mather G.; Trager W. F.; Levy R. H.; Keirns J. J. Characterization of the in vitro biotransformation of the HIV-1 reverse transcriptase inhibitor nevirapine by human hepatic cytochromes P-450. Drug Metab. Dispos. 1999, 27 (12), 1488–1495. [PubMed] [Google Scholar]
- Heck C. J. S.; Seneviratne H. K.; Bumpus N. N. Twelfth-Position Deuteration of Nevirapine Reduces 12-Hydroxy-Nevirapine Formation and Nevirapine-Induced Hepatocyte Death. J. Med. Chem. 2020, 63 (12), 6561–6574. 10.1021/acs.jmedchem.9b01990. [DOI] [PMC free article] [PubMed] [Google Scholar]
- Srivastava A.; Lian L. Y.; Maggs J. L.; Chaponda M.; Pirmohamed M.; Williams D. P.; Park B. K. Quantifying the metabolic activation of nevirapine in patients by integrated applications of NMR and mass spectrometries. Drug Metab. Dispos. 2010, 38 (1), 122–132. 10.1124/dmd.109.028688. [DOI] [PMC free article] [PubMed] [Google Scholar]
- Tateishi Y.; Ohe T.; Yasuda D.; Takahashi K.; Nakamura S.; Kazuki Y.; Mashino T. Synthesis and evaluation of nevirapine analogs to study the metabolic activation of nevirapine. Drug Metab. Pharmacokinet. 2020, 35 (2), 238–243. 10.1016/j.dmpk.2020.01.006. [DOI] [PubMed] [Google Scholar]
- Fan-Havard P.; Liu Z.; Chou M.; Ling Y.; Barrail-Tran A.; Haas D. W.; Taburet A. M.; Group A. S. Pharmacokinetics of phase I nevirapine metabolites following a single dose and at steady state. Antimicrob. Agents Chemother. 2013, 57 (5), 2154–2160. 10.1128/AAC.02294-12. [DOI] [PMC free article] [PubMed] [Google Scholar]
- von Moltke L. L.; Greenblatt D. J.; Granda B. W.; Giancarlo G. M.; Duan S. X.; Daily J. P.; Harmatz J. S.; Shader R. I. Inhibition of human cytochrome P450 isoforms by nonnucleoside reverse transcriptase inhibitors. J. Clin. Pharmacol. 2001, 41 (1), 85–91. 10.1177/00912700122009728. [DOI] [PubMed] [Google Scholar]
- Wen B.; Chen Y.; Fitch W. L. Metabolic activation of nevirapine in human liver microsomes: dehydrogenation and inactivation of cytochrome P450 3A4. Drug Metab. Dispos. 2009, 37 (7), 1557–1562. 10.1124/dmd.108.024851. [DOI] [PubMed] [Google Scholar]
- Baer B. R.; Wienkers L. C.; Rock D. A. Time-dependent inactivation of P450 3A4 by raloxifene: identification of Cys239 as the site of apoprotein alkylation. Chem. Res. Toxicol. 2007, 20 (6), 954–964. 10.1021/tx700037e. [DOI] [PubMed] [Google Scholar]
- Back D.; Gibbons S.; Khoo S. Pharmacokinetic drug interactions with nevirapine. J. Acquir. Immune Defic. Syndr. 2003, 34 (Suppl 1), S8–S14. 10.1097/00126334-200309011-00003. [DOI] [PubMed] [Google Scholar]
- Antinori A.; Baldini F.; Girardi E.; Cingolani A.; Zaccarelli M.; Di Giambenedetto S.; Barracchini A.; De Longis P.; Murri R.; Tozzi V.; et al. Female sex and the use of anti-allergic agents increase the risk of developing cutaneous rash associated with nevirapine therapy. AIDS 2001, 15 (12), 1579–1581. 10.1097/00002030-200108170-00018. [DOI] [PubMed] [Google Scholar]
- Marinho A. T.; Rodrigues P. M.; Caixas U.; Antunes A. M.; Branco T.; Harjivan S. G.; Marques M. M.; Monteiro E. C.; Pereira S. A. Differences in nevirapine biotransformation as a factor for its sex-dependent dimorphic profile of adverse drug reactions. J. Antimicrob. Chemother. 2014, 69 (2), 476–482. 10.1093/jac/dkt359. [DOI] [PubMed] [Google Scholar]
- DeWitt S. H.; Maryanoff B. E. Deuterated Drug Molecules: Focus on FDA-Approved Deutetrabenazine(Published as part of the Biochemistry series ″Biochemistry to Bedside″). Biochemistry 2018, 57 (5), 472–473. 10.1021/acs.biochem.7b00765. [DOI] [PubMed] [Google Scholar]
- Berry L. M.; Zhao Z. An examination of IC50 and IC50-shift experiments in assessing time-dependent inhibition of CYP3A4, CYP2D6 and CYP2C9 in human liver microsomes. Drug Metab. Lett. 2008, 2 (1), 51–59. 10.2174/187231208783478407. [DOI] [PubMed] [Google Scholar]
- Parkinson A.; Kazmi F.; Buckley D. B.; Yerino P.; Paris B. L.; Holsapple J.; Toren P.; Otradovec S. M.; Ogilvie B. W. An evaluation of the dilution method for identifying metabolism-dependent inhibitors of cytochrome P450 enzymes. Drug Metab. Dispos. 2011, 39 (8), 1370–1387. 10.1124/dmd.111.038596. [DOI] [PubMed] [Google Scholar]
- Ernest C. S. 2nd; Hall S. D.; Jones D. R. Mechanism-based inactivation of CYP3A by HIV protease inhibitors. J. Pharmacol. Exp. Ther. 2005, 312 (2), 583–591. 10.1124/jpet.104.075416. [DOI] [PubMed] [Google Scholar]
- Burt H. J.; Pertinez H.; Sall C.; Collins C.; Hyland R.; Houston J. B.; Galetin A. Progress curve mechanistic modeling approach for assessing time-dependent inhibition of CYP3A4. Drug Metab. Dispos. 2012, 40 (9), 1658–1667. 10.1124/dmd.112.046078. [DOI] [PubMed] [Google Scholar]
- Nagar S.; Jones J. P.; Korzekwa K. A numerical method for analysis of in vitro time-dependent inhibition data. Part 1. Theoretical considerations. Drug Metab. Dispos. 2014, 42 (9), 1575–1586. 10.1124/dmd.114.058289. [DOI] [PMC free article] [PubMed] [Google Scholar]
- Korzekwa K.; Tweedie D.; Argikar U. A.; Whitcher-Johnstone A.; Bell L.; Bickford S.; Nagar S. A numerical method for analysis of in vitro time-dependent inhibition data. Part 2. Application to experimental data. Drug Metab. Dispos. 2014, 42 (9), 1587–1595. 10.1124/dmd.114.058297. [DOI] [PMC free article] [PubMed] [Google Scholar]
- Strelow J. M. A Perspective on the Kinetics of Covalent and Irreversible Inhibition. SLAS Discovery 2017, 22 (1), 3–20. 10.1177/1087057116671509. [DOI] [PubMed] [Google Scholar]
- Lee K. S.; Kim S. K. Direct and metabolism-dependent cytochrome P450 inhibition assays for evaluating drug-drug interactions. J. Appl. Toxicol. 2013, 33 (2), 100–108. 10.1002/jat.1720. [DOI] [PubMed] [Google Scholar]
- Obach R. S. Pharmacologically active drug metabolites: impact on drug discovery and pharmacotherapy. Pharmacol. Rev. 2013, 65 (2), 578–640. 10.1124/pr.111.005439. [DOI] [PubMed] [Google Scholar]
- Di Martino R. M. C.; Maxwell B. D.; Pirali T. Deuterium in drug discovery: progress, opportunities and challenges. Nat. Rev. Drug Discovery 2023, 22 (7), 562–584. 10.1038/s41573-023-00703-8. [DOI] [PMC free article] [PubMed] [Google Scholar]
- Serious adverse events attributed to nevirapine regimens for postexposure prophylaxis after HIV exposures--worldwide, 1997–2000. MMWR Morb. Mortal. Wkly Rep. 2001, 49 (51–52), 1153–1156. [PubMed] [Google Scholar]
- Marinho A. T.; Miranda J. P.; Caixas U.; Charneira C.; Goncalves-Dias C.; Marques M. M.; Monteiro E. C.; Antunes A. M. M.; Pereira S. A. Singularities of nevirapine metabolism: from sex-dependent differences to idiosyncratic toxicity. Drug Metab. Rev. 2019, 51 (1), 76–90. 10.1080/03602532.2019.1577891. [DOI] [PubMed] [Google Scholar]
- Krzan M.; Vianello R.; Marsavelski A.; Repic M.; Zaksek M.; Kotnik K.; Fijan E.; Mavri J. The Quantum Nature of Drug-Receptor Interactions: Deuteration Changes Binding Affinities for Histamine Receptor Ligands. PLoS One 2016, 11 (5), e0154002 10.1371/journal.pone.0154002. [DOI] [PMC free article] [PubMed] [Google Scholar]
- Dekker S. J.; Zhang Y.; Vos J. C.; Vermeulen N. P.; Commandeur J. N. Different Reactive Metabolites of Nevirapine Require Distinct Glutathione S-Transferase Isoforms for Bioinactivation. Chem. Res. Toxicol. 2016, 29 (12), 2136–2144. 10.1021/acs.chemrestox.6b00250. [DOI] [PubMed] [Google Scholar]
Associated Data
This section collects any data citations, data availability statements, or supplementary materials included in this article.


