

Abstract
Developing models for individualized, time-varying treatment optimization from observational data with large variable spaces, e.g., electronic health records (EHR), is problematic because of inherent, complex bias that can change over time. Traditional methods such as the g-formula are robust, but must identify critical subsets of variables due to combinatorial issues. Machine learning approaches such as causal survival forests have fewer constraints and can provide fine-tuned, individualized counterfactual predictions. In this study, we aimed to optimize time-varying antibiotic treatment –identifying treatment heterogeneity and conditional treatment effects– against invasive methicillin-resistant Staphylococcus Aureus (MRSA) infections, using statewide EHR data collected in Florida, USA. While many previous studies focused on measuring the effects of the first empiric treatment (i.e., usually vancomycin), our study focuses on dynamic sequential treatment changes, comparing possible vancomycin switches with other antibiotics at clinically relevant time points, e.g., after obtaining a bacterial culture and susceptibility testing. Our study population included adult individuals admitted to the hospital with invasive MRSA. We collected demographic, clinical, medication, and laboratory information from the EHR for these patients. Then, we followed three sequential antibiotic choices (i.e., their empiric treatment, subsequent directed treatment, and final sustaining treatment), evaluating 30-day mortality as the outcome. We applied both causal survival forests and g-formula using different clinical intervention policies. We found that switching from vancomycin to another antibiotic improved survival probability, yet there was a benefit from initiating vancomycin compared to not using it at any time point. These findings show consistency with the empiric choice of vancomycin before confirmation of MRSA and shed light on how to manage switches on course. In conclusion, this application of causal machine learning on EHR demonstrates utility in modeling dynamic, heterogeneous treatment effects that cannot be evaluated precisely using randomized clinical trials.
Keywords: Individualized Treatment Effect, Causal Machine Learning, Causal Survival Forest, G-Formula, Dynamic Treatment Optimization, Antibiotic Resistance
1. Introduction
Antimicrobial resistance (AMR) is a global public health threat. Every year, there are over 2.8 million antimicrobial-resistant infections in the United States, and at least 35,000 people die from these infections (Centers for Disease Control and Prevention, 2019). Identifying optimal antibiotic treatment regimens is key to increasing the chance of favorable clinical outcomes for individuals, and it can also have a role in preventing AMR at the population level. The World Health Organization (WHO) and the US Centers for Disease Control and Prevention (CDC) consider methicillin-resistant Staphylococcus aureus (MRSA) infection to be a bacterial disease of priority concern, because MRSA can affect multiple tissues and organs, and its treatment options are few, due to the fact that it is resistant to nearly all beta-lactam antibiotics (Centers for Disease Control and Prevention, 2019; World Health Organization, 2017; Lee et al., 2018; Turner et al., 2019; Rodvold and McConeghy, 2014; Alexander et al., 2023).
Invasive MRSA is a life-threatening complication in which the infection has spread inside the body, e.g., the bloodstream, deep-seated skin, or lungs (Lee et al., 2018). With invasive infections, patients often need emergent antibiotic treatment before the pathogen causing the infection is known. This initial treatment is called ‘empiric treatment’. Clinicians use symptoms and source of infection to select empiric treatment according to experience and international guidelines (VanEperen and Segreti, 2016). Once the pathogen is identified by test results, clinicians can prescribe the first directed treatment. Currently, a bacterial identification culture test takes 2 – 3 days. Because of this time delay from testing, in clinical practice, several sequential treatment scenarios are possible for each patient (Jeffres, 2017; Leekha et al., 2011).
Vancomycin is known as the first-line treatment for patients with a suspected MRSA infection (VanEperen and Segreti, 2016; Levine, 2006). Even though vancomycin has broad coverage, there can be multiple reasons to change vancomycin dose or switch to other antibiotics, including a lack of clinical improvement, updated information regarding antibiotic susceptibility, development of adverse effects, and even financial reasons (Jeffres, 2017). Nephrotoxicity is one of the main adverse events that patients experience while receiving vancomycin. When a patient experiences renal toxicity, doctors prescribe alternative antibiotics (Liu et al., 2020; Sawada et al., 2018; Filippone et al., 2017).
Although a randomized clinical trial (RCT) can be ideal approach for comparing first directed treatment for known drug susceptibility, this approach is cumbersome for dynamic, i.e., time-varying, antibiotic treatments especially in the context of delayed pathogen culture and antibiotic susceptibility testing. It is even more challenging to conduct a RCT with MRSA. MRSA must be treated immediately under multifaceted conditions. Estimating dynamic, heterogenous treatment effects among different patient groups is difficult to establish using a RCT, requiring a complex design and larger sample. However, observational data could be leveraged to calculate dynamic individualized treatment effects since numerous treatment scenarios are possible and observed in practice.
Previous studies of MRSA patients have compared vancomycin to other antibiotics, including daptomycin and linezolid (Schweizer et al., 2021; Yue et al., 2016; McCreary et al., 2020; Yeager et al., 2021; Paul et al., 2015; Liang et al., 2014). In a retrospective study of veterans with MRSA bloodstream infections, patients who were switched from vancomycin to daptomycin during the first three days after starting treatment had a lower risk of 30-day mortality than patients who did not switch from vancomycin (Schweizer et al., 2021). When compared to vancomycin, linezolid has shown promise for treating patients with skin and soft tissue infections (Yue et al., 2016) and ventilator-associated pneumonia (Peyrani and Ramirez, 2015).
Overall, there is a lack of studies that looked specifically at dynamic sequential treatment effects. To our knowledge, none applied methods for heterogeneous effect estimation. In this work, we analyzed longitudinal electronic health record (EHR) data from a large, statewide hospital settings, together with causal survival forest and g-formula, to estimate both average effects and heterogeneity of conditional effects for dynamic antibiotic therapy –vancomycin vs. others– on mortality in patients admitted with invasive MRSA infection.
2. Methods
First, we describe our ethical approvals, the data source, the study population, the longitudinal design, and the sequential treatment strategies, outcome, and covariates. Second, we give an overview of the causal survival forest and the g-formula methods, which we used to estimate dynamic treatment effects.
2.1. Ethics Statement, Data Source, and Derivation of Study Population
As authors, we abide to the ethical principles for medical research involving human subjects outlined by the World Medical Association in the Declaration of Helsinki. This study was reviewed and approved by the University of Florida’s (UF) institutional review board (IRB) (protocol number IRB 201900652). We used deidentified data from a large university hospital system in Florida, UF Health, that comprises two primary hospitals in Gainesville and Jacksonville, as well as forty-five outpatient clinics in the state. Since 2011, UF Health uses the Epic system (https://www.epic.com/), and the EHR data is warehoused in the Integrated Data Repository (IDR, https://idr.ufhealth.org/). The IDR includes patients’ demographics, clinical diagnoses, procedures, laboratory tests, and medications. Clinical diagnoses and procedures are encoded using the International Classification of Disease (ICD, https://www.who.int/standards/classifications/classification-of-diseases) ontology, 9th and 10the revision, while laboratory tests and medications are encoded via the Logical Observation Identifiers Names and Codes (LOINC, https://loinc.org/) and the RxNorm (https://www.nlm.nih.gov/research/umls/rxnorm/index.html) terminology, respectively. Data requests made to the IDR staff (https://idr.ufhealth.org/research-services/) should be in compliance with institutional, state and Federal regulations. The authors of this work are willing to share the study protocol and data analysis code.
Our study population includes adults (18 years and older) admitted to the hospital and diagnosed with invasive MRSA (the first one recorded). An MRSA diagnosis was confirmed with a culture test based on a biological sample, including blood, fluid, bone, kidney, liver, heart, lung, pancreas, etc. Individuals who had at least one-year of medical records before the identification of MRSA were included in this study to account for relevant medical history. Patients were followed during three sequential time points: (1) empiric treatment, (2) possible switch to the first directed treatment, and (3) the sustaining therapy with other switching options. The flowchart of the inclusion criteria for the study population is given in Figure 1.
Figure 1:

Flowchart of inclusion criteria to derive the study population
2.2. Three Timepoints for Constructing Sequential Strategies
Selecting appropriate timepoints is crucial not only for assessing the sequential treatment effects, but also for identifying when treatment changes can be acted upon. We focused on the sequence of (1) empiric, (2) empiric to directed, and (3) sustaining treatment assignments as illustrated in Figure 2. “Time 1” refers to the interval period from admission to the receipt of culture test results. For example, if a patient received vancomycin during this interval, we labeled the patients into vancomycin group at Time 1. During this time, the definitive organism and antibiotic susceptibility test results are not known. We collected the relevant measurement proxies from the EHR to ascertain the treatment propensity, as well as potential causes of early/late adverse reactions that can entail contraindications. “Time 2” is a measure of the preliminary response to the empiric antibiotic therapy, also known as early response assessment. Since the initial response period is typically assessed within 3 – 7 days, we fixed it at 3 days after the culture test. With these results, providers may continue with their empiric treatment prescription (perhaps with dose adjustment) or switch to the directed treatment. Various clinical factors, such as nephrotoxicity, may affect this transition. “Time 3” involves monitoring the antibiotic treatment and sustaining therapy for the recommended time. For MRSA, this is typically between 7 and 14 days after the initiation of therapy (or even longer) depending on the severity and location of the infection. During this time period, the overall effectiveness of the therapy, any remaining signs of infection, and the potential for recurrence or complications is assessed. In our study, we define this third time point as the 7 days from the first directed treatment (i.e., “Time 2” + 7 days, or “Time 1” + 10 days).
Figure 2:

Description of treatment timeline and three timepoints
Note: T1 is an interval period from the start of admission to the culture test result confirmed, T2 is the 1st day of the directed treatment, and T3 is the 8th day of directed treatment
At each of the three timepoints, we assessed if the patient was taking vancomycin or they were prescribed another. In total, 8 different sequential treatment strategies were considered. For example, if a patient started with vancomycin as empiric treatment and maintained the same treatment at timepoint 2, but then changed to another antibiotic at timepoint 3, the patient would have ‘1-1-0’ as the value for the sequential treatment strategy variable.
2.3. Study Intervention, Outcome, and Covariates
We defined two different interventions that could be applied in clinical practice: one was a three-point treatment sequence (modelled using a causal survival forest) and the other was a treatment update at a given time point (modelled through g-formula). For the first intervention, we encoded a binary treatment variable to indicate whether there was an antibiotic change between the previous time point to next time point (i.e., treatment change from Time 1 to Time 2 or treatment change from Time 2 to Time 3, and any change between the first and another time point, i.e., from Time 1 to Time 2/Time 3). For the second intervention, vancomycin was the target treatment, and any other antibiotic was pooled into the control group, corresponding to the 8 sequential treatments. The study outcome was the time from the onset of bacterial infection (i.e., culture collection date set as the index date) to death or discharge within a 30-day horizon (i.e., 30-day mortality). Study covariates were both time-fixed for the first intervention and time-varying for the second intervention. Time-fixed covariates measured before MRSA onset or at index date included patient’s demographics (age, sex, race), Charlson’s comorbidity index, admission type, intensive care unit (ICU) stay, healthcare acquired infection, and previous antimicrobial resistance testing. We also collated all prior clinical diagnoses present with at least 10% frequency in the study population (mapping all ICD-10 codes into ICD-9), to investigate additional potential drivers of the outcome, as done in another study (Jun et al., 2022). The setup for time-varying covariates collected after the index date (time-fixed) is illustrated in Figure 3 using a causal directed acyclic graph (DAG). For example, one time-varying confounder is the nephrotoxicity variable, defined as a 50% decrease in creatinine clearance (CrCl) from a baseline value (Wong-Beringer et al., 2011). If a patient was missing the creatinine clearance value at a given time point, the previous creatinine value closest to the time point was used.
Figure 3:

The directed acyclic graph representing causal relationships among sequential antibiotic treatment (A1 at Time 1, A2 at Time 2, and A3 at Time 3), influencers and confounding factors, and 30-day mortality (Y)
Note: A1, A2, A3 are treatment variables at each time point (either vancomycin or others). Y is a 30-day mortality. Demographics, comorbidity, severity, and past multi-drug resistance from previous EHR records are measured at baseline. Nephrotoxicity is a time-varying confounder that affects the following antibiotic prescriptions (A2, A3). In this figure, we included known risk factors between antibiotic treatment and mortality.
2.4. Causal Survival Forests and G-formula
Causal survival forests (CSF) are an adaptation of the causal forest algorithm, a nonparametric method for estimating heterogeneous treatment effects in survival settings with right-censored data (Cui et al., 2023). The causal effect of the antibiotic sequential strategy is estimated under the Neyman-Rubin’s potential outcome model framework (Imbens and Rubin, 2015). This estimation operates within a statistical setting where we have n independent and identically distributed subjects (i = 1, … , n), and we observe each subject’s tuple (Xi, Yi, Wi, Di).
In this context, Xi denotes a vector of covariates, Yi represents the observed response variable (i.e., days to death), Wi ∈ {0, 1} signifies the binary treatment assignment (specifically, whether or not a change in the antibiotic was made), and Di acts as an event indicator, signifying whether the event (i.e., death) took place. Given this configuration, we can identify (1) if there are heterogeneous effects among patients and (2) which specific population (i.e., which combination of covariates) shows high heterogeneity. We have employed the concepts of the Conditional Average Treatment Effect (CATE) and the Rank-Weighted Average Treatment Effect (RATE) to quantify these heterogeneous effects.
The CATE is defined by the equation CATE = E[Yi(1) − Yi(0)| Xi = x] and is the expected mean of difference between potential outcomes Yi(0), Yi(1) given auxiliary covariates Xi. CATE can be used to derive treatment prioritization rules, and the RATE serves the purpose of evaluating how good treatment prioritization rules are at distinguishing sub-populations with different treatment effects, or whether there exists notable heterogeneity. RATE only considers ranking of each patient’s rather than considering numeric size of the score. For quantifying the treatment benefit, the Targeting Operator Characteristics (TOC) is further calculated.
In the TOC equation, TOC(q) implies the top q-th fraction of individuals with the largest prioritzation score S(Xi). FS(Xi) is the distribution function of S(Xi) for comparing the ATE in the top q-th fraction of individuals with the largest prioritization score S(Xi) with the overall ATE from treating everyone. If the TOC is equal to 0, it means that there is no benefit in stratifying the treatments using given prioritization rules. The parametric g-formula is an extended version of standardization by Robins for time-varying treatments and confounders. It uses the identification assumptions of inverse probability weighting, but it models the outcome means instead of the treatment equation (Ezzati et al., 2004; Westreich et al., 2012; McGrath et al., 2020). All analyses were conducted using the R software (https://www.r-project.org/), including the ‘grf’ (Tibshirani et al., 2023) and ‘gfoRmula’ (McGrath et al., 2020) packages.
3. Results
3.1. Population Characteristics, Outcomes, and Dynamic Treatment Assignments
Among 1,433 patients admitted between 2011 and 2019, with a confirmed MRSA diagnosis, 914 had at least one year of prior medical history from the onset of the infection and 872 patients had complete record data from admission to discharge. Of these, Time 1 was observed in 817 patients, Time 2 in 707 patients, and Time 3 in 427 patients. As the objective was to reach the sustained treatment time point, the final study population comprises the last subset of 427 patients.
The mean age of the study population was 55 years, 48.9% were male, 60.4% white, and 34.4% had multi-drug resistance (more than three antibiotic classes). The proportion of patients who stayed in the ICU was 52.2% and 24.1% were assumed to have an healthcare-acquired infection. The overall length of admission was median 19 days, from a minimum of 10 days to a maximum of 1,050 days. Out of the 427 patients, 33 patients (7.7%) died within 30 days from the MRSA onset. The summary statistics on the study population are given in Table 1.
Table 1:
Baseline characteristics of the vancomycin started groups and overall population
| Variables* | Group | ||||
|---|---|---|---|---|---|
| V 111 | V 110 | V 101 | V 100 | Overall | |
| (N=240) | (N=88) | (N=38) | (N=48) | (N=427) | |
| Patient’s demographics | |||||
| Age | 54.0(16.2) | 57.1(18.6) | 58.3(13.6) | 57.1(12.5) | 55.0(16.3) |
| Sex - Male | 117(48.8%) | 48(54.5%) | 18(47.4%) | 18(37.5%) | 209(48.9%) |
| Race - White | 160(66.7%) | 49(55.7%) | 21(55.3%) | 19(39.6%) | 258(60.4%) |
| Medical conditions at or before index date | |||||
| Diabetes | 58(24.2%) | 23(26.1%) | 4(10.5%) | 9(18.8%) | 96(22.5%) |
| Renal Disease | 95(39.6%) | 45(51.1%) | 26(68.4%) | 39(81.3%) | 211(49.4%) |
| Chronic pulmonary disease | 128(53.3%) | 47(53.4%) | 24(63.2%) | 29(60.4%) | 237(55.5%) |
| Mild liver disease | 71(29.6%) | 23(26.1%) | 9(23.7%) | 10(20.8%) | 117(27.4%) |
| Moderate/Severe liver disease | 20(8.3%) | 8(9.1%) | 8(21.1%) | 4(8.3%) | 40(9.4%) |
| Cancer (any malignancy) | 31(12.9%) | 15(17.0%) | 7(18.4%) | 8(16.7%) | 62(14.5%) |
| Peripheral vascular disease | 100(41.7%) | 33(37.5%) | 24(63.2%) | 25(52.1%) | 183(42.9%) |
| Charlson’s Comorbidity Index | 5.80(3.65) | 6.52(4.48) | 8.50(3.75) | 7.42(3.30) | 6.35(3.88) |
| Evidence of antimicrobial resistance (infections prior to MRSA) | |||||
| Aminoglycosides | 33(13.8%) | 19(21.6%) | 13(34.2%) | 12(25.0%) | 79(18.5%) |
| Beta-lactams | 114(47.5%) | 42(47.7%) | 23(60.5%) | 28(58.3%) | 214(50.1%) |
| Carbapenems | 14(5.8%) | 7(8%) | 6(15.8%) | 6(12.5%) | 34(8%) |
| Fluoroquinolones | 55(22.9%) | 29(33.0%) | 19(50.0%) | 23(47.9%) | 130(30.4%) |
| Glycopeptides | 16(6.7%) | 7(8%) | 5(13.2%) | 7(14.6%) | 37(8.7%) |
| Polypeptides | 3(1.3%) | 1(1.1%) | 0(0%) | 1(2.1%) | 5(1.2%) |
| Sulfonamides | 54(22.5%) | 25(28.4%) | 14(36.8%) | 14(29.2%) | 111(26.0%) |
| Tetracyclines | 24(10.0%) | 13(14.8%) | 9(23.7%) | 8(16.7%) | 55(12.9%) |
| Multi-drug resistance (3+) | 66(27.5%) | 33(37.5%) | 21(55.3%) | 21(43.8%) | 147(34.4%) |
| Admission information | |||||
| ICU stay | 133(55.4%) | 37(42.0%) | 26(68.4%) | 25(52.1%) | 223(52.2%) |
| Healthcare acquired | 60(25.0%) | 13(14.8%) | 14(36.8%) | 15(31.3%) | 103(24.1%) |
| Days of admission | 20[10,392] | 19[10,115] | 19[10,1050] | 19[10,65] | 19[10,1050] |
| Outcome | |||||
| Death within 30 days | 11(4.6%) | 11(12.5%) | 5(13.2%) | 5(10.4%) | 33(7.7%) |
Mean(SD) or Median[Min,Max] or Count(%)
Among the 427 patients, 96.9% started with vancomycin, 56.2% used vancomycin treatment throughout all three timepoints, while 43.8% of them changed from vancomycin to another antibiotic at least once; 21.3% changed their treatment from Time 1 to Time 2 and 32.6% from Time2 to Time 3. In Table 2 we summarized the number of subjects within each possible scenarios of antibiotic treatment at the three sequential timepoints corresponding to the empirical, directed, and sustaining treatment periods, along with the proportions of suspected nephrotoxicity, which is one of the main reasons for antibiotic change.
Table 2:
Number of study subjects within each possible scenarios of antibiotic treatment (A1 A2 A3) at the three sequential timepoints corresponding to the empirical, directed, and sustaining treatment periods (T1 T2 T3), together with the proportion of suspected nephrotoxicity that can trigger antibiotic change.
| # | A 1 | A 2 | A 3 | Overall | Suspected Nephrotoxicity | |
|---|---|---|---|---|---|---|
| Yes(N=28) | No(N=39) | |||||
| Time | T 1 | T 2 | T 3 | T1&T2&T3 | T1 − T2 | T1 − T3 |
| 1 | Vancomycin | Vancomycin | Vancomycin | 240(56.2%) | 15(53.6%) | 18(46.2%) |
| 2 | Vancomycin | Vancomycin | Others | 88(20.6%) | 7(25.0%) | 8(20.5%) |
| 3 | Vancomycin | Others | Vancomycin | 38(8.9%) | 1(3.6%) | 6(15.4%) |
| 4 | Vancomycin | Others | Others | 48(11.2%) | 4(14.3%) | 5(12.8%) |
| 5 | Others | Vancomycin | Vancomycin | 3(0.7%) | 0(0%) | 0(0%) |
| 6 | Others | Vancomycin | Others | 2(0.5%) | 0(0%) | 0(0%) |
| 7 | Others | Others | Vancomycin | 2(0.5%) | 0(0%) | 0(0%) |
| 8 | Others | Others | Others | 6(1.4%) | 1(3.6%) | 2(5.1%) |
3.2. Estimation of Treatment Effects
For the first intervention, we generated two estimates of the conditional average treatment effect using the CSF. Model 1 included the expert-selected variables of the DAG (sex, race, age, Charlson’s comorbidity score, ICU stay, and multidrug resistance). The average treatment effect for changing antibiotics during any timepoint showed a reduction in the probability of death (Mean = −0.07619, SE=0.02953). All covariates had no effect on mortality (i.e., p-value below 0.05). Model 2 also included the DAG variables, but expanded all individual comorbidities. The average treatment effect of this model showed a negative effect (Mean = −0.0810, SE=0.02953) similar to Model 1. Table 3 details CATE results using the best linear predictor for both Model 1 and Model 2.
Table 3:
Estimate of the conditional treatment effect of changing antibiotics during any timepoint on to mortality, using the causal survival forest method.
| CATE Model (1) - Using only DAG variables | |||
|---|---|---|---|
| Average Treatment Effect: −0.07619 (SE = 0.02953) | |||
| Individual Treatment Effect: Min: −0.1584, Mean: −0.0755, Median: −0.0739, Max: −0.0217 | |||
| Variables | Estimate | Std. Error | t value Pr(> |t|) |
| Sex | 0.0407 | 0.0604 | 0.5004 |
| Race | −0.0565 | 0.0580 | 0.3305 |
| Age | −0.0008 | 0.0018 | 0.6429 |
| Charlson’s Comorbidity Index | −0.0031 | 0.0073 | 0.6725 |
| ICU stay | −0.0656 | 0.0569 | 0.2492 |
| Multi-drug resistance | 0.0627 | 0.0575 | 0.2760 |
| CATE Model (2) - Using DAG + individual comorbidities | |||
| Average Treatment Effect: −0.0810 (SE = 0.0281) | |||
| Individual Treatment Effect: Min: −0.1083, Mean: −0.0782, Median: −0.0783, Max: −0.0462 | |||
| Variables | Estimate | Std. Error | t value Pr(> |t|) |
| Sex | 0.0404 | 0.2723 | 0.8824 |
| Race | −0.1513 | 0.3784 | 0.6903 |
| Age | −0.0117 | 0.0110 | 0.2928 |
| Myocardial infarction | −0.1721 | 0.4967 | 0.7299 |
| Congestive heart failure | 0.2024 | 0.3747 | 0.5906 |
| Cerebrovascular disease | 0.2644 | 0.4104 | 0.5212 |
| Dementia | 0.4225 | 0.6213 | 0.4985 |
| Chronic pulmonary disease | 0.3245 | 0.3663 | 0.3783 |
| Rheumatoid disease | −0.2275 | 0.6859 | 0.7410 |
| Peptic ulcer disease | 0.372 | 0.4869 | 0.4471 |
| Mild liver disease | −0.1906 | 0.2974 | 0.5234 |
| Diabetes without complications | 0.2187 | 0.6174 | 0.7241 |
| Diabetes with complications | 0.8421 | 0.7525 | 0.2664 |
| Hemiplegia or paraplegia | 0.1629 | 0.4264 | 0.7034 |
| Renal disease | −0.0713 | 0.3952 | 0.8572 |
| Cancer (any malignancy) | 0.2896 | 0.4059 | 0.4776 |
| Moderate or severe liver disease | −0.2539 | 0.6188 | 0.6827 |
| Metastatic solid tumor | 0.2895 | 0.5006 | 0.5647 |
We then assessed heterogeneity for the CSF models using the area under the TOC curve (AUTOC) from the RATE function (Figure 4). In Model 1, there was minimal heterogeneity of treatment effect (AUTOC = 0.01, S.E = 0.06). In Model 2, the group with quantile above 15 would benefit from the treatment change (AUTOC = −0.04, S.E = 0.06).
Figure 4:
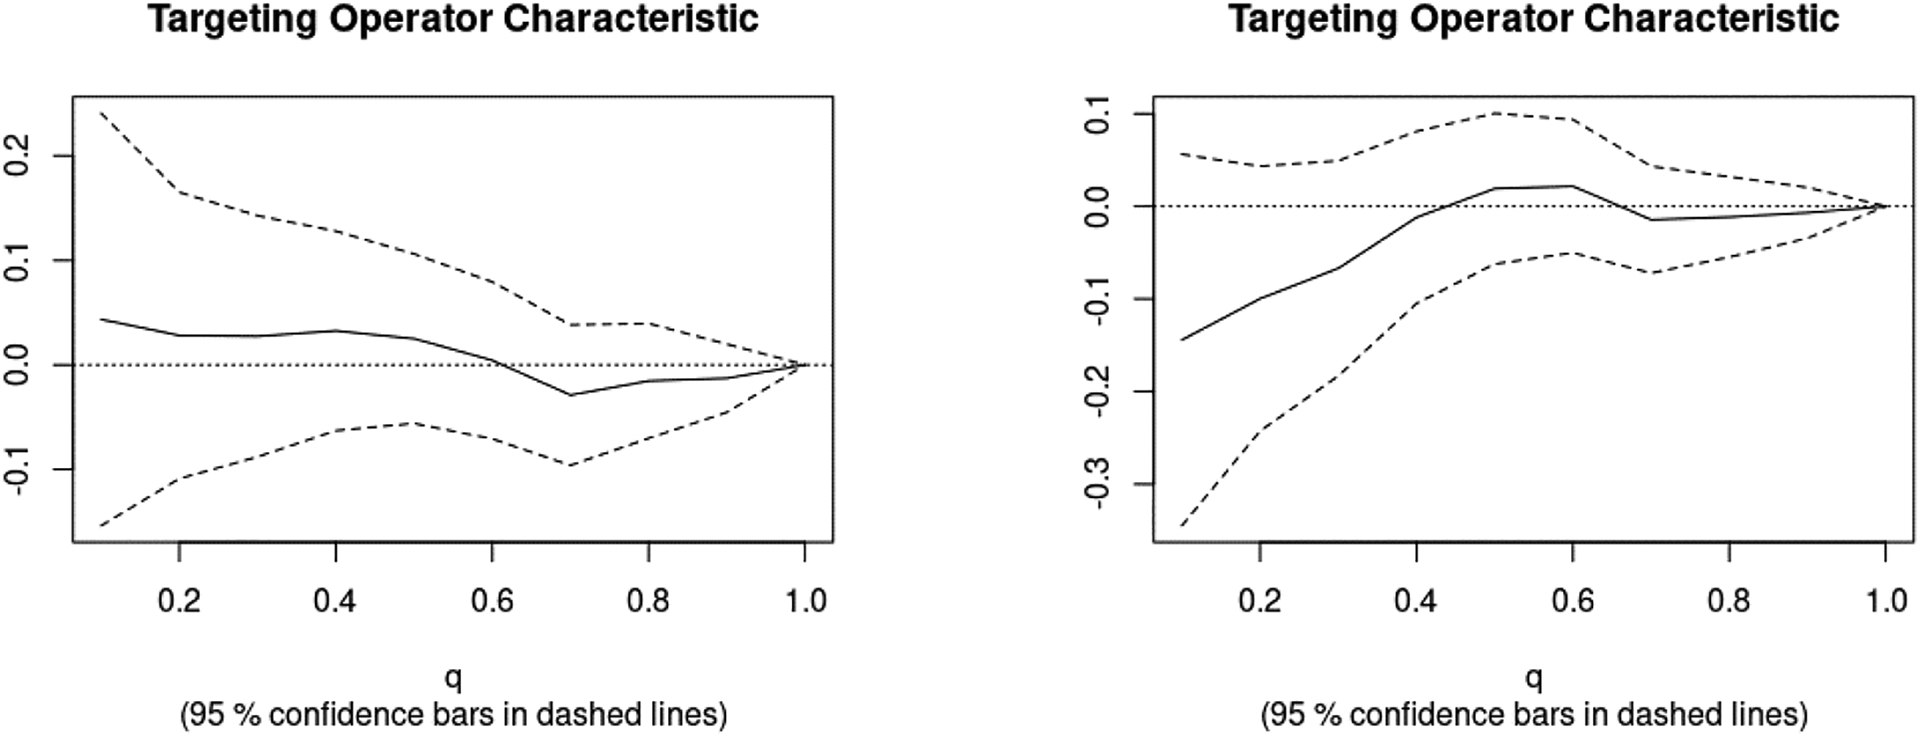
Targeting Operator Characteristics Curves for CSF-based CATE models: Model1 depicted on the left side and Model2 depicted on the right side graph
In the analysis of the second intervention, we used the g-formula to estimate the effect of vancomycin vs. other treatment updated at each time point on 30-days mortality, in the presence of time-varying and time-fixed confounding. Table 4 shows the g-formula mean, ratio, and difference for the reference Intervention 0, which was the observed treatment (natural course), compared to the Intervention 1 scenario of “Never treat with vancomycin or switch immediately after empiric treatment”, and Intervention 2 scenario of “Always treat with vancomycin and do not switch to another antibiotic”. The mean ratio and mean difference highlight the difference between intervention scenarios using observed scenario as a reference group. For the whole study population, under the reference scenario, the empirical risk of the outcome was 7.7%, corresponding to the event proportion (30-day mortality) in our study population. If all patients were assigned to Intervention 1, the risk increased approximately to 14.6%. If all patients were assigned to Intervention 2, the risk was lower than the observed treatment scenario which was about 5.0%.
Table 4:
G-formula estimation the effect of vancomycin vs. other treatment updated at each time point on 30-days mortality, in the presence of time-varying and time-fixed confounding, stratified by empiric treatment (Time 1).
| Population | Intervention | G-formula mean | Mean ratio | Mean difference |
|---|---|---|---|---|
| All patients (N=427) | 0 – Observed Treatment | 0.07645 | 1.00 (ref) | 0.0000 |
| 1 – Never treat with vancomycin or switch immediately after empiric treatment | 0.14615 | 1.91 | 0.0696 | |
| 2 – Always Treat with vancomycin and do not switch to another antibiotict | 0.05005 | 0.65 | −0.0264 | |
| Patients received vancomycin at T1 (N=414) | 0 – Observed Treatment | 0.07533 | 1.00 (ref) | 0.0000 |
| 1 – Never treat with vancomycin or switch immediately after empiric treatment | 0.16744 | 2.22 | 0.0921 | |
| 2 – Always Treat with vancomycin and do not switch to another antibiotict | 0.04977 | 0.66 | −0.0255 |
In the subset of patients who started their empiric treatment with vancomycin, under Intervention 1, the risk increased to 16.7% from the reference scenario. Under Intervention 2, the risk was 4.97%, lower than the observed treatment scenario. Overall, results in the whole and vancomycin-empiric population were similar, and the current sequential vancomycin treatment was better than not giving anyone vancomycin, but worse than giving everyone vancomycin.
4. Discussion
We found that switching from vancomycin to another antibiotic improved survival probability. Additionally, there was benefit from initiating vancomycin compared to not using it at any time point. Our findings are consistent with the general knowledge of clinical efficacy of vancomycin in the treatment of invasive MRSA infections obtained through RCTs. In our population, over 95% of patients were prescribed empiric vancomycin treatment, reflecting the common preference for this antibiotic in managing potential infections that have not yet been confirmed (VanEperen and Segreti, 2016). However, despite being the first-line choice of treating invasive MRSA infections, vancomycin was consistently used during all three timepoints in only half (56%) of the of the population and many patients who initially treated with vancomycin switched to another antibiotic at least once. This change might suggest concerns over vancomycin’s side effects, particularly nephrotoxicity, from the provider (Jeffres, 2017), reflecting the importance of considering these time-varying components in our models. This is also supported by the increased prevalence of nephrotoxicity in those who received consistent vancomycin treatment. Despite this, we found a decreased mortality probability when patients stayed on vancomycin, emphasizing its role despite potential complications.
In addition to time-varying treatment effects, we investigated putative treatment heterogeneity, which is key to the development of personalized treatments that cater to individual patient characteristics (Varadhan et al., 2013). We found low evidence of heterogeneity, although it could have been due to lack of power. Lack of power is even more problematic with RCTs, that can become cumbersome and resource-heavy to include sufficiently diverse populations. Furthermore, RCTs can include inherent selection bias because of strict inclusion criteria. For example, those with establish renal failure are typically excluded from vancomycin trials (Paul et al., 2015), however these individuals remain a priority group in assessing effects of vancomycin due to known side effects of the antibiotic.
Our study has a number of limitations. Firstly, our study design and data analysis make simplifications (albeit clinically reasonable) in the treatment staging and decision-making process that are a conceptual abstraction. The timepoints utilized in this study do not exactly align with real clinical settings and patient populations. While culturing methods remain the preferred method for confirming MRSA infections, different institutions may implement other approaches that would deviate from the timeline we defined. It is important to note here that, even if the measurement time points are the same across all patients, there can be also chance of including immortal time bias which differs among treatment paths. Secondly, our analysis does not consider the dosage of vancomycin therapy. This is particularly important to take into account in future analyses, due to its relationship with nephrotoxicity that influence on antibiotic selection. Thirdly, we considered all MRSA infections in this analysis and did not differentiate between specific types of infections (e.g., bloodstream, lung, skin and soft tissue). It is possible that the relationship between sequential vancomycin therapy and outcomes may vary between anatomic sources of infections due to the inherent pharmacodynamics of vancomycin.
As statistical methodologies continue to advance, promising opportunities arise for future research in sequential treatment optimization, particularly through the incorporation of algorithms from causal inference and machine learning. Examples include the flexible Bayesian Additive Regression Trees (BART) and Counterfactual Regression (CFR), which adaptly handle high-dimensional environments and intricate non-linear relationships, respectively (Hill, 2011; Shalit et al., 2017). Despite not being originally designed for time-varying treatments or confounders, innovative variations of these models have been developed (Linero and Zhang, 2022). In our study, we focused on sequential time-varying treatment options and confounders, utilizing the G-formula due to its ability to manage complex, dynamic scenarios. However, evaluating a broader array of models could further substantiate our research findings.
5. Conclusion
In this study we operationalized sequential treatment strategies aimed at identifying relevant heterogeneity and optimizing risk based on individual patients’ characteristics. We demonstrated the utility of applying causal machine learning to real-world data within a framework that can be used to screen multiple intervention hypotheses, especially for life-threatening conditions, and select the most promising to be tested with conventional RCTs, possibly saving resources and lives.
Acknowledgments and Disclosure of Funding
This work was in part supported by US Federal grants NIH NIAID 1R01AI141810 and NIH NIA R33AG062884.
Contributor Information
Inyoung Jun, Department of Epidemiology, College of Public Health and Health Professions, University of Florida, Gainesville, FL 32610, USA.
Scott A. Cohen, Department of Epidemiology, College of Public Health and Health Professions, University of Florida, Gainesville, FL 32610, USA
Sarah E. Ser, Department of Epidemiology, College of Public Health and Health Professions, University of Florida, Gainesville, FL 32610, USA
Simone Marini, Department of Epidemiology, College of Public Health and Health Professions, University of Florida, Gainesville, FL 32610, USA.
Robert J. Lucero, School of Nursing, University of California, Los Angeles, Los Angeles, CA 90095, USA
Jiang Bian, Department of Health Outcomes and Biomedical Informatics, College of Medicine, University of Florida, Gainesville, FL 32610, USA.
Mattia Prosperi, Department of Epidemiology, College of Public Health and Health Professions, University of Florida, Gainesville, FL 32610, USA.
References
- Alexander J. Andrew N., Worrall Liam J., Hu Jinhong, Vuckovic Marija, Satishkumar Nidhi, Poon Raymond, Sobhanifar Solmaz, Rosell Federico I., Jenkins Joshua, Chiang Daniel, Mosimann Wesley A., Chambers Henry F., Paetzel Mark, Chatterjee Som S., and Strynadka Natalie C. J.. Structural basis of broad-spectrum -lactam resistance in Staphylococcus aureus. Nature, 613(7943):375–382, January 2023. ISSN 1476–4687. doi: 10.1038/s41586-022-05583-3. URL https://www.nature.com/articles/s41586-022-05583-3. Number: 7943 Publisher: Nature Publishing Group. [DOI] [PMC free article] [PubMed] [Google Scholar]
- Centers for Disease Control and Prevention. Antibiotic resistance threats in the United States, 2019. Technical report, U.S. Department of Health and Human Services, CDC, Atlanta, GA, 2019. URL https://stacks.cdc.gov/view/cdc/82532. [Google Scholar]
- Cui Yifan, Kosorok Michael R., Sverdrup Erik, Wager Stefan, and Zhu Ruoqing. Estimating heterogeneous treatment effects with right-censored data via causal survival forests, February 2023. URL http://arxiv.org/abs/2001.09887.arXiv:2001.09887 [cs, stat].
- Ezzati Majid, Lopez Alan D, Rodgers Anthony A, and Murray Christopher J. L. Comparative quantification of health risks : global and regional burden of disease attributable to selected major risk factors / edited by Majid Ezzati … [et al.], 2004. Pages: Includes 2v. only (2248 p.).
- Filippone Ej, Kraft Wk, and Farber Jl. The Nephrotoxicity of Vancomycin. Clinical Pharmacology & Therapeutics, 102(3):459–469, 2017. ISSN 1532–6535. doi: 10.1002/cpt.726. URL https://onlinelibrary.wiley.com/doi/abs/10.1002/cpt.726._eprint: https://onlinelibrary.wiley.com/doi/pdf/10.1002/cpt.726. [DOI] [PMC free article] [PubMed] [Google Scholar]
- Hill Jennifer L.. Bayesian nonparametric modeling for causal inference. 20(1):217–240, 2011. ISSN 1061–8600. doi: 10.1198/jcgs.2010.08162. URL 10.1198/jcgs.2010.08162. Publisher: Taylor & Francis. [DOI] [Google Scholar]
- Imbens Guido W. and Rubin Donald B.. Causal Inference for Statistics, Social, and Biomedical Sciences: An Introduction. Cambridge University Press, Cambridge, 2015. ISBN 978-0-521-88588-1. doi: 10.1017/CBO9781139025751. URL https://www.cambridge.org/core/books/causal-inference-for-statistics-social-and-biomedical-sciences/71126BE90C58F1A431FE9B2DD07938AB. [DOI] [Google Scholar]
- Jeffres Meghan N.. The Whole Price of Vancomycin: Toxicities, Troughs, and Time. Drugs,77(11):1143–1154, July 2017. ISSN 1179–1950. doi: 10.1007/s40265-017-0764-7. [DOI] [PMC free article] [PubMed] [Google Scholar]
- Jun Inyoung, Rich Shannan N., Marini Simone, Feng Zheng, Bian Jiang, Morris J. Glenn, and Prosperi Mattia. Moving from predicting hospital deaths by antibiotic-resistant bloodstream bacteremia toward actionable risk reduction using machine learning on electronic health records. AMIA Annual Symposium Proceedings, 2022:274–283, May 2022. ISSN 1942–597X. URL https://www.ncbi.nlm.nih.gov/pmc/articles/PMC9285157/. [PMC free article] [PubMed] [Google Scholar]
- Lee Andie S., de Lencastre Hermínia, Garau Javier, Kluytmans Jan, Malhotra-Kumar Surbhi, Peschel Andreas, and Harbarth Stephan. Methicillin-resistant Staphylococcus aureus. Nature Reviews. Disease Primers, 4:18033, May 2018. ISSN 2056–676X. doi: 10.1038/nrdp.2018.33. [DOI] [PubMed] [Google Scholar]
- Leekha Surbhi, Terrell Christine L., and Edson Randall S.. General Principles of Antimicrobial Therapy. Mayo Clinic Proceedings, 86(2):156–167, February 2011. ISSN 0025–6196. doi: 10.4065/mcp.2010.0639. URL https://www.ncbi.nlm.nih.gov/pmc/articles/PMC3031442/. [DOI] [PMC free article] [PubMed] [Google Scholar]
- Levine Donald P.. Vancomycin: A History. Clinical Infectious Diseases, 42(Supplement 1): S5–S12, January 2006. ISSN 1058–4838. doi: 10.1086/491709. URL 10.1086/491709. [DOI] [PubMed] [Google Scholar]
- Liang SY, Khair HN, McDonald JR, Babcock HM, and Marschall J. Daptomycin versus vancomycin for osteoarticular infections due to methicillin-resistant Staphylococcus aureus (MRSA): a nested case-control study. European Journal of Clinical Microbiology & Infectious Diseases: Official Publication of the European Society of Clinical Microbiology, 33(4):659–664, April 2014. ISSN 1435–4373. doi: 10.1007/s10096-013-2001-y. [DOI] [PMC free article] [PubMed] [Google Scholar]
- Linero Antonio R. and Zhang Qian. Mediation analysis using bayesian tree ensembles. pages No Pagination Specified–No Pagination Specified, 2022. ISSN 1939–1463(Electronic),1082–989X(Print). doi: 10.1037/met0000504. Place: US: Publisher: American Psychological Association. [DOI] [PubMed] [Google Scholar]
- Liu Jiajun, Tong Steven Y C, Davis Joshua S, Rhodes Nathaniel J, Scheetz Marc H, and CAMERA2 Study Group. Vancomycin Exposure and Acute Kidney Injury Outcome: A Snapshot From the CAMERA2 Study. Open Forum Infectious Diseases, 7(12):ofaa538, December 2020. ISSN 2328–8957. doi: 10.1093/ofid/ofaa538. URL 10.1093/ofid/ofaa538. [DOI] [PMC free article] [PubMed] [Google Scholar]
- McCreary Erin K, Kullar Ravina, Geriak Matthew, Zasowski Evan J, Rizvi Khulood, Schulz Lucas T, Ouellette Krista, Vasina Logan, Haddad Fadi, Rybak Michael J, Zervos Marcus J, Sakoulas George, and Rose Warren E. Multicenter Cohort of Patients With Methicillin-Resistant Staphylococcus aureus Bacteremia Receiving Daptomycin Plus Ceftaroline Compared With Other MRSA Treatments. Open Forum Infectious Diseases, 7(1):ofz538, January 2020. ISSN 2328–8957. doi: 10.1093/ofid/ofz538. URL 10.1093/ofid/ofz538. [DOI] [PMC free article] [PubMed] [Google Scholar]
- McGrath Sean, Lin Victoria, Zhang Zilu, Petito Lucia C., Logan Roger W., Hernán Miguel A., and Young Jessica G.. gfoRmula: An R Package for Estimating the Effects of Sustained Treatment Strategies via the Parametric g-formula. Patterns, 1(3), June 2020. ISSN 2666–3899. doi: 10.1016/j.patter.2020.100008. URL https://www.cell.com/patterns/abstract/S2666-3899(20)30008-8. Publisher: Elsevier. [DOI] [PMC free article] [PubMed] [Google Scholar]
- Paul Mical, Bishara Jihad, Yahav Dafna, Goldberg Elad, Neuberger Ami, Ghanem-Zoubi Nesrin, Dickstein Yaakov, Nseir William, Dan Michael, and Leibovici Leonard. Trimethoprim-sulfamethoxazole versus vancomycin for severe infections caused by meticillin resistant Staphylococcus aureus: randomised controlled trial. BMJ, 350:h2219, May 2015. ISSN 1756–1833. doi: 10.1136/bmj.h2219. URL https://www.bmj.com/content/350/bmj.h2219. Publisher: British Medical Journal Publishing Group Section: Research. [DOI] [PMC free article] [PubMed] [Google Scholar]
- Peyrani Paula and Ramirez Julio. What is the best therapeutic approach to methicillin-resistant Staphylococcus aureus pneumonia? Current Opinion in Infectious Diseases, 28 (2):164–170, April 2015. ISSN 1473–6527. doi: 10.1097/QCO.0000000000000149. [DOI] [PubMed] [Google Scholar]
- Rodvold Keith A. and McConeghy Kevin W.. Methicillin-resistant Staphylococcus aureus therapy: past, present, and future. Clinical Infectious Diseases: An Official Publication of the Infectious Diseases Society of America, 58 Suppl 1:S20–27, January 2014. ISSN 1537–6591. doi: 10.1093/cid/cit614. [DOI] [PubMed] [Google Scholar]
- Sawada Anri, Kawanishi Kunio, Morikawa Shohei, Nakano Toshihiro, Kodama Mio, Mitobe Mitihiro, Taneda Sekiko, Koike Junki, Ohara Mamiko, Nagashima Yoji, Nitta Kosaku, and Mochizuki Takahiro. Biopsy-proven vancomycin-induced acute kidney injury: a case report and literature review. BMC Nephrology, 19:72, March 2018. ISSN 1471–2369. doi: 10.1186/s12882-018-0845-1. URL https://www.ncbi.nlm.nih.gov/pmc/articles/PMC5872390/. [DOI] [PMC free article] [PubMed] [Google Scholar]
- Schweizer Marin L, Richardson Kelly, Vaughan Sarrazin Mary S, Goto Michihiko, Livorsi Daniel J, Nair Rajeshwari, Alexander Bruce, Beck Brice F, Jones Michael P, Puig-Asensio Mireia, Suh Daniel, Ohl Madeline, and Perencevich Eli N. Comparative Effectiveness of Switching to Daptomycin Versus Remaining on Vancomycin Among Patients With Methicillin-resistant Staphylococcus aureus (MRSA) Bloodstream Infections. Clinical Infectious Diseases, 72(Supplement_1):S68–S73, January 2021. ISSN 1058–4838. doi: 10.1093/cid/ciaa1572. URL 10.1093/cid/ciaa1572. [DOI] [PMC free article] [PubMed] [Google Scholar]
- Shalit Uri, Johansson Fredrik D., and Sontag David. Estimating individual treatment effect: generalization bounds and algorithms. In Precup Doina and Teh Yee Whye, editors, Proceedings of the 34th International Conference on Machine Learning, volume 70 of Proceedings of Machine Learning Research, pages 3076–3085. PMLR, 2017. URL https://proceedings.mlr.press/v70/shalit17a.html. [Google Scholar]
- Tibshirani Julie, Athey Susan, Sverdrup Erik, and Wager Stefan. grf: Generalized Random Forests, 2023. URL https://CRAN.R-project.org/package=grf.
- Turner Nicholas A., Sharma-Kuinkel Batu K., Maskarinec Stacey A., Eichenberger Emily M., Shah Pratik P., Carugati Manuela, Holland Thomas L., and Fowler Vance G.. Methicillin-resistant Staphylococcus aureus: an overview of basic and clinical research. Nature Reviews. Microbiology, 17(4):203–218, April 2019. ISSN 1740–1534. doi: 10.1038/s41579-018-0147-4. [DOI] [PMC free article] [PubMed] [Google Scholar]
- VanEperen Alison S. and Segreti John. Empirical therapy in Methicillin-resistant Staphylococcus Aureus infections: An Up-To-Date approach. Journal of Infection and Chemotherapy: Official Journal of the Japan Society of Chemotherapy, 22(6):351–359, June 2016. ISSN 1437–7780. doi: 10.1016/j.jiac.2016.02.012. [DOI] [PubMed] [Google Scholar]
- Varadhan Ravi, Segal Jodi B., Boyd Cynthia M., Wu Albert W., and Weiss Carlos O.. A framework for the analysis of heterogeneity of treatment effect in patient-centered outcomes research. Journal of Clinical Epidemiology, 66(8):818–825, August 2013. ISSN 0895–4356. doi: 10.1016/j.jclinepi.2013.02.009. URL https://www.sciencedirect.com/science/article/pii/S0895435613000863. [DOI] [PMC free article] [PubMed] [Google Scholar]
- Westreich Daniel, Cole Stephen R., Young Jessica G., Palella Frank, Tien Phyllis C., Kingsley Lawrence, Gange Stephen J, and Hernán Miguel A.. The parametric g-formula to estimate the effect of highly active antiretroviral therapy on incident AIDS or death. Statistics in Medicine, 31(18):2000–2009, 2012. ISSN 1097–0258. doi: 10.1002/sim.5316. URL https://onlinelibrary.wiley.com/doi/abs/10.1002/sim.5316._eprint: https://onlinelibrary.wiley.com/doi/pdf/10.1002/sim.5316. [DOI] [PMC free article] [PubMed] [Google Scholar]
- Wong-Beringer Annie, Joo Julianne, Tse Edmund, and Beringer Paul. Vancomycin-associated nephrotoxicity: a critical appraisal of risk with high-dose therapy. International Journal of Antimicrobial Agents, 37(2):95–101, February 2011. ISSN 0924–8579. doi: 10.1016/j.ijantimicag.2010.10.013. URL https://www.sciencedirect.com/science/article/pii/S0924857910004607. [DOI] [PubMed] [Google Scholar]
- World Health Organization. WHO publishes list of bacteria for which new antibiotics are urgently needed. February 2017. URL https://www.who.int/news/item/27-02-2017-who-publishes-list-of-bacteria-for-which-new-antibiotics-are-urgently-needed.
- Yeager Samantha D., Oliver Justin E., Shorman Mahmoud A., Wright Laurence R., and Veve Michael P.. Comparison of linezolid step-down therapy to standard parenteral therapy in methicillin-resistant Staphylococcus aureus bloodstream infections. International Journal of Antimicrobial Agents, 57(5):106329, May 2021. ISSN 1872–7913. doi: 10.1016/j.ijantimicag.2021.106329. [DOI] [PubMed] [Google Scholar]
- Yue Jirong, Dong Bi Rong, Yang Ming, Chen Xiaomei, Wu Taixiang, and Liu Guan J.. Linezolid versus vancomycin for skin and soft tissue infections. The Cochrane Database of Systematic Reviews, (1):CD008056, January 2016. ISSN 1469–493X. doi: 10.1002/14651858.CD008056.pub3. [DOI] [PMC free article] [PubMed] [Google Scholar]