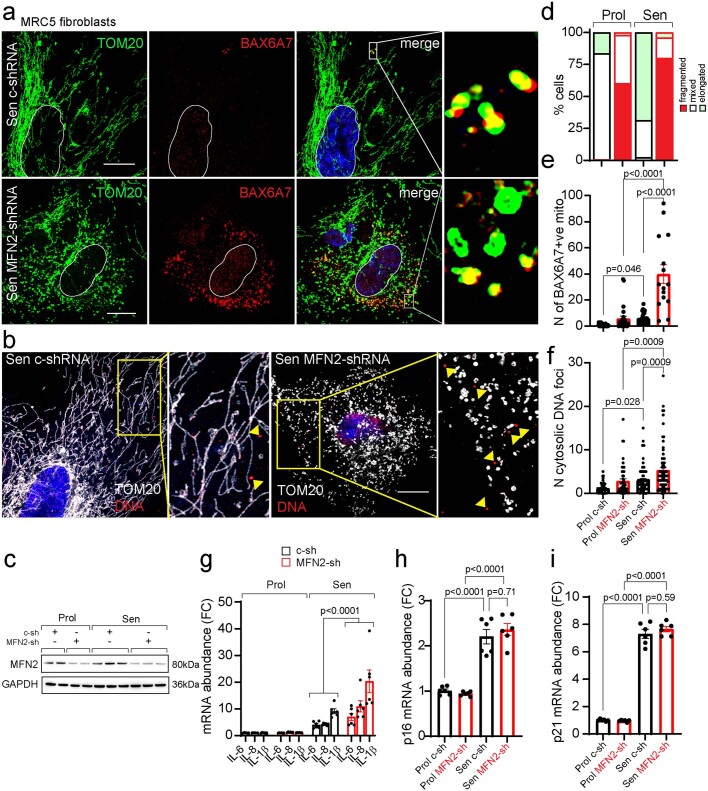
Extended Data Fig. 8. MFN2 deficiency exacerbates intracellular mtDNA release and the SASP in senescent MRC5 fibroblasts.
(a) Representative immunofluorescence images of TOM20 (green) and activated BAX (BAX6A7) (red) in senescent (IR) control (c-shRNA) and shRNA-mediated MFN2 knockout MRC5 fibroblasts (scale bar is 20 µm). Magnifications show BAX6A7 co-localizing with fragmented mitochondria. (b) Representative immunofluorescence images of TOM20 (white) and DNA (red) in control and shRNA-mediated MFN2 knockout MRC5 human fibroblasts (scale bar is 20 µm). Magnification shows DNA foci located outside of TOM20. Images are representative of n = 3 independent experiments (a, b). (c) Western blot showing the protein level of MFN2 following shRNA-mediated deletion of MFN2 in proliferating and senescent MRC5 fibroblasts. Quantification of (d) the percentage of cells containing fragmented, mixed, and elongated mitochondria (n = 3 independent experiments), (e) the number of BAX6A7- positive mitochondria in proliferating and senescent control and MFN2-shRNA MRC5 fibroblasts (n = 74 Prol, n = 26 Prol (sh-MFN2), n = 29 Sen (sh-C), n = 15 Sen (sh-MFN2) cells analysed over 2 independent experiments). Data are mean ± S.E.M. (f) Number of DNA foci located outside of TOM20 in proliferating and senescent control and MFN2-shRNA MRC5 fibroblasts. Data are mean of n = 3 independent experiments ± S.E.M. (n = 50 Prol, n = 49 Prol (sh-MFN2), n = 78 Sen (sh-C), n = 76 Sen (sh-MFN2) cells). Quantification of mRNA expression level of (g) indicated SASP factors, (h) p16INK4A, and (i) p21 in proliferating and senescent control- and MFN2- shRNA MRC5 fibroblasts. Data are mean of n = 6 independent experiments ± S.E.M. Statistical significance was assessed using one-way ANOVA followed by Tukey’s multiple comparison test (e, f, h, i), two-way ANOVA followed by Tukey’s multiple comparison test (g). For gel source data (c), see Supplementary Fig. 1.

