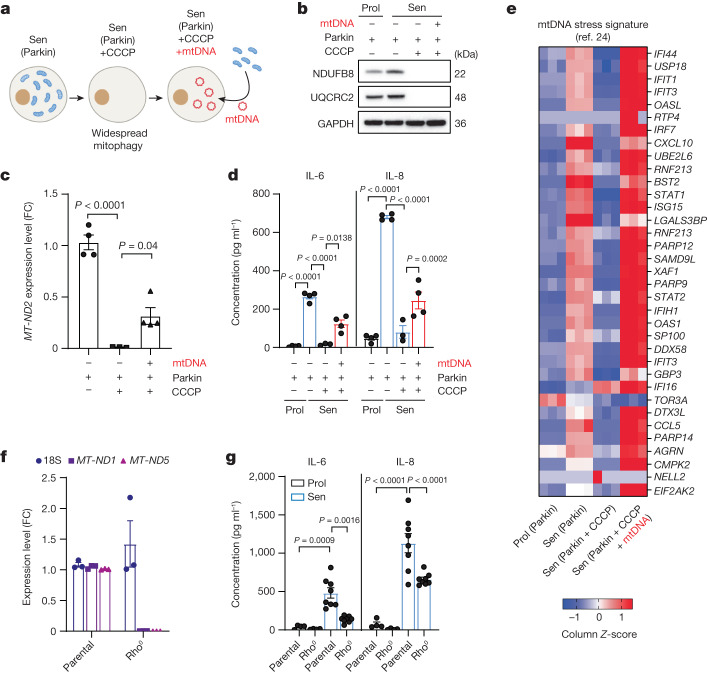
Fig. 5. Cytosolic mtDNA drives the SASP in senescent cells.
a, Schematic of the experimental approach. b, Western blot analysis of the expression levels of the mitochondrial proteins NDUFB8 and UQCRC2, demonstrating that mitochondrial proteins are absent after Parkin-mediated clearance and are not restored after mtDNA transfection in IMR90 human fibroblasts. c, qPCR quantification showing the levels of the mitochondrial gene MT-ND2 in Parkin-expressing IMR90 fibroblasts after widespread mitophagy and after mtDNA transfection. n = 3 (Parkin + CCCP) and n = 4 (Parkin control and Parkin + CCCP + mtDNA) independent experiments). d, The secretion levels of IL-6 and IL-8 in Parkin cells after mitochondria clearance and after mtDNA transfection. n = 3 (Parkin + CCCP) and n = 4 (Parkin control and Parkin + CCCP + mtDNA) independent experiments. e, Heat map revealing that the mtDNA stress signature identified previously24 was induced at the mRNA level in senescent cells, while the addition of CCCP reversed this phenotype. Reintroduction of mtDNA was able to restore this stress signature. f, mRNA expression levels of the nuclear-encoded gene 18S and the mitochondrial-genome-encoded genes MT-ND1 and MT-ND5 in parental and Rho0 cells. n = 3 independent experiments. g, The secreted levels of IL-6 and IL-8 in proliferating (n = 4) and senescent (n = 8) Rho0 cells. Data are mean ± s.e.m. Statistical significance was assessed using one-way ANOVA followed by Tukey’s multiple-comparison test (c, d and g). Individual data points are from biological replicates. Gel source data for b are provided in Supplementary Fig. 1.

