Abstract
The purpose of this study is to evaluate the accuracy and inter-observer agreement of a quantitative pulmonary surface irregularity (PSI) score on high-resolution chest CT (HRCT) for predicting transplant-free survival in patients with IPF. For this IRB-approved HIPAA-compliant retrospective single-center study, adult patients with IPF and HRCT imaging (N = 50) and an age- and gender-matched negative control group with normal HRCT imaging (N = 50) were identified. Four independent readers measured the PSI score in the midlungs on HRCT images using dedicated software while blinded to clinical data. A t-test was used to compare the PSI scores between negative control and IPF cohorts. In the IPF cohort, multivariate cox regression analysis was used to associate PSI score and clinical parameters with transplant-free survival. Inter-observer agreement for the PSI score was assessed by intraclass correlation coefficient (ICC). The technical failure rate of the midlung PSI score was 0% (0/100). The mean PSI score of 5.38 in the IPF cohort was significantly higher than 3.14 in the negative control cohort (p < .001). In the IPF cohort, patients with a high PSI score (≥ median) were 8 times more likely to die than patients with a low PSI score (HR: 8.36; 95%CI: 2.91–24.03; p < .001). In a multivariate model including age, gender, FVC, DLCO, and PSI score, only the PSI score was associated with transplant-free survival (HR:2.11 per unit increase; 95%CI: 0.26–3.51; p = .004). Inter-observer agreement for the PSI score among 4 readers was good (ICC: 0.88; 95%CI: 0.84–0.91). The PSI score had high accuracy and good inter-observer agreement on HRCT for predicting transplant-free survival in patients with IPF.
Supplementary Information
The online version contains supplementary material available at 10.1007/s10278-023-00896-9.
Keywords: Idiopathic pulmonary fibrosis, Imaging biomarkers, Liver surface nodularity, Machine learning, Computed tomography
Introduction
Idiopathic pulmonary fibrosis (IPF) is the most common progressive and fatal fibrotic lung disease, with 50,000 new cases per year in the USA [1–3]. The clinical course of IPF is heterogeneous with half of patients dying within 3–5 years of diagnosis [1–5]. Additionally, there is wide variability in responsiveness to approved antifibrotic drugs [6]. Currently, there is a lack of validated markers for IPF that predict disease course and enable assessment of response to specific therapies, which has slowed the development of new therapies for pulmonary fibrosis [7]. There is a critical need to develop and validate a marker for IPF and other forms of pulmonary fibrosis. The ideal marker should be accurate, precise, simple, noninvasive, quantitative, and widely applicable [8, 9].
The forced vital capacity (FVC) is easy to measure and has been the most commonly employed endpoint in clinical trials of IPF; however, FVC is not an ideal marker due to poor accuracy and repeatability [7, 10]. The diffusion capacity of carbon monoxide (DLCO) performs better as a prognostic indicator than FVC but is more difficult to measure, requires a breath-hold that can be difficult for more symptomatic patients, and has greater variability [7, 11]. The Gender-Age-Physiology (GAP) Index, a composite clinical score based on gender, age, FVC, and DLCO, is a useful prognostic marker but is insufficient for longitudinal tracking of disease progression and uncommonly used in clinical practice [12].
High-resolution computed tomography (HRCT) is routinely acquired for all patients with IPF and other forms of interstitial lung disease, and a marker that could be applied to existing HRCT images would add no additional patient cost or radiation to the standard of care [13–15]. IPF is characterized by honeycombing, traction bronchiectasis, ground-glass opacification, and fine reticulation, predominantly in the periphery of the mid to lower lungs [13, 14]. Multiple studies have assessed visual semiquantitative scoring systems for IPF severity on HRCT, and these are not used in clinical trials or clinical practice due to suboptimal inter-observer agreement [8, 12].
In the last decade, CT markers based on texture analysis, computer vision methods, or machine learning algorithms have been designed to quantify and classify different lung opacities (e.g., normal, ground-glass opacity, honeycombing, etc.) and exhibited high repeatability and accuracy [8]. However, these methods have not been successful at longitudinal evaluation of response to therapy or as a surrogate endpoint for clinical trials [8].
In patients with advanced liver fibrosis, quantitative methods to derive a liver surface nodularity (LSN) score have high accuracy and precision for staging liver fibrosis and predicting future liver-related events [16–18]. Similarly in patients with IPF, subpleural fibrotic scars result in progressive worsening of pulmonary surface irregularity (PSI). We hypothesize that quantification of PSI will differentiate normal from fibrotic lungs and serve as an accurate, simple, noninvasive, quantitative, and widely applicable marker with high inter-observer agreement. The objective of this pilot study is to evaluate the accuracy and inter-observer agreement of a quantitative PSI score on HRCT for predicting transplant-free survival in patients with IPF.
Materials and Methods
Patient Population
Informed consent was waived for this institutional review board–approved Health Insurance Portability and Accountability Act (HIPAA)–compliant retrospective single-center observational pilot study. This study included an IPF cohort (N = 50) and age- and gender-matched negative control cohort (N = 50), both derived from a larger subset of patients.
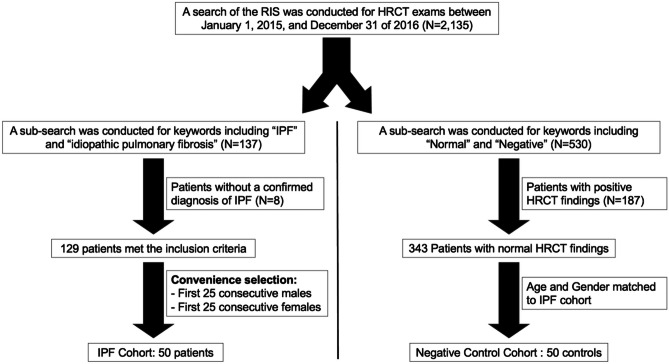
A search of the radiology information system was performed for HRCT exams between January 1, 2015 and December 31 of 2016, with identification of 2135 unique patients with at least 1 HRCT exam. This remote timeframe was chosen to provide sufficient time for an assessment of transplant-free survival in the IPF cohort. A subsearch of the full cohort was conducted for keywords including “IPF” and “idiopathic pulmonary fibrosis”, identifying 137 patients. Race and gender were collected from the electronic medical records (EMR). Patients without a confirmed diagnosis of IPF in the EMR (N = 6) were excluded. At our institution during this timeframe, a diagnosis of IPF was made using the 2011 American Thoracic Society guidelines [3]. For convenience of rapidly completing a pilot study, the first 25 consecutive males and 25 consecutive females with FVC and DLCO obtained within 3 months of HRCT were included. The inclusion and exclusion criteria are depicted in Fig. 1.
Fig. 1.
Flowchart depicting inclusion and exclusion criteria for patient selection. RIS, radiology information system; IPF, idiopathic pulmonary fibrosis; HRCT, high-resolution computed tomography of the chest
For the negative control group, a total of 25 males and 25 females were identified and included in the negative control cohort (Fig. 1).
Imaging Acquisition
HRCT images of the chest were obtained at a single academic medical center using HRCT imaging parameters on a GE Discovery 64 CT and LightSpeed16 scanners (Chicago, IL) and Philips Brilliance 64 (Amsterdam, Netherlands). Patients were imaged in prone position, in inspiration, and without administration of intravenous contrast. Patients were imaged with the following HRCT image acquisition and reconstruction parameters: 100 kV, smart mA with a noise index of 48, pitch of 0.984:1, rotation time of 0.5 s, and 1.25/1.25 mm section thickness/interval and bone reconstruction algorithm for the axial images.
Clinical Outcomes
The primary outcome of the study was transplant-free survival. For patients in the IPF cohort (N = 50), a search of the EMR was conducted to identify the date of lung transplantation, date of death, and date of last clinical visit. Overall survival (OS) was defined as the time from the HRCT to the time of death. The data were censored at the date of lung transplantation or at the date of the last clinical visit when there was no lung transplantation or death event.
Image Analysis
The Digital Imaging and Communications in Medicine (DICOM) format HRCT images were uploaded into existing liver surface nodularity (LSN) v1.0 software (BLINDED). A single imaging research fellow (A. A., with 5 years of imaging research experience and 5 years of experience with LSN software) made all PSI measurements while blinded to the clinical data and outcomes utilizing previously outlined techniques to measure the LSN score. Briefly, the user selected a 10-mm diameter circular region of interest (ROI) tool and painted along the lateral edge of the right lung on axial reformatted images, with the patient in prone position (Supplemental Fig. 1) [18]. The PSI score was initially measured by one reader (AA) in the right midlung, defined as the region between the aortic arch and the inferior pulmonary vein. Then in a separate session, the PSI score was measured by the same reader (AA) in the right lower lung, defined as the lung located below the inferior pulmonary vein. Anatomic markers were used to improve consistency and inter-observer agreement, and separate sessions were utilized to avoid bias and obtain independent measurements of the right midlung and right lower lung. Permanent or fixed fibrotic changes such as honeycombing are more common in the lower lungs in IPF, and inflammation and fibrosis occur later in the disease course in the midlung [13, 14]. Thereby, the right midlung and the right lower lung were selected as separate regions for PSI score measurement due to their distinct anatomical characteristics and patterns of disease severity and accordingly, the PSI score in the midlung may better differentiate the overall severity of disease in IPF and more accurately predict transplant-free survival than the PSI score in the lower lung. For simplicity, when this manuscript refers to the PSI score without specifying a location, the measurements were acquired in the midlung.
For each measurement session, 10 painted ROIs were placed evenly throughout the right midlung or right lower lung, respectively. The major fissures and post-surgical changes were avoided due to their effect on the lung surface. The software automatically detects the pulmonary surface from the painted ROI and fits a smooth polynomial line (spline) to the detected edge. The lateral margin of the lungs was chosen to exclude sharper bends that are often present along the anterior and posterior portions of the lungs, as the spline was not optimized to fit sharp bends in the lungs or liver. The distance between the detected pulmonary surface and spline was automatically measured on a pixel-by-pixel basis. The mean distance for each section (expressed as a continuous variable in tenths of a millimeter) was calculated. The PSI score was the arithmetic mean of the measurements from each section. By convention, a higher PSI score indicates higher pulmonary surface irregularity.
To obtain a PSI measurement, the painted portion must be at least 3 cm in length; otherwise, the software will not provide the measurement. We chose a minimum length of 3 cm to ensure reliable assessments of disease severity, avoiding shorter measurements that might not accurately reflect the extent of the condition. Measurements on 8 to 10 total sections were considered optimal, while measurements on 3 to 7 total sections were considered unreliable, and measurement of 0 to 2 total slices was considered a technical failure.
Our preliminary results revealed that the right midlung was a more accurate indicator of disease severity and predictor of overall survival. Consequently, 4 readers independently evaluated the right midlung and measured the PSI score from all patients (N = 100), while blinded to clinical data. Inter-observer variability was assessed among reader AA and the other three readers (B.B., C.C., and D.D.), each with 4–10 years of experience in radiology researching. Among them, two were research scientists, and the remaining two were radiologists with experience in chest imaging.
Statistical Analysis
Statistical analysis was performed using MedCalc Statistical Software v20.023 (Ostend, Belgium). The primary independent variables of interest were the PSI score and GAP score, and the primary outcome of interest was transplant-free survival. Summary statistics were reported for each variable.
A t-test was used to compare the PSI score between negative control and IPF cohorts. Multivariate cox regression analysis was used to associate the PSI score and other potential clinical predictors with transplant-free survival. A Kaplan–Meier plot was generated and log-rank test was used to compare the median overall survival for patients with high PSI score (≥ median) or low PSI score (< median). Inter-observer agreement for the PSI score was assessed by intraclass correlation coefficient (ICC) using Stata v16.1 (College Station, TX).
Results
Patient Cohort Characteristics
Patient characteristics are depicted in Table 1. The average age in the negative control and IPF cohorts was 63 years old. In total, 50% (50/100) of patients were male and 22% (22/100) were non-white races.
Table 1.
Patient characteristics
| Category | Negative control cohort | IPF cohort |
|---|---|---|
| N | 50 | 50 |
| Age | ||
| ≤ 55 | 10 | 10 |
| 56–65 | 20 | 20 |
| > 65 | 20 | 20 |
| Gender | ||
| Male | 25 | 25 |
| Female | 25 | 25 |
| Race | ||
| Asian | 2 | 1 |
| Black | 9 | 3 |
| Unknown | 1 | 3 |
| White | 38 | 43 |
IPF idiopathic pulmonary fibrosis
Technical Results
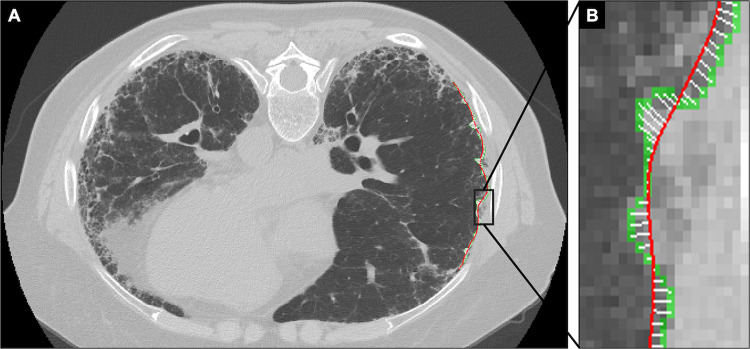
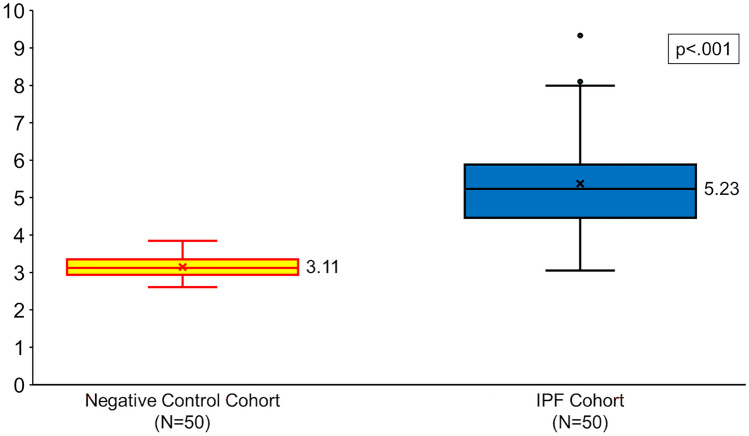
The technical unreliable rate and failure rate for the PSI score in the midlung in the full cohort were 0% (0/100) and 0% (0/100), respectively. The technical unreliable rate and failure rate for the PSI score in the lower lung in the IPF cohort were 4% (2/50) and 6% (3/50). Figure 2 depicts an example HRCT image with PSI measurement in a representative patient from the negative control cohort. Figure 3 depicts an example HRCT image with PSI measurement in a representative patient from the IPF cohort. Figure 4 depicts box plots comparing the PSI score in the negative control and IPF cohorts. The median (interquartile range [IQR]; range) of the PSI score in the negative control was 3.11 (2.94–3.35; 2.61–3.85) and 5.23 (4.46–5.91; 3.05–9.33) in the IPF cohort (Table 2). A mean PSI score of 3.14 in the negative control cohort was significantly lower than 5.38 in the IPF cohort (p < 0.001). The median (IQR; range) total length of pulmonary surface used to generate the PSI score was 13.8 (12.2–16.4; 4.7–23.4) cm in the negative control cohort and 13.2 (10.3–17.2; 4.7–23.4) cm in the IPF cohort. The median (IQR; range) total time performing PSI was 1.6 (1.3–1.9; 0.9–5.1) min in the negative control cohort and 4.2 (2.6–7.4; 1.5–9.2) min in the IPF cohort.
Fig. 2.
A 57-year-old male with no known lung disease (negative control). High-resolution axial CT image in the prone position depicts normal pulmonary parenchyma and a smooth pulmonary surface (A). Magnified image shows the PSI measurement along the lateral aspect of the right midlung (B). The distance between the detected pulmonary surface (green) and the spline (red) is minimal and measured on a pixel-by-pixel basis (white bars). The PSI score, the average from 10 PSI measurements, was 2.60
Fig. 3.
A 54-year-old male with idiopathic pulmonary fibrosis (IPF). High-resolution axial CT image in the prone position depicts moderately advanced peripheral pulmonary fibrosis and severe pulmonary surface irregularity (A). Magnified image shows the PSI measurement along the lateral aspect of the right midlung (B). The distance between the detected pulmonary surface (green) and the spline (red) is large and measured on a pixel-by-pixel basis (white bars). The PSI score, the average from 10 PSI measurements, was 6.58. The patient had advanced pulmonary fibrosis (GAP stage III) and died 15 months later
Fig. 4.
Box plots show the average PSI in the negative control cohort (yellow) and in the IPF cohort (blue). Median values are shown to the right of each box plot, and x represents the mean PSI score. p value represents the difference among the two studied cohorts
Table 2.
Summary statistics of the PSI score and clinical predictors of IPF severity
| Metrics | Normal cohort (N = 50) | IPF cohort (N = 50) |
|---|---|---|
| N | 50 | 50 |
| PSI score | ||
| Mean | 3.14 | 5.38 |
| Median (IQR) | 3.11 (2.94–3.35) | 5.23 (4.46–5.91) |
| Range | 2.61–3.85 | 3.05–9.33 |
| FVC | ||
| Mean | - | 66 |
| Median (IQR) | - | 66 (55–75) |
| Range | - | 37–97 |
| DLCO | ||
| Mean | - | 46.4 |
| Median (IQR) | - | 46.5 (34–57) |
| Range | - | 19–87 |
| GAP score | ||
| Mean | - | 3.4 |
| Median (IQR) | - | 3 (3–4) |
| Range | - | 0–7 |
IPF idiopathic pulmonary fibrosis, FVC forced vital capacity, DLCO diffusing capacity for carbon monoxide, PSI pulmonary surface irregularity, GAP score gender, age, and physiology score
Prediction of Transplant-Free Survival in the IPF Cohort
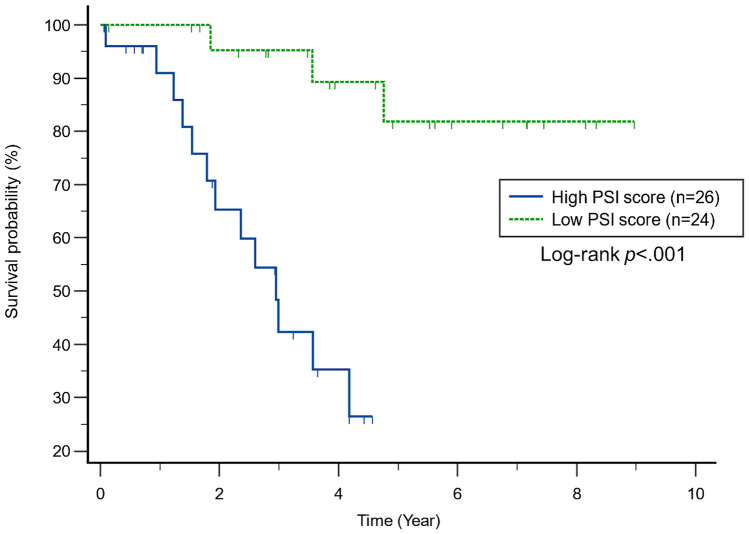
The median transplant-free survival for the IPF cohort was 3.6 years. In univariate analysis, patients with IPF and a high PSI score in the midlung (≥ median) were 8 times more likely to die than patients with a low PSI score (HR: 8.36; 95%CI: 2.91–24.03; p < 0.001). The median transplant-free survival of patients with IPF and a high PSI score (≥ median) was 2.95 years, while the median transplant-free survival of patients with IPF and a low PSI score had not been reached with a median follow up of 5.53 years (p < 0.001; Fig. 5). The correlation of the PSI score with FVC, DLCO, and the GAP score was not statistically significant (r: − 0.14, p = 0.305; r: − 0.16, p = 0.256; r: 0.22, p = 0.117, respectively). In a multivariate model that included age, gender, FVC, DLCO, and the PSI score (Table 3), only the PSI score was associated with transplant-free survival (HR: 2.11 per unit increase; 95%CI: 1.26–3.51; p = 0.004). In a separate multivariate model including only the GAP score and PSI score (Table 4), the PSI score was more strongly prognostic of transplant-free survival than the GAP score (HR: 2.28 per unit increase in PSI score; 95%CI: 1.49–3.49; p < 0.001 and HR: 1.40 per unit increase in GAP score; 95%CI: 1.04–1.89; p = 0.028).
Fig. 5.
Kaplan–Meier plot shows time to death in the IPF cohort (N = 50). The plot shows stratification of patients with respect to the median PSI score (5.23)
Table 3.
Predictors of transplant-free survival in patients with IPF
| Characteristic | IPF cohort (N = 50)a | |
|---|---|---|
| Univariable | Multivariable | |
| Age | 1.04 (0.97, 1.11) p = .311 | 1.05 (0.96, 1.14) p = .312 |
| Male gender | 0.45 (0.15, 1.04) p = .142 | 0.31 (0.09, 1.15) p = .080 |
| Race other than White | 1.26 (0.36, 4.46) p = .717 | 0.43 (0.06, 3.39) p = 0.429 |
| FVC (per unit increase) | 0.96 (0.36, 0.99) p = .010 | 0.96 (0.91, 1.02) p = .178 |
| DLCO (per unit increase) | 0.98 (0.95, 1.01) p = .278 | 0.98 (0.94, 1.01) p = .213 |
| PSI score (per unit increase) | 2.26 (1.50, 3.40) p < .001 | 2.11 (1.26, 3.51) p = .004 |
Data in bold emphasis indicate statistically significant results
IPF idiopathic pulmonary fibrosis, FVC forced vital capacity, DLCO diffusing capacity for carbon monoxide, PSI pulmonary surface irregularity, GAP score gender, age, and physiology score
aData presented as hazard ratio (95%CI) with p value
Table 4.
Predictors of transplant-free survival in patients with IPF
| Characteristic | IPF cohort (N = 50)a | |
|---|---|---|
| Univariable | Multivariable | |
| GAP score (per unit increase) | 1.42 (1.05, 1.90) p = .021 | 1.40 (1.04, 1.89) p = .028 |
| PSI score (per unit increase) | 2.26 (1.50, 3.40) p < .001 | 2.28 (1.49, 3.49) p < .001 |
Data in bold emphasis indicate statistically significant results
IPF idiopathic pulmonary fibrosis, PSI pulmonary surface irregularity, GAP score gender, age, and physiology score
aData presented as hazard ratio (95%CI) with p value
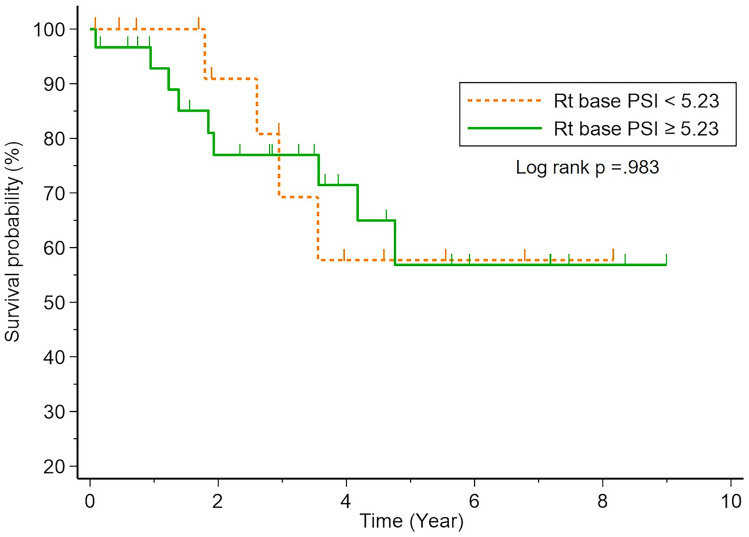
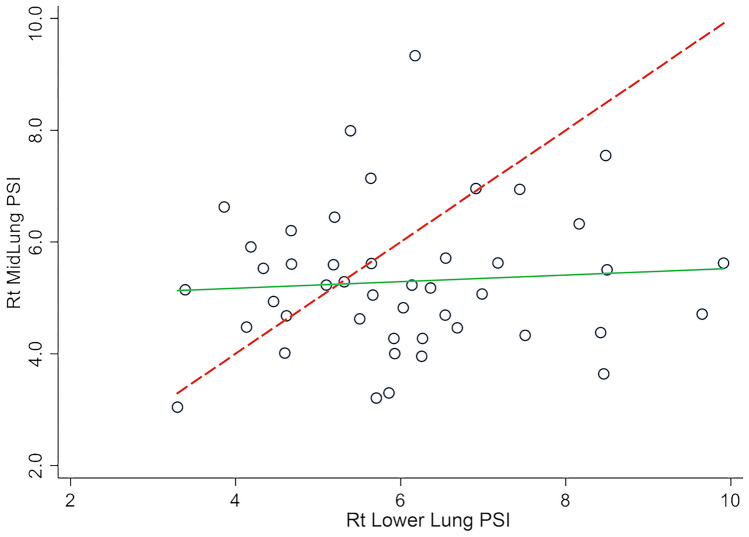
By comparison, in univariate analysis in patients with IPF, a high PSI score in the lower lung (≥ median) was not statistically associated with transplant-free survival (HR: 1.33; 95%CI: 0.45–3.97; p = 0.610; Fig. 6). Furthermore, the correlation of the PSI score in the lower lung was not statistically correlated with the PSI score of the midlung (r: 0.072, p = 0.638; Fig. 7).
Fig. 6.
Kaplan–Meier plot shows time to death in the IPF cohort (N = 50). The plot shows stratification of patients with respect to the median PSI score from the lower lung (5.23)
Fig. 7.
Scatter plot depicting midlung vs. lower lung PSI measurements. Green line represents linear fit, and the dashed line represents the line of complete agreement
Inter-observer Agreement
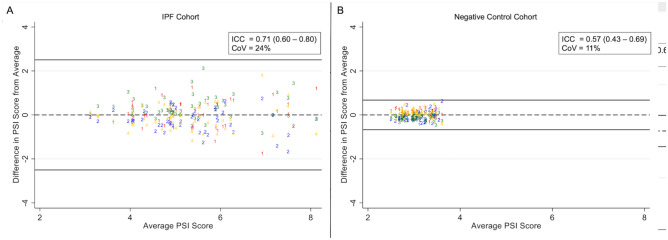
Inter-observer agreement for the PSI score among 4 readers evaluating the full cohort (N = 100) was good (ICC: 0.88; 95%CI: 0.84–0.91; coefficient of variation [CV]: 35%), with a Bland–Altman plot (Fig. 8) showing no substantial bias. Inter-observer agreement for the PSI score among 4 readers evaluating the IPF cohort (N = 50) was also good (ICC: 0.71; 95%CI: 0.60–0.80; CV: 24%), with a Bland–Altman plot (Fig. 9a) showing no substantial bias. Inter-observer agreement for the PSI score among 4 readers evaluating the negative control cohort (N = 50) was moderate (ICC: 0.57; 95%CI: 0.43–0.69; CV: 11%). In this case, the CV of variation was very low and likely more reflective of performance than the ICC values. A Bland–Altman plot of the negative control cohort (Fig. 9b) shows no substantial bias and clustering of values around the mean.
Fig. 8.
Bland–Altman plot depicting precision of the PSI score among 4 readers (labeled 1–4) evaluating HRCT images from the full cohort (N = 100)
Fig. 9.
Bland–Altman plot depicting precision of the PSI score among 4 readers (labeled 1–4) evaluating HRCT images from the IPF cohort (N = 50; A) and the negative control cohort (N = 50; B)
Discussion
IPF is a progressive disease with an inconsistent and unpredictable clinical course, and HRCT imaging and pulmonary function tests are widely used in the diagnostic workup [8, 19, 20]. A quantitative HRCT marker would therefore be widely applicable in patients with IPF.
In this single-center retrospective pilot study, the PSI score, a simple quantitative imaging marker applied to HRCT images, was highly accurate at predicting transplant-free survival in patients with IPF and had good inter-observer agreement. Patients in the IPF cohort with a high PSI score in the right midlung (≥ median) were 8 times more likely to die than patients with a low PSI score. The PSI score was independent of established markers including FVC and DLCO. In a multivariate model including GAP score and PSI score, the PSI score was more strongly prognostic of transplant-free survival.
Most current candidate quantitative HRCT markers are based on texture analysis, computer vision methods, or machine learning algorithms that quantify various lung opacities and imaging patterns (e.g., honeycombing, groundglass opacities, etc.) [8, 20]. By comparison, the PSI score is a length metric with continuous units, more specifically a measurement of the distance between the detected pulmonary surface and a smoothed polynomial line (spline) that is fit to the detected pulmonary surface. The PSI score had no substantial bias in the IPF and negative control cohorts.
The PSI score is a derivative of the LSN score, which is a highly accurate and precise marker for advanced liver fibrosis and cirrhosis [16–18]. Pulmonary fibrosis in IPF progressively retracts the pulmonary surface in an irregular fashion, leading to increased pulmonary surface irregularity and a higher PSI score with higher stages of pulmonary fibrosis.
Pulmonary fibrosis in IPF is almost always bilateral and symmetric with involvement of the mid to lower lungs [21, 22]. For our pilot study, the PSI score was measured in the right midlung to improve consistency, maintain a high technical success rate, and target lung that is most likely to differentiate early from late stage fibrosis. We explored PSI measurement in the lower lungs, but these were not associated with transplant-free survival and had a higher technical unreliable rate and failure rate than PSI measurements in the midlung. The findings support our hypothesis that the midlung may better differentiate overall severity of disease in IPF than the lower lung and accurately predicts transplant-free survival. Additional studies from our research team have confirmed this finding and will be published soon.
The PSI score is currently measured in a semiautomated fashion. The advantage of a semiautomated tool is that it can be tailored to individual patients, allowing the user to account for acute or chronic imaging findings (e.g., atelectasis or post-surgical changes) that are not part of the natural disease course of IPF. The main disadvantages of a semiautomated tool are a possible longer processing time and higher inter-observer variability. In our pilot study, the average time to derive the PSI score in the IPF cohort was 4 min. This is relatively fast and could be improved with further software developments. Interobserver agreement among 4 readers was good in both the full cohort (N = 100) and the IPF cohort (N = 50). Measurement bias was minimized by blinding the reader to the clinical data and focusing on an anatomic region of the lung rather than allowing the user to utilize visual clues of disease severity; however, some measurement bias may still exist.
This study had several limitations. First, this was a retrospective pilot study with a small sample size derived for convenience of completing the study in a timely fashion, and the overall accuracy of the marker will likely differ in future studies with larger cohorts. A confirmatory study in a larger IPF cohort is underway. Second, the precision (repeatability and reproducibility) of the PSI score has not yet been evaluated. However, the PSI score was acquired using the LSN software, which has been shown to have high repeatability, reproducibility, and inter-observer agreement, and the high precision is expected to transfer to pulmonary surface evaluation [17]. Third, the data were derived from a single institution with a fixed HRCT image protocol. A large multi-institutional validation study is also underway with diversity in patient demographics, geography, and image acquisition and reconstruction techniques.
In conclusion, the PSI score had high accuracy and good inter-observer agreement on HRCT for predicting transplant-free survival in patients with IPF. The PSI score in the midlung was independent and more predictive of transplant-free survival than the GAP score. Furthermore, the PSI score is a simple, noninvasive, and widely applicable quantitative marker that can be acquired retrospectively from existing HRCT images, which are routinely obtained in patients with IPF. Overall, this is a pilot study, and the promising results should be viewed with cautious optimism. Additional validation studies are under way to confirm the results, and additional studies may expand the use of the PSI score for patient selection in clinical trials or treatment response evaluation.
Supplementary Information
Below is the link to the electronic supplementary material.
Data Availability
The datasets generated and/or analyzed during the current study are available from the corresponding author upon request.
Declarations
Ethics Approval
Informed consent was waived for this institutional review board–approved Health Insurance Portability and Accountability Act (HIPAA)–compliant retrospective single-center observational pilot study.
Footnotes
Publisher's Note
Springer Nature remains neutral with regard to jurisdictional claims in published maps and institutional affiliations.
References
- 1.Richeldi L, Collard HR, Jones MG. Idiopathic pulmonary fibrosis. Lancet. 2017;389:1941–1952. doi: 10.1016/S0140-6736(17)30866-8. [DOI] [PubMed] [Google Scholar]
- 2.Ley B, Collard HR, King TE., Jr Clinical course and prediction of survival in idiopathic pulmonary fibrosis. Am J Respir Crit Care Med. 2011;183:431–440. doi: 10.1164/rccm.201006-0894CI. [DOI] [PubMed] [Google Scholar]
- 3.Raghu G, Collard HR, Egan JJ, et al. An official ATS/ERS/JRS/ALAT statement: idiopathic pulmonary fibrosis: evidence-based guidelines for diagnosis and management. Am J Respir Crit Care Med. 2011;183:788–824. doi: 10.1164/rccm.2009-040GL. [DOI] [PMC free article] [PubMed] [Google Scholar]
- 4.Kim HJ, Perlman D, Tomic R. Natural history of idiopathic pulmonary fibrosis. Respir Med. 2015;109:661–670. doi: 10.1016/j.rmed.2015.02.002. [DOI] [PubMed] [Google Scholar]
- 5.Gleeson F, Fraser E. Hyperpolarized Xenon MRI, Further Evidence of Its Use in Progressive Pulmonary Fibrosis? Radiology. 2022;305:697–698. doi: 10.1148/radiol.221381. [DOI] [PubMed] [Google Scholar]
- 6.Hunninghake GM. A new hope for idiopathic pulmonary fibrosis. N Engl J Med. 2014;370:2142–2143. doi: 10.1056/NEJMe1403448. [DOI] [PubMed] [Google Scholar]
- 7.Nathan SD, Meyer KC. IPF clinical trial design and endpoints. Curr Opin Pulm Med. 2014;20:463–471. doi: 10.1097/MCP.0000000000000091. [DOI] [PMC free article] [PubMed] [Google Scholar]
- 8.Wu X, Kim GH, Salisbury ML, et al. Computed Tomographic Biomarkers in Idiopathic Pulmonary Fibrosis. The Future of Quantitative Analysis. Am J Respir Crit Care Med 2019; 199:12–21 [DOI] [PubMed]
- 9.Sullivan DC, Obuchowski NA, Kessler LG, et al. Metrology Standards for Quantitative Imaging Biomarkers. Radiology. 2015;277:813–825. doi: 10.1148/radiol.2015142202. [DOI] [PMC free article] [PubMed] [Google Scholar]
- 10.Raghu G, Collard HR, Anstrom KJ, et al. Idiopathic pulmonary fibrosis: clinically meaningful primary endpoints in phase 3 clinical trials. Am J Respir Crit Care Med. 2012;185:1044–1048. doi: 10.1164/rccm.201201-0006PP. [DOI] [PMC free article] [PubMed] [Google Scholar]
- 11.Nathan SD, Shlobin OA, Weir N, et al. Long-term course and prognosis of idiopathic pulmonary fibrosis in the new millennium. Chest. 2011;140:221–229. doi: 10.1378/chest.10-2572. [DOI] [PubMed] [Google Scholar]
- 12.Ley B, Ryerson CJ, Vittinghoff E, et al. A multidimensional index and staging system for idiopathic pulmonary fibrosis. Ann Intern Med. 2012;156:684–691. doi: 10.7326/0003-4819-156-10-201205150-00004. [DOI] [PubMed] [Google Scholar]
- 13.Kusmirek JE, Martin MD, Kanne JP. Imaging of Idiopathic Pulmonary Fibrosis. Radiol Clin North Am. 2016;54:997–1014. doi: 10.1016/j.rcl.2016.05.004. [DOI] [PubMed] [Google Scholar]
- 14.Martin MD, Chung JH, Kanne JP. Idiopathic Pulmonary Fibrosis. J Thorac Imaging. 2016;31:127–139. doi: 10.1097/RTI.0000000000000204. [DOI] [PubMed] [Google Scholar]
- 15.Raghu G, Remy-Jardin M, Myers JL, et al. Diagnosis of Idiopathic Pulmonary Fibrosis. An Official ATS/ERS/JRS/ALAT Clinical Practice Guideline. Am J Respir Crit Care Med 2018; 198:e44-e68 [DOI] [PubMed]
- 16.Smith AD, Porter KK, Elkassem AA, Sanyal R, Lockhart ME. Current Imaging Techniques for Noninvasive Staging of Hepatic Fibrosis. AJR Am J Roentgenol. 2019;213:77–89. doi: 10.2214/AJR.19.21144. [DOI] [PubMed] [Google Scholar]
- 17.Smith A, Varney E, Zand K, et al. Precision analysis of a quantitative CT liver surface nodularity score. Abdom Radiol (NY) 2018;43:3307–3316. doi: 10.1007/s00261-018-1617-x. [DOI] [PubMed] [Google Scholar]
- 18.Elkassem AA, Allen BC, Lirette ST, et al. Multiinstitutional Evaluation of the Liver Surface Nodularity Score on CT for Staging Liver Fibrosis and Predicting Liver-Related Events in Patients with Hepatitis C. AJR Am J Roentgenol 2021; [DOI] [PubMed]
- 19.Pleasants R, Tighe RM. Management of Idiopathic Pulmonary Fibrosis. Ann Pharmacother. 2019;53:1238–1248. doi: 10.1177/1060028019862497. [DOI] [PMC free article] [PubMed] [Google Scholar]
- 20.Chen A, Karwoski RA, Gierada DS, Bartholmai BJ, Koo CW. Quantitative CT Analysis of Diffuse Lung Disease. Radiographics. 2020;40:28–43. doi: 10.1148/rg.2020190099. [DOI] [PubMed] [Google Scholar]
- 21.Nalysnyk L, Cid-Ruzafa J, Rotella P, Esser D. Incidence and prevalence of idiopathic pulmonary fibrosis: review of the literature. Eur Respir Rev. 2012;21:355–361. doi: 10.1183/09059180.00002512. [DOI] [PMC free article] [PubMed] [Google Scholar]
- 22.King TE, Jr, Pardo A, Selman M. Idiopathic pulmonary fibrosis. Lancet. 2011;378:1949–1961. doi: 10.1016/S0140-6736(11)60052-4. [DOI] [PubMed] [Google Scholar]
Associated Data
This section collects any data citations, data availability statements, or supplementary materials included in this article.
Supplementary Materials
Data Availability Statement
The datasets generated and/or analyzed during the current study are available from the corresponding author upon request.


